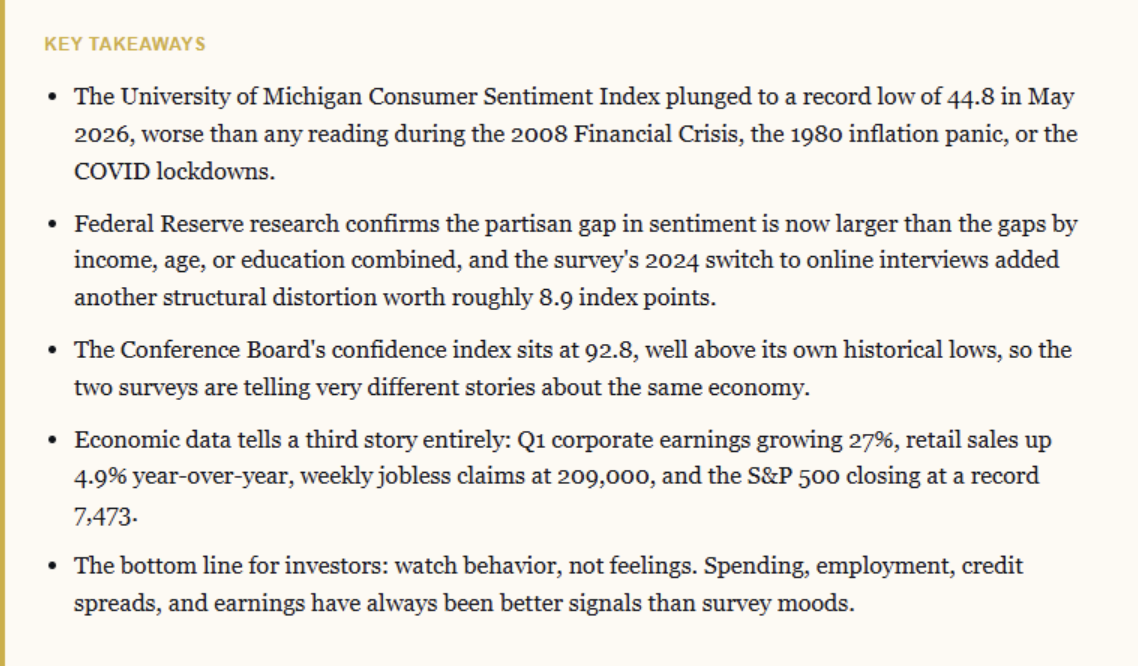
The University of Michigan’s Consumer Sentiment Index just printed 44.8 in May. That’s the worst reading since the survey began in 1952. That print was lower than in 2008 and the 1980 inflation panic. It was also worse than the COVID lockdowns, yet the S&P 500 continues to climb higher, Q1 corporate earnings posted 27% growth, and weekly jobless claims sit near cycle lows. That “disconnect” has sparked many statements on social media, such as:
“GDP is growing at a healthy 2.7% in the US. GDP statistics in the US are clearly completely broken and no longer make any sense whatsoever.” – Philip Pilkington
That statement sums up many of the concerns I have read as of late, and the University of Michigan consumer sentiment disconnect from economic reality demands an honest answer. Which set of data is wrong? I think the honest answer is both, and neither. Over the last three decades, I’ve learned that surveys and behavior often part ways, and the gap usually tells you more about the survey than about the consumer. So let’s walk through what’s actually happening, because the consumer sentiment disconnect isn’t a single story. It’s three stories stacked on top of each other.
Start with the disconnect itself. If you only looked at the Michigan headline, you’d assume the country was in a depression. However, when you look at what people are actually doing, the picture changes completely.
Retail sales rose 0.5% in April and are running 4.9% above year-ago levels. In addition, Q1 earnings season has delivered an 84% beat rate on the S&P 500, well above the 5-year average of 78%, with aggregate earnings beating estimates by 20.7%. That’s the strongest surprise rate since the first quarter of 2021. Furthermore, initial jobless claims came in at 209,000 for the week ending May 16. Unemployment is sitting at 4.3%. Notably, the Atlanta Fed’s GDPNow model is tracking 4.3% annualized growth for Q2 as of May 21.
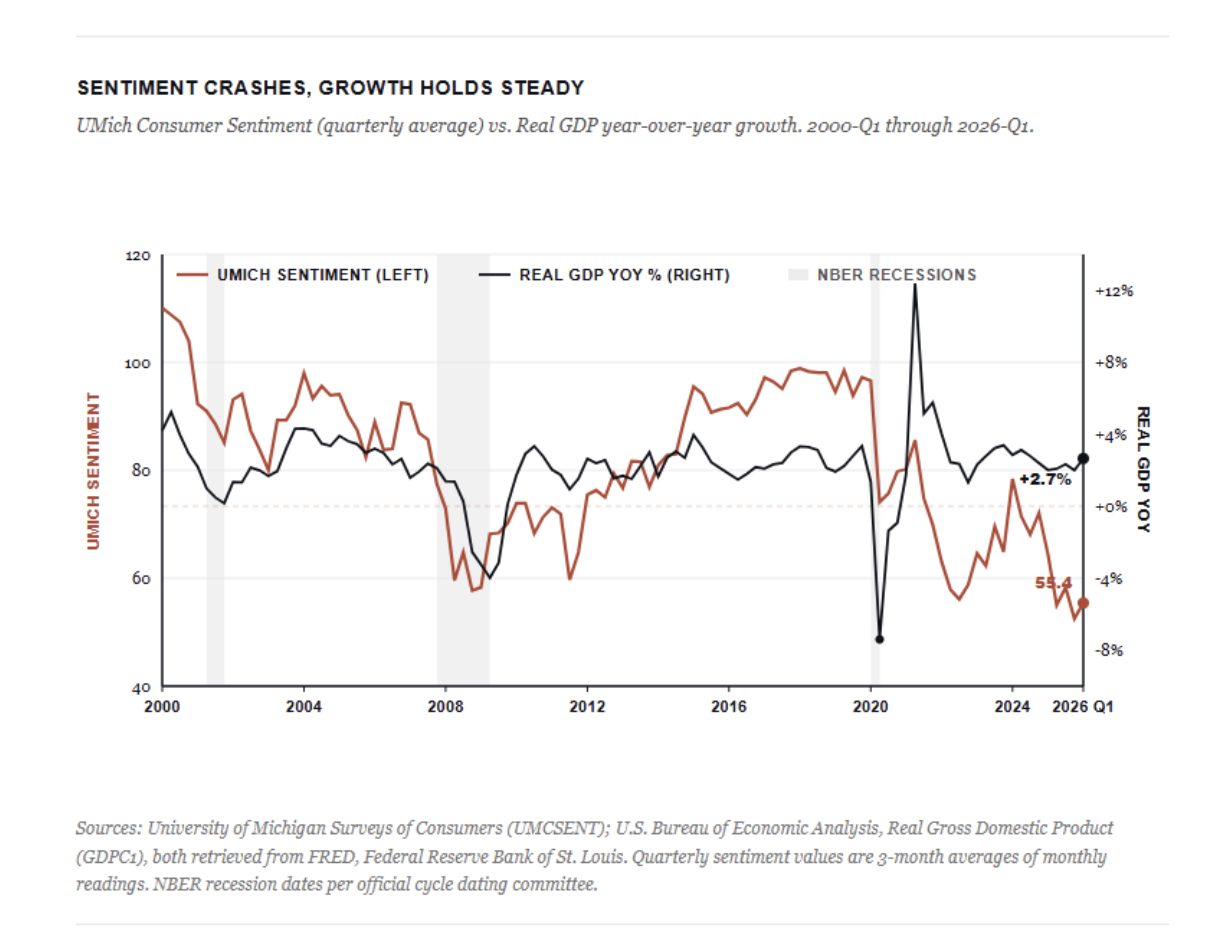
Notice in the chart above what’s never happened in the 25-year history of this comparison. In every prior cycle, sentiment and growth moved roughly in step. The 2001 mild recession, the Global Financial Crisis, and the COVID lockdowns all show sentiment and GDP cratering and recovering side by side. Since 2022, that relationship has broken in a way it never broke before. GDP has been running between +2% and +3% year over year for three straight years. Consumer sentiment has been running below 70 the entire time, levels that historically only appeared during deep recessions. The gap in the lower-right corner of that chart is the entire argument.
Meanwhile, the headline economic narrative making the rounds on social media insists that GDP statistics are “completely broken” and that real data show a hidden recession. Here’s the problem with that argument. The labor market, spending, earnings, and credit data all line up in the same direction. They don’t agree with the sentiment survey, but they do agree with each other. So when one indicator disagrees with five, the prior should be on the one. That’s the heart of the consumer sentiment disconnect we need to explain. We flagged an earlier version of this same divergence in February, when economic sentiment was already at odds with the strong macro data-based estimates.
Read more: Social Insecurity, Surprise Edition
Yes, There Really Is a Partisan Problem
So why is the Michigan survey saying something so different? Part of the answer is exactly what many investors suspect, and the data backs it up.
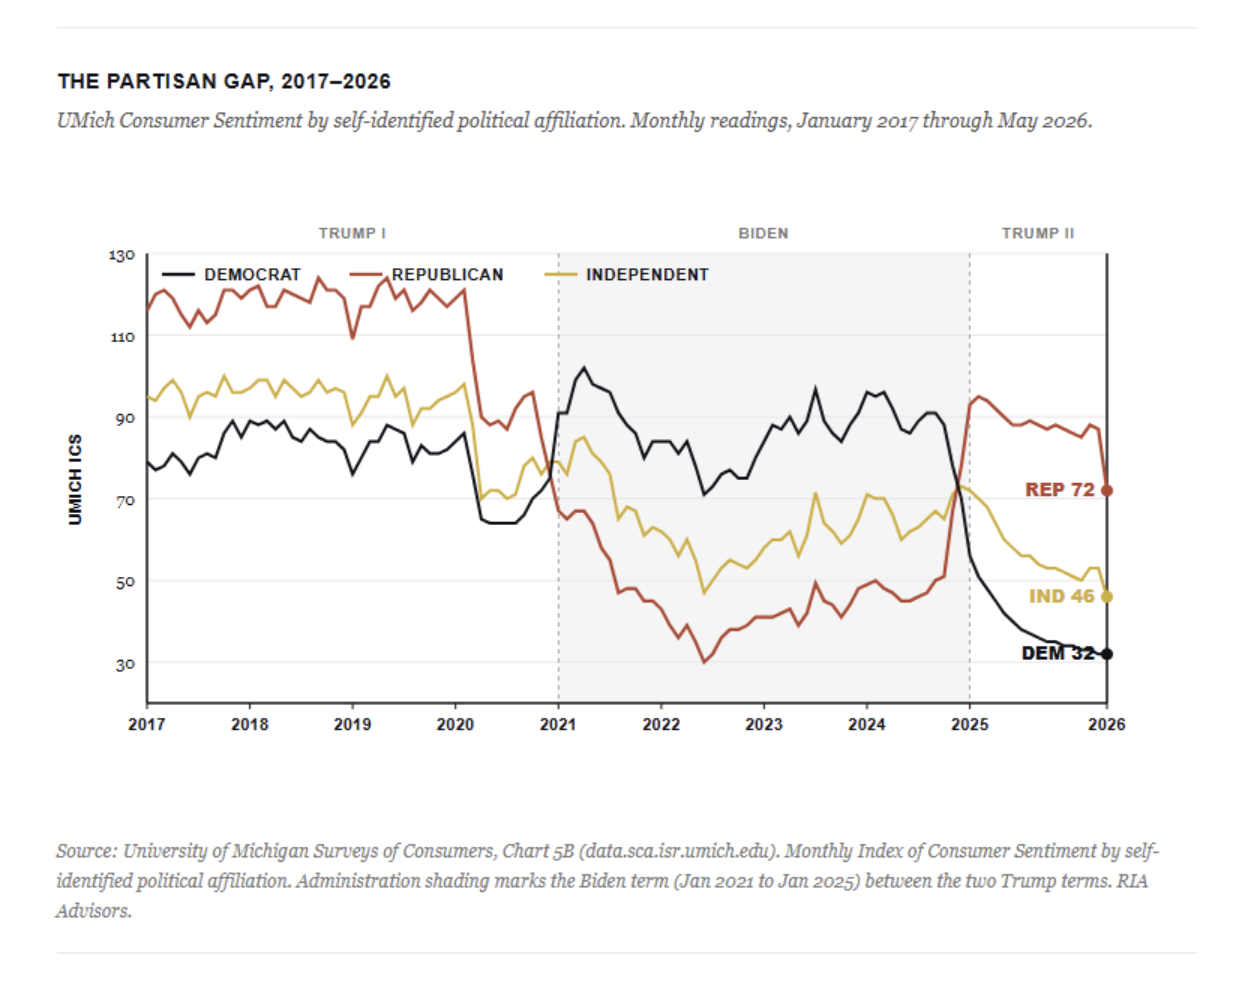
Notice in the chart above what happens at every administration handoff. In January 2021, the navy line shoots up while the red line plunges almost vertically. The two cross within weeks of Biden’s inauguration, and Independents barely budge in the middle. Then it happens again in January 2025, only sharper. Republican sentiment surges from 67 to 93 in two months, while Democrats collapse from 78 to 56 over the same window. The X-pattern at each transition is the partisan gap in action. The survey isn’t measuring the economy. It’s capturing tribal loyalty, and that mechanic is a meaningful slice of the consumer sentiment disconnect we’re trying to explain.
The Richmond Federal Reserve published research in 2024 that found something striking. Specifically, the partisan gap in consumer sentiment is now far larger than the gap by income, age, or education level. Per the Richmond Fed analysis, the gap between Democratic and Republican sentiment expanded from 21 points under George W. Bush to 25 points under Obama, and then to 45 points under Biden. That’s not noise. That’s a structural issue with how the survey is being completed.
Moreover, it gets worse. Researchers at BriefingBook documented what they call “asymmetric amplification.” Republicans swing their sentiment responses roughly 2.5 times as much as Democrats do, depending on who controls the White House. When their party wins, they go euphoric, but when they lose, they go bleak. Democrats do this too, just less violently. Importantly, adjusting only for that asymmetry closes about 30% of the gap between predicted and observed sentiment over the post-2020 period.
Fundstrat’s Tom Lee made waves last week with an even sharper critique. He pointed out that 51% of Democratic respondents are now reporting sentiment readings below the survey’s all-time worst reading of 47.6. He also flagged that around a quarter of Democratic respondents believe inflation is currently running above 100%. Clearly, that isn’t a forecast. That’s a vote.
Now layer on something most readers haven’t heard about. In 2024, the University of Michigan switched from cellular phone surveys conducted via random-digit dialing to an online-only address-based sampling method. The change began in April and was fully completed by July of that year.
U-M’s surveys director, Joanne Hsu, has consistently maintained that the methodology change produced comparable results. However, the independent research disagrees. Cummings and Tedeschi, in a widely cited analysis published in BriefingBook, estimated that the switch from phone to online interviews lowered the sentiment index by about 8.9 points, or more than 11%. They benchmarked their adjustment against Morning Consult’s continuous online sentiment survey, which uses the same five core questions but has been online since 2018. Notably, Morning Consult’s index did not show the same precipitous decline as Michigan’s headline number. That gap alone accounts for a meaningful slice of the consumer sentiment disconnect.
Tom Lee added a further claim that I’ll attribute to him because I haven’t independently verified the underlying response data. He stated that the new online survey is producing a respondent breakdown of roughly 66% Democratic and 33% Republican, which would not be representative of the U.S. adult population. Whether or not that exact ratio holds, the broader point stands. In fact, self-selection bias on online opt-in is a known issue, and the structural break in the series is real.
The Conference Board Tells a Different Story
This brings us to the question I’ve raised previously. If the Michigan number is so distorted, what does the other major survey say? The Conference Board’s Consumer Confidence Index gives us a useful check.
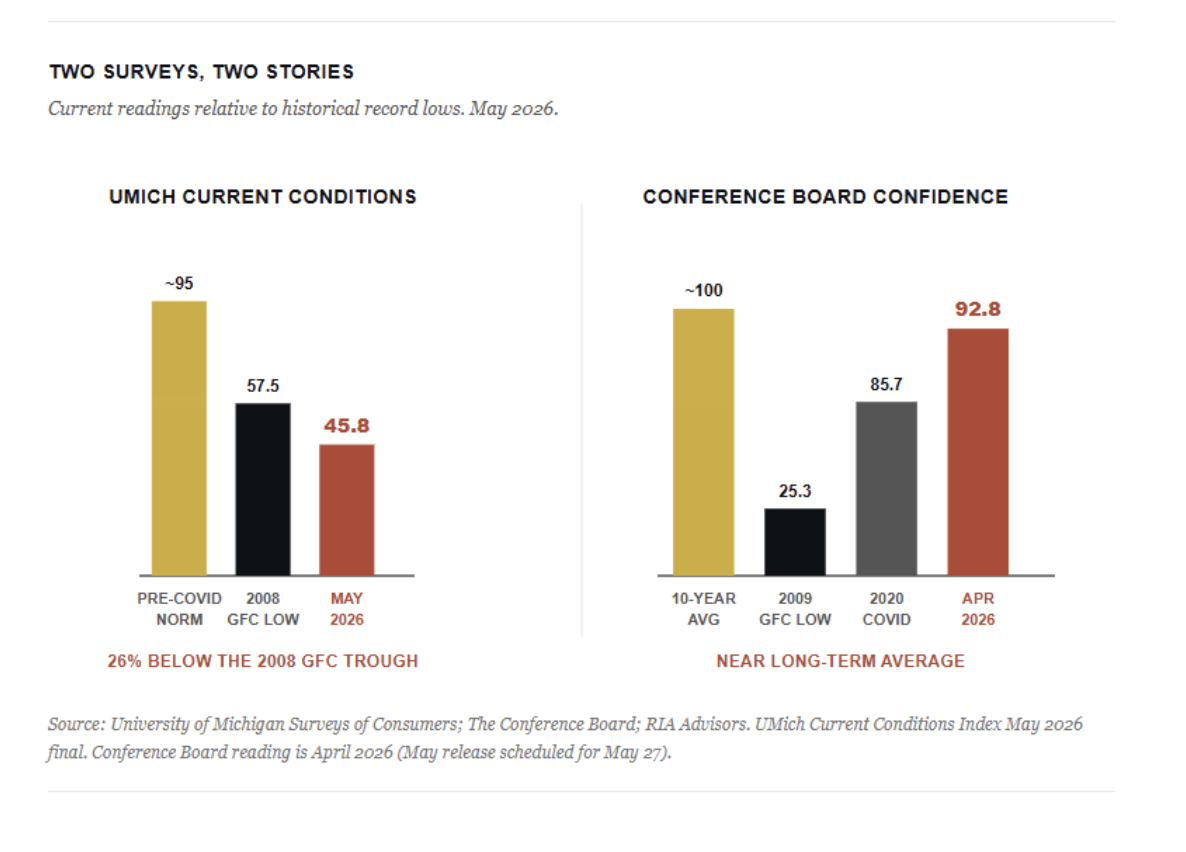
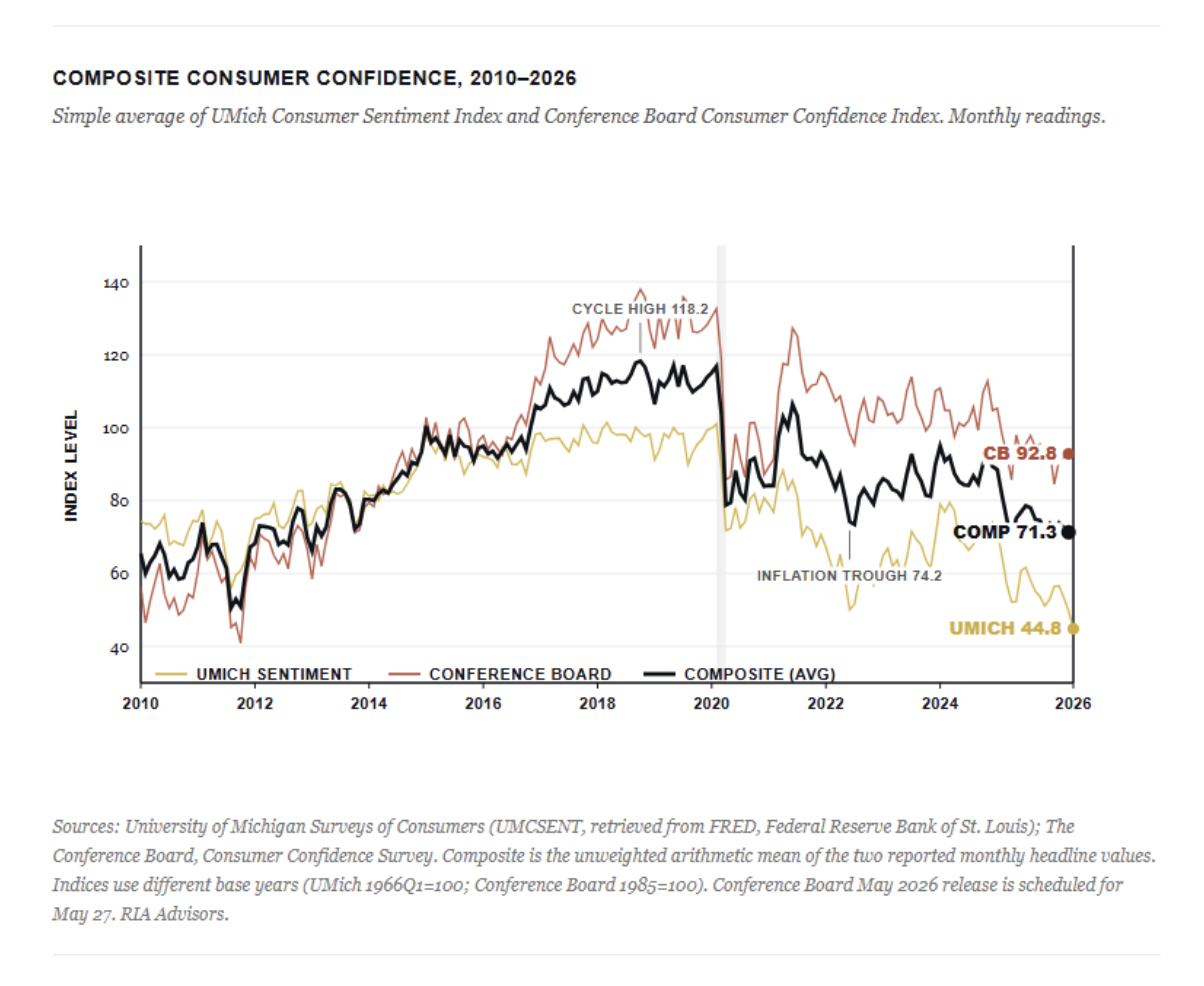
Notice in the chart above just how different the two stories are. The Michigan survey’s Current Economic Conditions component is 26% below its 2008 financial crisis trough. By contrast, the Conference Board’s index, while soft, sits near its long-term average and remains well above every cyclical low of the modern era. Consider the historical anchors. In 2009, the Conference Board bottomed at 25.3. During the 2020 COVID shock, it hit 85.7. Today’s reading of 92.8 isn’t a crisis print on that scale.
Methodologically, the two surveys measure different things. The Conference Board’s index places greater weight on labor market and current business conditions. The Michigan survey places greater emphasis on household finances and inflation perceptions. When inflation perception is the dominant factor and partisan respondents spontaneously volunteer inflation rates above 100% as a protest vote, you get the Michigan number.
The real question is whether the partisan effect is mitigated in the Conference Board’s Consumer Confidence Index? The honest answer is partly. The Conference Board doesn’t publish party-affiliation crosstabs the way Michigan does, so we can’t directly measure their internal partisan gap. However, its methodology is less exposed to the specific inflation-expectation channel where the partisan skew is most extreme. And its readings show that.
But This Time, Republicans Are Sour Too
Now here’s where the partisan-bias narrative needs an honest correction. If you stopped reading at “the Michigan survey is just upset Democrats,” you’d miss something important about the May 2026 reading.
According to the University of Michigan’s own release on May 22, sentiment among Independents and Republicans dropped to the lowest readings of the current presidential administration. Democratic sentiment, in contrast, was little changed from April. Republican long-run inflation expectations have more than doubled on a monthly basis since February 2025. The cost-of-living concern is showing up across the political spectrum, not just on one side.
Why? Two reasons. First, gasoline prices surged 12.3% in April thanks to the ongoing conflict with Iran and the supply disruptions in the Strait of Hormuz. Pump prices are at levels not seen since 2022. Gas is the most visible price in the American economy, and it’s hitting every household. Second, tariff-related price pressure is starting to filter through, and roughly 30% of respondents in early May spontaneously mentioned tariffs as a concern. Make no mistake, those aren’t imagined problems.
So the partisan-bias critique is real, but it’s only part of the story. The 2026 Michigan plunge contains a partisan distortion, a methodology distortion, and a genuine bipartisan reaction to higher prices. In short, the consumer sentiment disconnect we’re seeing isn’t just noise. Pulling those threads apart matters if you want to use the data correctly.
“The Michigan survey isn’t broken. It’s measuring something narrower than the headline suggests, and what it’s measuring is real. The question is whether what it’s measuring should drive your portfolio.”
Why The Consumer Sentiment Disconnect Rarely Predicts Spending
The most important question isn’t whether the Michigan number is “correct.” It’s whether the number actually predicts anything useful for investors. Decades of research from the Federal Reserve system suggest the answer is largely “no.“
A February 2026 paper from the Kansas City Federal Reserve titled “Forecasting with Feelings” found that the link between consumer sentiment and growth in real household spending has been modest historically. The authors built two forecasting models: one using only official economic data, and one augmenting that data with consumer sentiment surveys. The sentiment-augmented model didn’t materially improve the forecast over the past 30 years. Fed Chair Jerome Powell echoed that finding in his May 2025 press conference, stating directly that “the link between sentiment data and consumer spending has been weak. It’s not been a strong link at all.”
A 2014 Boston Fed paper reached a similar conclusion. When you control for standard fundamentals such as income, employment, and wealth, the role of consumer sentiment in predicting consumption is marginal at best. People can feel terrible about the economy, yet still spend. We’ve seen that play out for almost three full years now.
The composite chart, which combines the Michigan and Conference Board indices to dampen the noise in each survey, clearly shows the broader pattern. Confidence has weakened from cycle highs, but the market has continued to advance. As we covered in our prior analysis of the confidence dichotomy between consumers and investors, there have been three other periods where stocks rallied while sentiment fell. The dot-com bubble. The mid-cycle expansion of the late 1990s. And the post-COVID period. In each of those cases, the market eventually had to reckon with reality, but the disconnect lasted longer than skeptics expected.
The composite sits at 71 today, a full 47 points below the October 2018 cycle high of 118. Over that same stretch, the S&P 500 has more than doubled, and that’s the consumer sentiment disconnect we’ve been pointing at for the better part of three years.
What Investors Should Actually Watch
If sentiment surveys aren’t reliable inputs for portfolio decisions, what is? My answer is the same one I’ve given for 20 years. Behavior beats feelings every time. So watch what consumers and businesses are doing with their money, not what they say in a survey. That single shift in focus turns the consumer sentiment disconnect from a confusing headline into a useful contrarian signal.
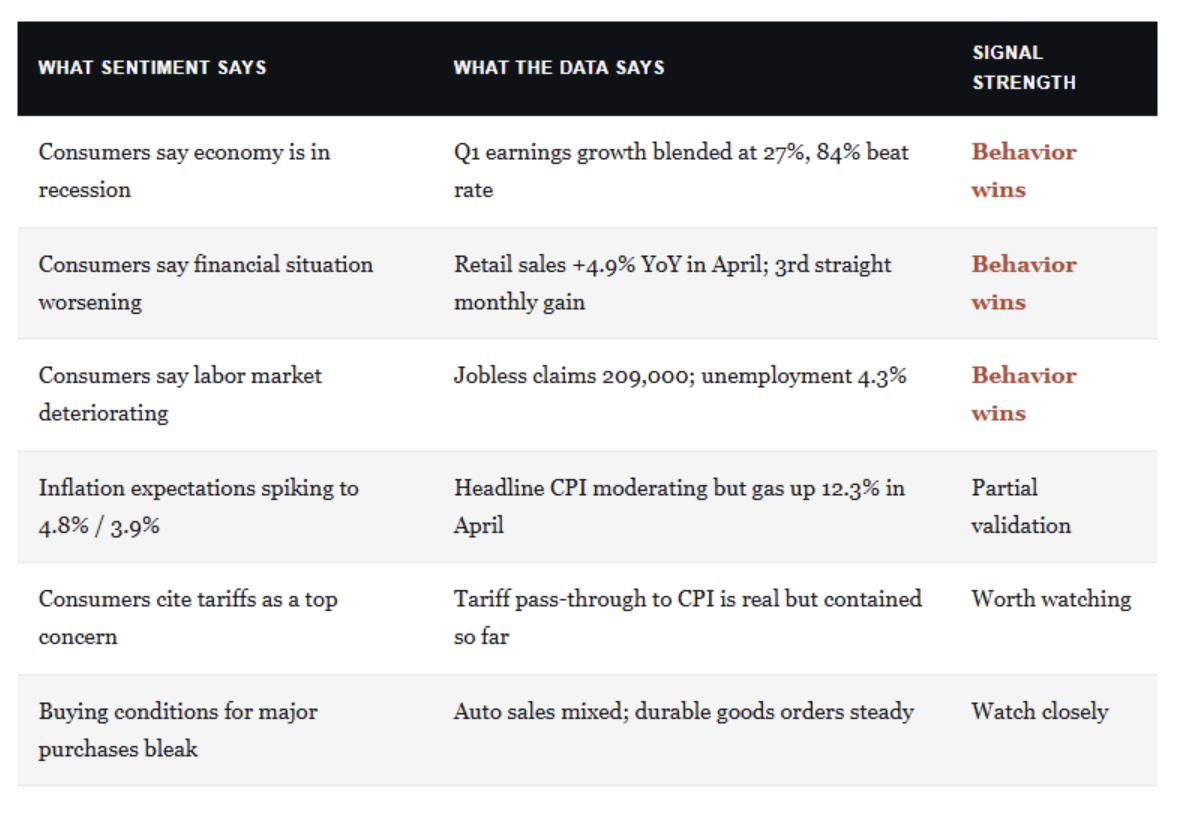
The takeaway from that table is simple. Five of the six categories show behavior diverging from sentiment in the same direction. People are saying one thing and doing another. When that happens at this scale, you don’t trade off the talk. You trade off the action.
That said, two items in the table do deserve real attention. Gas prices are a tax on consumers and on margins. If the Iran conflict drags into the summer driving season, demand destruction becomes a real risk for cyclical names. And tariff pass-through is the slow leak that markets keep underpricing. Importantly, those are concrete data series we can monitor, not abstract sentiment vibes. Pump prices, container shipping rates, retailer margin guidance, and consumer credit delinquencies are on the watchlist.
The Conference Board’s index, the Atlanta Fed’s GDP nowcast, the earnings beat rate, the retail sales print, and the jobless claims data all point to an economy that is slowing in some places, accelerating in others, and not remotely close to the Depression-era reading on the Michigan headline. What does this mean for investors? Stay disciplined. Watch the behavioral data. Maintain risk-management protocols. Be ready to lean in when the noise creates a real dislocation, and be ready to lean out when the data, not the surveys, actually rolls over.
Consumers are gloomy. Some of that gloom is justified, particularly around gas and inflation. But gloom is not a portfolio strategy.
Sources
- University of Michigan Surveys of Consumers, May 2026 final release, sca.isr.umich.edu
- The Conference Board, Consumer Confidence Index April 2026, conference-board.org
- Federal Reserve Bank of Richmond, “Sentiment Is Sweet When You’re in the Driver’s Seat,” March 2024
- BriefingBook, “Asymmetric Amplification and the Consumer Sentiment Gap,” Cummings & Tedeschi
- BriefingBook, “The Effect of Online Interviews on the University of Michigan Survey of Consumer Sentiment,” October 2024
- Federal Reserve Bank of Kansas City, “Forecasting with Feelings: The Modest Link Between Consumer Sentiment and Spending,” February 2026
- Federal Reserve Bank of Boston Working Paper, “The Forecasting Power of Consumer Attitudes for Consumer Spending”
- FactSet Earnings Insight, Q1 2026 update, insight.factset.com
- U.S. Census Bureau, Advance Monthly Retail Trade Survey, April 2026 release
- U.S. Department of Labor, Unemployment Insurance Weekly Claims Report, week ending May 16, 2026
- Federal Reserve Bank of Atlanta, GDPNow, May 21, 2026
Lance Roberts is a Chief Portfolio Strategist/Economist for RIA Advisors. He is also the host of “The Lance Roberts Podcast” and Chief Editor of the “Real Investment Advice” website and author of “Real Investment Daily” blog and “Real Investment Report“. Follow Lance on Facebook, Twitter, Linked-In and YouTube Customer Relationship Summary (Form CRS)
Join RIA Advisors and elevate your career within a deeply experienced team focused on innovation. Our collaborative environment is built on a foundation of advanced technology and effective investment models, designed to enhance your ability to serve clients and grow your practice. Benefit from a supportive culture that encourages professional development and fosters a forward-thinking approach. By joining our team, you’ll be part of a group dedicated to excellence and continuous improvement, empowering you to focus on building meaningful client relationships and pursuing your business ambitions. Discover the advantages of working with our accomplished advisory team by starting your conversation today.
A message from Advisor Perspectives and VettaFi: Discover something new! Click here to register for our upcoming webcasts.
© Real Investment Advice
More Closed End Funds Topics >