As we enter 2026, the U.S. economic momentum continues based on the foundation of a solid private sector with fiscal and monetary policies also contributing to growth. As we refine our global asset allocation, we maintain a diversified overweight stance on U.S. equities despite relatively high valuations.
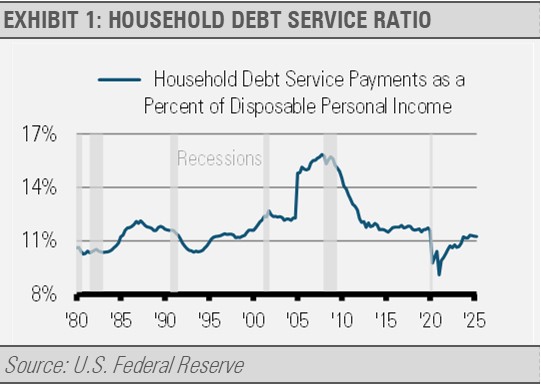
While every household is different and lower income families face more challenges, personal income growth has outpaced inflation overall and household debt-to-income is below the previous business cycle average. Solid household finances leave room for consumer spending growth.
Since bottoming during the Global Financial Crisis, inflation-adjusted personal income has grown, save for the sharp and brief drop during the pandemic era economic shut down. At the same time, the household debt service ratio has stabilized at a rate lower than the previous cycle average, below what we experienced during the mid-1980s, and close to where the U.S. was throughout the strong 1990s economic cycle.

Despite the challenges we see in some areas like student loan debt, delinquencies in auto loans, credit cards, and mortgages have stabilized at normal levels. This data suggests that U.S. households are generally on a solid financial footing. The ongoing federal budget deficits are the bigger issue in our view. Still, the problems resulting from ongoing federal budget deficits can take years or decades to materialize and the U.S. is still on a better footing than many other developed nations that are not showing significant signs of distress. This is materially different than the situation that we saw leading up to the Global Financial Crisis.
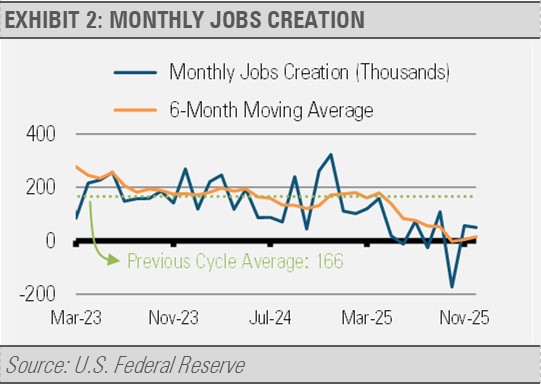
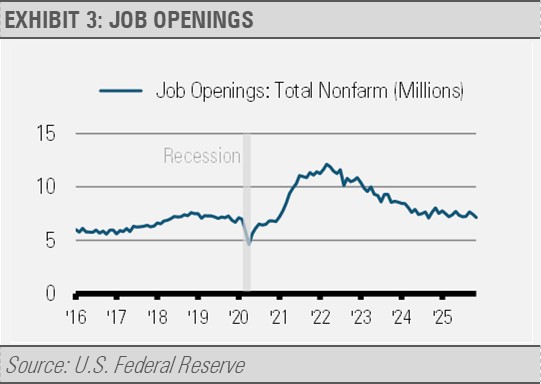
Nothing is more fundamental to economic health than jobs creation, which has clearly slowed as 2025 progressed. We think this slowing is due to multiple factors including the reduction in the size of the federal workforce, uncertainty around the impact of tariffs and other policies on the domestic economy, and a slowing of the growth rate of the labor force. Still, the number of job openings is holding at a level consistent with where the economy was prior to the pandemic. Meanwhile, weekly unemployment insurance claims, a proxy for layoffs, remain in a range that does not suggest that businesses are reducing their workforces overall. While certainly not strong, the jobs market has not collapsed in a way that signals an economic recession, but rather a balance between labor force growth and demand for new employees.
Additionally, we are witnessing a rare streak of corporate efficiency. The third quarter of 2025 marked the fourth straight quarter of double-digit earnings growth with 82% of companies exceeding estimates. Analysts now project a robust 15% earnings growth for 2026 according to FactSet.
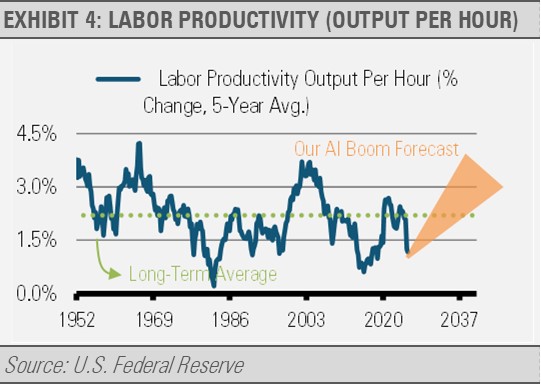
New innovations resulting from the boom in research and development (R&D) spending can lead to an acceleration in productivity. Productivity growth often translates to faster economic growth without increasing inflationary pressures. Historically, productivity growth, or output per hour, has led to higher living standards. We expect this to be true once again as the U.S. enters a growth cycle similar to what we saw during the 1990s.
The One Big Beautiful Bill Act (OBBBA) should be a 2026 growth engine. By restoring immediate R&D expensing (a $100 billion corporate windfall) and injecting $150 billion in incremental tax refunds into the consumer sector between February and May, the OBBA is directly supporting both corporate margins and household consumption
Having cut short-term interest rates by roughly one-third from the peak, the U.S. Federal Reserve’s (Fed) pivot with interest rate cuts combined with the official end of Quantitative Tightening in December 2025 provides lower borrowing costs and a liquidity cushion. This decoupling from an inflation-only focus towards a more balanced approach as the job market softens allows the Fed more room to lower rates in 2026.
With the S&P 500 Index hitting new all-time highs in 2025 and elevated valuations, the margin for error is thin. While not a timing signal, high multiples mean that any earnings disappointment can lead to outsized volatility.
Unlike the 1999 bubble, today’s leaders have solid balance sheets and strong cash flow. However, the risks have shifted from the fragility of 1999 to the concentration today. With a third of the market’s value in just seven names, the S&P 500 Index is highly sensitive to surprises both to the upside and to the downside.
The upcoming midterm election offers additional opportunities for market volatility. Historically, midterm election years see significant market volatility due to increased uncertainty until after the elections. The period leading up to the 2026 elections will likely be characterized by political noise and financial market swings.
Lastly, like the midterm elections, geopolitical risks often manifest in bouts of market volatility. Be it tensions with China, the Middle East, Russia, or Venezuela, these flair ups tend to be short-lived and represent buying opportunities in our opinion.
INVESTMENT IMPLICATIONS
We continue to favor equities over fixed income and the U.S. equity market over foreign equities. Not only is the U.S. more structurally sound than other foreign equity markets, but the U.S. economy may also be amplified by the stimulative effects of the One Beautiful Bill Act, such as tax cuts for households and more favorable tax treatments for R&D expenditures for businesses. Our favored equity sectors include financials, industrials, and information technology. Within fixed income, we see the best risk/reward tradeoffs in the belly of the yield curve and prefer asset backed securities overall.
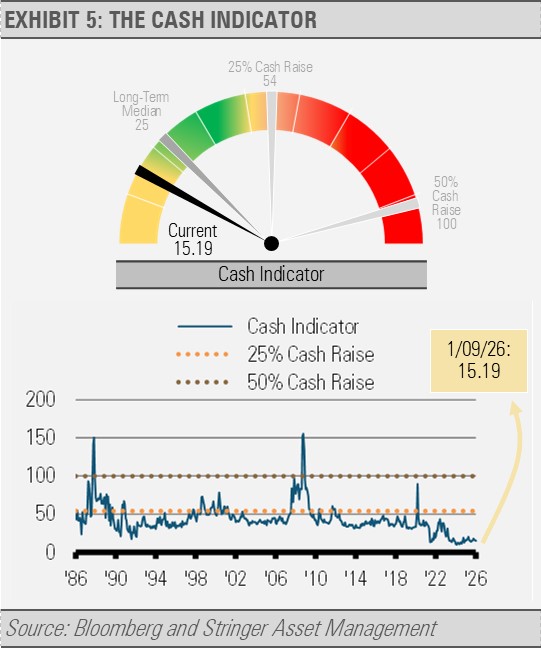
THE CASH INDICATOR
The level of the Cash Indicator (CI) reflects investor confidence in the financial markets. Equity market volatility has been subdued in recent weeks as upward market momentum continues. Similarly, the fixed income market reflects confidence as credit spreads remain tight. While complacency can make markets vulnerable, we still see a lack of euphoria even as the equity market makes new highs. We view this as a balanced and healthy situation.
For more news, information, and strategy, visit the ETF Strategist Content Hub.
Originally published on ETF Trends
DISCLOSURES
Any forecasts, figures, opinions or investment techniques and strategies explained are Stringer Asset Management, LLC’s as of the date of publication. They are considered to be accurate at the time of writing, but no warranty of accuracy is given and no liability in respect to error or omission is accepted. They are subject to change without reference or notification. The views contained herein are not to be taken as advice or a recommendation to buy or sell any investment and the material should not be relied upon as containing sufficient information to support an investment decision. It should be noted that the value of investments and the income from them may fluctuate in accordance with market conditions and taxation agreements and investors may not get back the full amount invested.
Past performance and yield may not be a reliable guide to future performance. Current performance may be higher or lower than the performance quoted.
The securities identified and described may not represent all of the securities purchased, sold or recommended for client accounts. The reader should not assume that an investment in the securities identified was or will be profitable.
Data is provided by various sources and prepared by Stringer Asset Management, LLC and has not been verified or audited by an independent accountant.
A message from Advisor Perspectives and VettaFi: Discover something new! Click here to register for our upcoming webcasts.
Read more commentaries by Stringer Asset Management