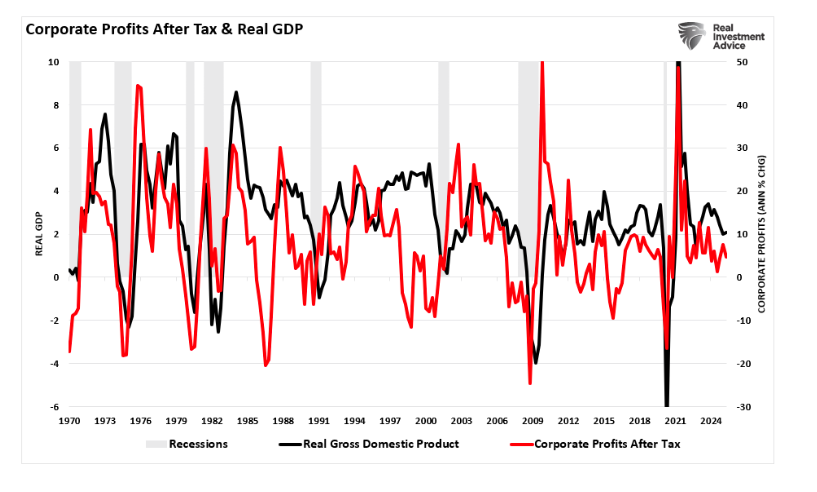
If you want to understand where we are in the cycle, skip the noise and follow profits. Corporate profits are the lifeblood of investment, hiring, and market returns. Crucially, linkage to the real economy is very tight. In the national accounts (NIPA), the BEA’s “profits from current production” (with inventory valuation and capital consumption adjustments) rose in Q2-2025, but only modestly: up $6.8 billion from Q1, and notably revised down by $58.7 billion from the prior estimate. That’s not the surge you’d expect if we were entering a new, powerful profit upswing. The correlation is unsurprising, given that economic activity generates the revenue to obtain corporate profits.

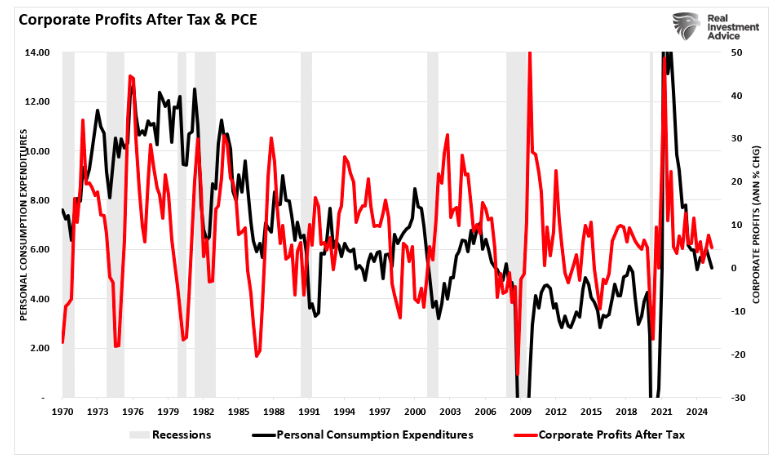
While the revision to the third estimate of real Q2 GDP growth increased to 3.8% annualized, all was not what it seemed. The reversal of the import surge in Q1 to get ahead of tariffs did the heavy lifting in Q2. More notably, consumer spending, the main driver of economic activity, showed continued weakness. Again, the linkage between PCE and corporate profits is critical, given that spending generates corporate revenues.
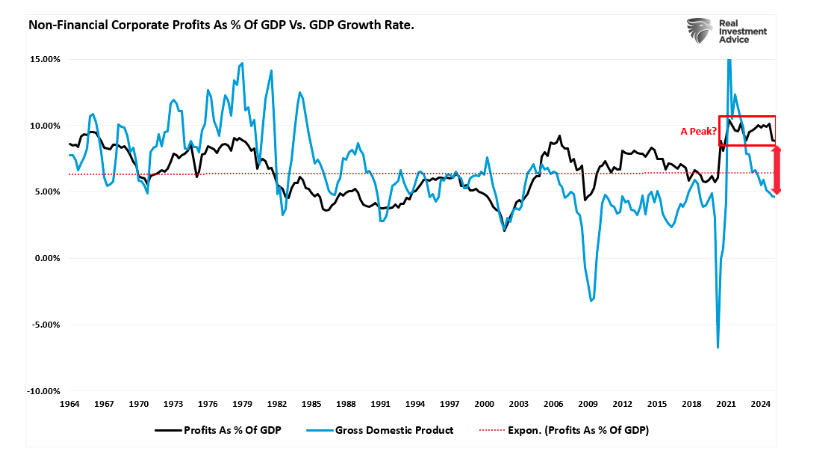
The point for investors is that while the economic growth number “looks” hot, the profits revision tells a quieter story about corporate income momentum. In other words, output accelerated, but profit growth didn’t follow in lockstep. That divergence matters for equity investors who ultimately get paid in earnings, not GDP. On a level basis, after-tax corporate profits (CPATAX) stood at roughly $3.26 trillion SAAR in Q2-2025, near the high end of the post-pandemic range but not breaking decisively higher. However, net profit margins have come under pressure, and economic growth has slowed. That “plateau with wiggles” profile of the last two years remains intact, and while margins remain elevated, when margins flatten as price multiples rise, future return math tends to get harder.
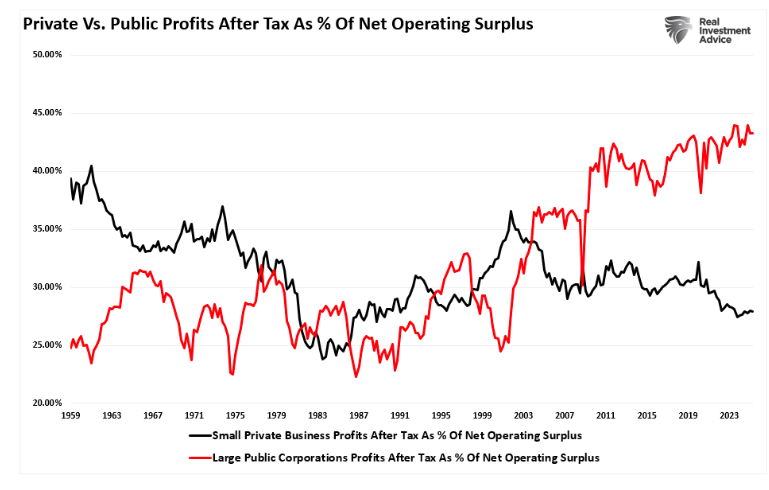
Zoom in on the listed companies, and you get a similar nuance. FactSet’s S&P 500 Q2-2025 dashboard shows blended earnings growth accelerating year-over-year with net profit margins around 12.3%, still above long-run norms and reflecting solid breadth of beats. Good news, but the market had already priced a lot of good news. However, the rest of the economy is not seeing the same growth. The deviation between large public and small private net operating surpluses is quite dramatic.
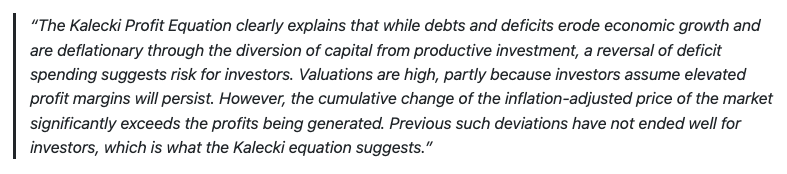
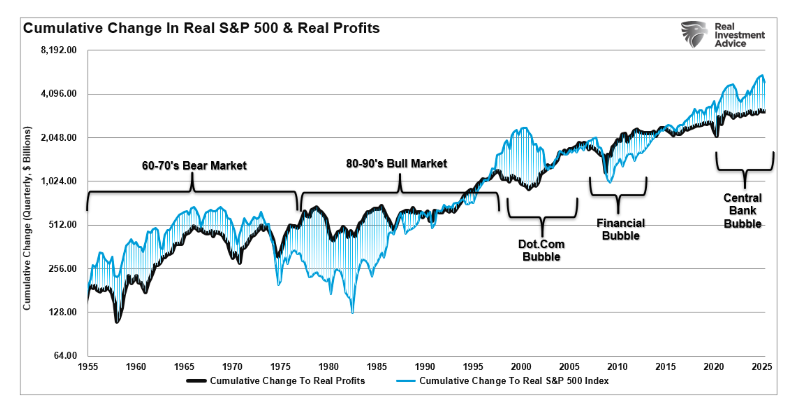
Regular readers of our work at RealInvestmentAdvice will remember we’ve been writing for years that profits and the economy move together over complete cycles, and that revenue and profits don’t levitate indefinitely above economic capacity. The thread through my prior pieces, specifically on Kalecki’s profit identity, is the detachment of markets from fundamentals. The earnings-economy linkage, fiscal impulses, savings behavior, and trade balances can push profits temporarily above trend, but gravity eventually reasserts itself.
That lens is still helpful in 2025.
Profits, Prices, and Pay: How Inflation Filters Into Margins
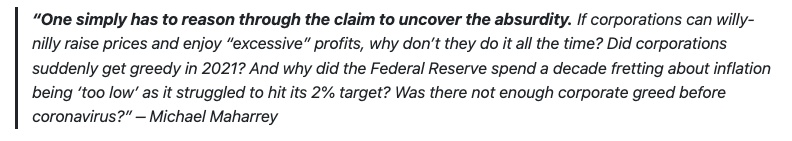
The revival of an old debate followed the pandemic and its aftermath. Are corporate margins the cause of inflation, or the result of it? As discussed in Corporate Greed Is Not The Cause Of Inflation, corporations are victims of inflation, not the cause.
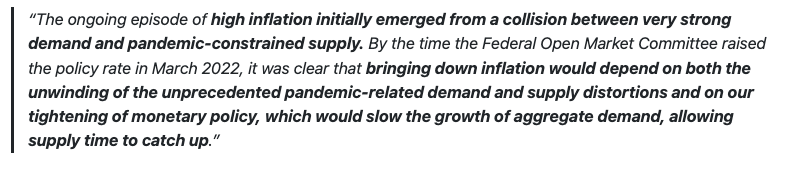
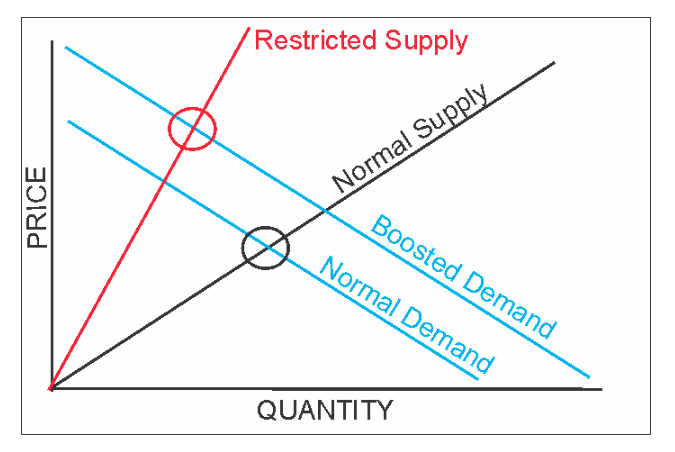
The European Central Bank (ECB) was one of several studies confirming our previous thesis. “Profit-led inflation” can emerge when factors constrain supply but demand remains high. Fed Chair Jerome Powell also noted such:
In other words, basic economics states that if the supply/demand curve shifts, inflation will be the consequence if supply constricts.
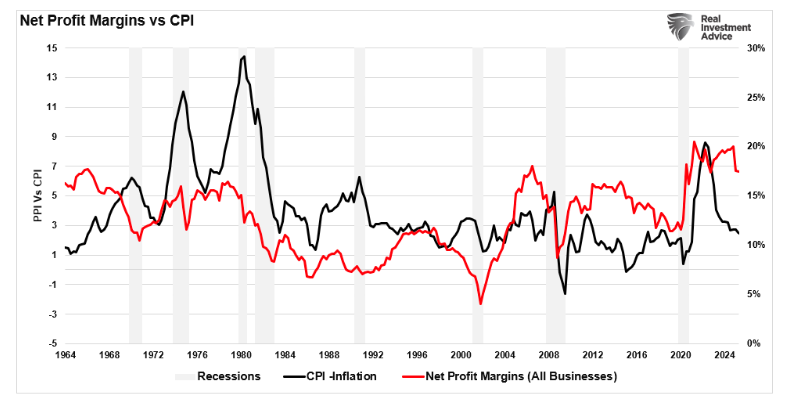
While the “greedflation” narrative resonated with media pundits, corporations struggled with a supply shortage amid a stimulus-driven demand surge. However, that tailwind for profit margins is now gone. As the San Francisco Fed noted, markup fluctuations have not driven U.S. inflation in the post-pandemic disinflation phase. As supply chains healed and demand normalized, the contribution from markups cooled. Inflation’s path has increasingly reflected costs and supply/demand rebalancing rather than persistent profit-push. The nuance matters as it tells you whether margins will keep inflating prices, or mean-revert as costs and demand fluctuate.
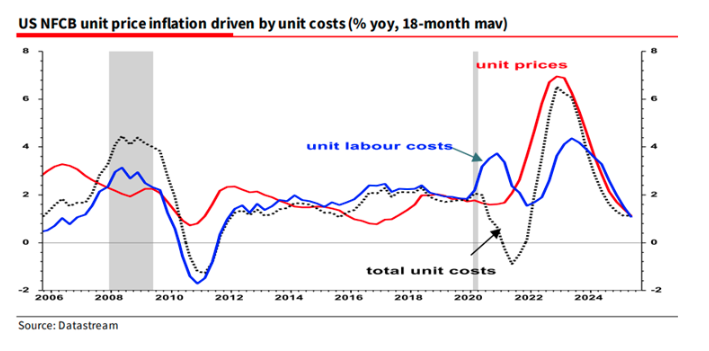
With inflation moderating, but still somewhat sticky in services, maintaining profit margins is becoming more difficult. If the economy slows as demand slows, that difficulty will increase. Crucially, unit labor costs, the most essential recurring input, increased by just 1.0% in Q2. When price growth slows while labor-cost pressures ease, margins can hold up, but only if top-line growth remains decent. That’s the narrow path corporate America is walking today, as shown in a recent analysis by Albert Edwards at Societe Generale.
Let’s pull the macro and micro together. Corporate profit margins are still very elevated versus history. While Q2 earnings did fine, slowing economic growth is a risk. Furthermore, as inflation gravitates toward the Fed’s target range and productivity rebounds, the “easy” boost to margins from price hikes fades. Profits depend more on real demand growth, productivity gains, fiscal impulse, and mix, not just pricing power. That’s consistent with the Kalecki framework. Government “dis-saving” (deficits), household saving behavior, net investment, and trade flows explain the macro profit pool.
If deficits shrink and households retrench, profit margins become harder to defend, no matter how clever the pricing strategy.
Valuations, Sentiment, and Profits
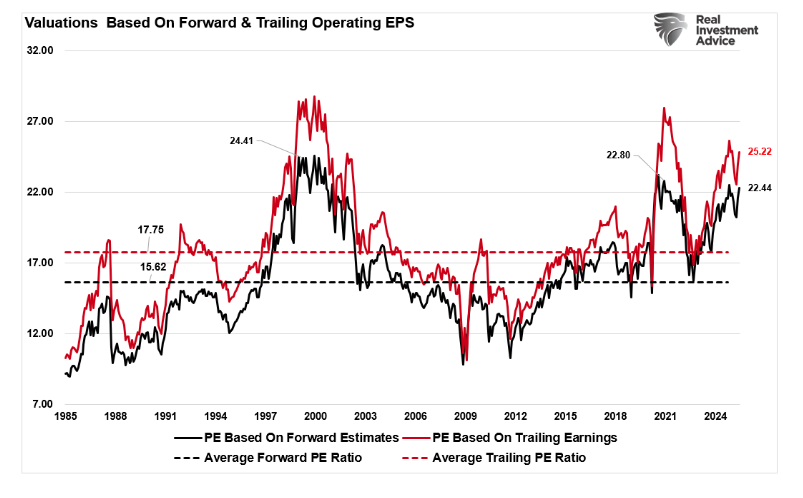
Now to the uncomfortable bit. Valuations and sentiment have been running ahead of the actual improvement in the profit base. As discussed in the “Bull vs Bear Case,” valuations are already elevated. Forward P/E for the S&P 500 sits at 22.5x earnings with trailing earnings at 25x. UBS notes that such readings are among the top 5% since 1985.
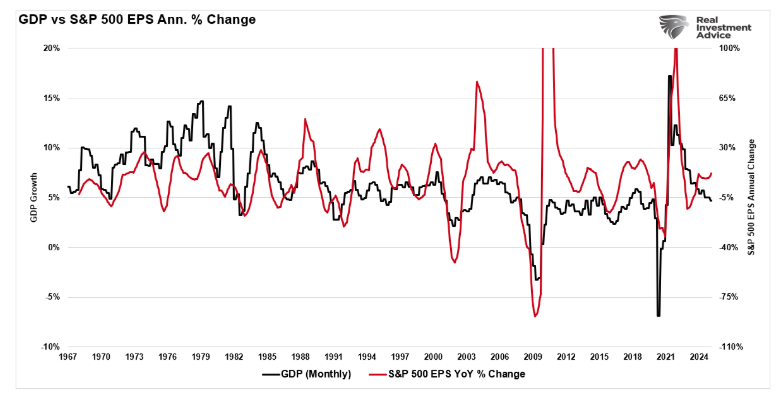
Furthermore, high valuations mean expectations are high and reflect investor sentiment. The risk, of course, is that if earnings disappoint, then forward valuations (expectations) must be recalculated, and currently, the margin for error is slim at best. Notably, given that earnings are derived from actual economic activity, the current gap between the annual change in earnings and GDP is notable. The long historical correlation between the two suggests that a higher risk to investors may be present more than realized.
Sentiment says the same thing. Investor sentiment readings have spent much of Q2 and Q3 above their long-term average, and “greed” metrics have frequently leaned hot, even as breadth narrows to a handful of mega-caps. When optimism, narrow leadership, and premium valuations line up, the market becomes more dependent on flawless execution from profits. Revisions don’t need to be disastrous to cause price air pockets; they only need to be “less great.”
Notably, some of this cycle’s EPS strength is still financial engineering rather than organic profit growth. Corporate buybacks remain enormous, and on pace to exceed $1 trillion in 2025. While they reduce share counts to lift per-share earnings, it also depletes capital that could have been used for more productive purposes. That’s not a moral judgment; it’s simple arithmetic. But it does mean EPS can look stronger than underlying profits, which matters when investors pay a premium multiple for that EPS.
This is why, at RIA, we’ve kept hammering on the detachment theme in 2025. When markets run far ahead of the profits-GDP complex, future returns compress, and the margin for error shrinks. That doesn’t mean an imminent crash, as bulls don’t die of old age, but it does mean risk-adjusted returns deteriorate when price outruns earnings power.
Conclusion: The Investor’s Risk Map From Here
Here are the four take aways for investors from this discussion.
- Profits are fine, not fabulous. The national accounts show profits rising slightly but being revised lower; S&P 500 margins remain high but not accelerating. That constellation is “good enough” for a range-bound market, but fragile if growth cools or if a sector with heavy index weight wobbles.
- The inflation tailwind for margins is fading. Disinflation plus a downshift in unit labor cost growth is constructive for margins, but it also takes away the easy price-pass-through that boosted 2021–22 profitability. From here, real demand and productivity have to carry the baton. Revenue growth will test today’s margins if consumer spending slows, because of resumed student loan payments, tighter credit, or slower job gains.
- Valuation risk is no longer theoretical. With forward P/E north of ~22× and sentiment often leaning greedy, the market is paying for growth, durability, and AI-era productivity gains to materialize broadly. That can work if the profits/GDP engine follows through. But it also means negative EPS revisions, narrower breadth, or even “less great” guidance can trigger outsized drawdowns.
- Financial engineering can’t do all the lifting. Buybacks will keep underpinning EPS, but they don’t expand the economy-wide profit pie. When insiders sell aggressively into repurchase programs, the optics (EPS) can look better than the underlying economics (aggregate profits), especially if the fiscal impulse fades in 2026. That’s a classic setup for multiple compression even without a profit recession.
The economy is growing, profits are okay, but risk is ahead as inflation cools, and labor-cost pressure eases. That mix can support near-term stability, but not complacency. If you’ve benefited from this year’s rally, think in terms of risk-budgeting: where are your exposures most tethered to unchallenged margin assumptions, optimistic revisions, and valuation premia? That’s where small disappointments can have a significant price impact. The playbook that’s worked for us all year remains intact: trim extensions, add on weakness, keep duration and factor exposures diversified, and let the data lead.
In markets, corporate profits write the checks. Make sure your portfolio is aligned with the part of the story that’s actually funding the narrative.
Lance Roberts is a Chief Portfolio Strategist/Economist for RIA Advisors. He is also the host of “The Lance Roberts Podcast” and Chief Editor of the “Real Investment Advice” website and author of “Real Investment Daily” blog and “Real Investment Report“. Follow Lance on Facebook, Twitter, Linked-In and YouTube Customer Relationship Summary (Form CRS)
Join RIA Advisors and elevate your career within a deeply experienced team focused on innovation. Our collaborative environment is built on a foundation of advanced technology and effective investment models, designed to enhance your ability to serve clients and grow your practice. Benefit from a supportive culture that encourages professional development and fosters a forward-thinking approach. By joining our team, you’ll be part of a group dedicated to excellence and continuous improvement, empowering you to focus on building meaningful client relationships and pursuing your business ambitions. Discover the advantages of working with our accomplished advisory team by starting your conversation today.
A message from Advisor Perspectives and VettaFi: Discover something new! Click here to register for our upcoming webcasts.
© Real Investment Advice
Read more commentaries by Real Investment Advice