After decades of increasing global integration, signs of geopolitical and economic fracturing are becoming more visible. The trend arguably began with the U.K.’s decision to leave the European Union (Brexit), occurring around the time global trade peaked as a share of global GDP. More recently, a coalition of BRICS nations, led by China, India, and Russia, has emerged to counterbalance the long-standing U.S. led economic order, while the U.S. itself shows signs of growing economic and foreign policy isolationism.
Despite headline driven uncertainty, we can use hard data to assess the potential of this economic rivalry by examining GDP, trade dynamics, currency dominance, and demographics.
Economic Output and Structural Weaknesses
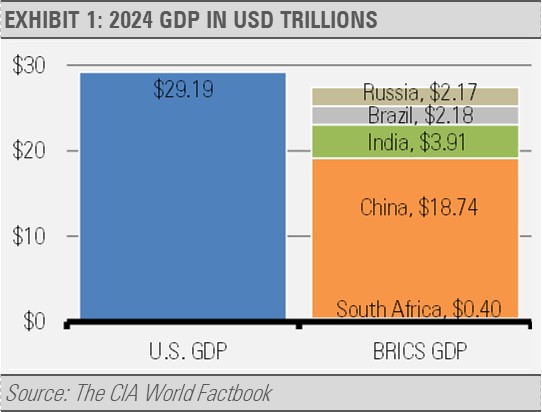
The U.S. remains the largest economy by nominal GDP, reaching an estimated $29 trillion in 2024. The combined nominal GDP of BRICS nations (Brazil, Russia, India, China, and South Africa) is close behind at approximately $27 trillion, though that figure is significantly boosted by China’s contribution.

Yet, GDP totals obscure structural weaknesses. The BRICS economies are heavily export-driven, particularly China, which creates vulnerabilities. China’s economic model relies on vast imports of raw materials to fuel its manufacturing dominance:
- Metals: China is the world’s largest importer of iron ore, copper, aluminum, and nickel to support their industrial and infrastructure needs.
- Energy: It is the largest importer of crude oil globally.
- Agriculture: China imports large quantities of soybeans, corn, wheat, and dairy, which makes it a net food importer.
As global protectionism rises and western economies reduce dependence on Chinese supply chains, Beijing faces increasing pressure to identify new export markets while maintaining reliable import channels for essential commodities. This dual exposure presents long-term risks to China’s growth model.
Currency Dominance: The Dollar vs. De-Dollarization
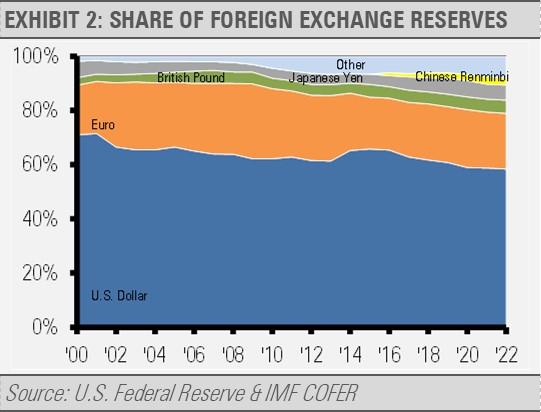
The U.S. dollar remains the world’s dominant reserve and transaction currency (exhibit 2). As of 2022:
- About 58% of global foreign exchange reserves are held in U.S. dollars.
- Over 90% of global foreign exchange trades use the dollar.
- The USD accounts for roughly 50% of global trade invoicing despite the U.S. only comprising 10% of world trade.
Critically, around 80% of U.S. dollar usage in global trade does not involve U.S. residents or firms, which underscores the dollar’s entrenched role as the default global currency. Moreover, a majority of international loans and bonds are still issued in USD, even when neither the borrower nor lender is American.
While BRICS countries, particularly China and Russia, have taken steps to reduce reliance on the dollar (e.g., settling bilateral trade in local currencies), they lack the asset depth, institutional trust, and liquidity to challenge the dollar’s dominance. As Brazil’s central bank has acknowledged, BRICS nations currently do not offer a viable alternative to dollar-denominated financial markets.
Demographic Headwinds in BRICS
One of the starkest challenges facing the BRICS bloc, especially China and Russia, is demographic declines.
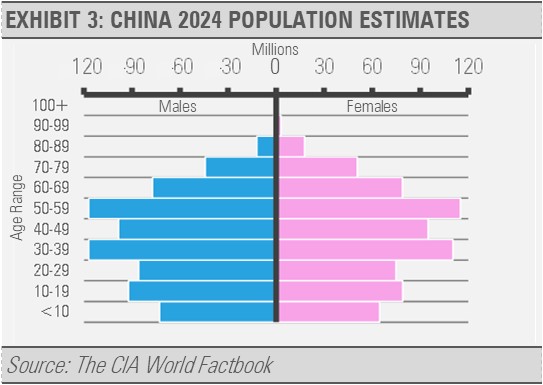
China’s fertility rate has dropped to just 1.3 children per woman, which is far below the 2.1 replacement rate. The working age population is shrinking while the elderly cohort grows rapidly (exhibit 3). By 2030, one in four Chinese citizens is estimated to over the age of 60. Compounding this is a gender imbalance as China has roughly 29 million more males than females, many of whom may never start families. All of this creates a long-term drag on consumption, productivity, and labor force participation.
Additionally, fewer young workers mean rising wages, lower competitiveness in labor-intensive sectors, and greater fiscal pressure to support aging populations.
These dynamics also make it harder for China to pivot from an export-driven economy toward one led by domestic consumption.
Russia faces similar or worse demographic issues, including a declining birthrate and an aging population. Unlike China, reliable data from Russia is harder to obtain, but most outside experts agree that demographic stagnation is a major constraint on future economic growth.
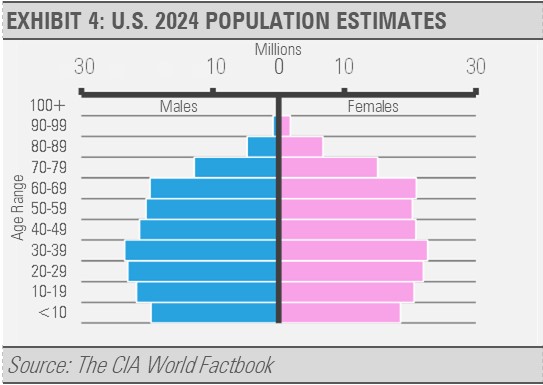
In contrast, the U.S. (exhibit 4) enjoys a relatively healthier demographic profile, supported by immigration and a more stable age distribution that offers a long-term advantage in workforce availability and consumer demand.
Conclusion: An Uneven Contest
The emergence of BRICS as an economic bloc presents a potential challenge to U.S. leadership, but its cohesion is fragile, and its structural disadvantages are significant. The U.S. maintains clear advantages in GDP per capita, innovation, institutional strength, demographic sustainability, and financial system dominance.
That said, the U.S. will need to make substantial investments to reshore manufacturing and reduce strategic dependence on Chinese supply chains, especially if relations deteriorate further.
In the near term, the U.S. appears economically and institutionally stronger than the BRICS coalition, both as a group and certainly compared to any of its members individually. While the global order may shift in complexity, a wholesale rebalancing remains unlikely without major structural reforms in the BRICS economies.
Originally published at Stringer Asset Management
For more news, information, and strategy, visit the ETF Strategist Content Hub.
A message from Advisor Perspectives and VettaFi: Discover something new! Click here to register for our upcoming webcasts.
DISCLOSURES
Any forecasts, figures, opinions or investment techniques and strategies explained are Stringer Asset Management, LLC’s as of the date of publication. They are considered to be accurate at the time of writing, but no warranty of accuracy is given and no liability in respect to error or omission is accepted. They are subject to change without reference or notification. The views contained herein are not to be taken as advice or a recommendation to buy or sell any investment and the material should not be relied upon as containing sufficient information to support an investment decision. It should be noted that the value of investments and the income from them may fluctuate in accordance with market conditions and taxation agreements and investors may not get back the full amount invested.
Past performance and yield may not be a reliable guide to future performance. Current performance may be higher or lower than the performance quoted.
The securities identified and described may not represent all of the securities purchased, sold or recommended for client accounts. The reader should not assume that an investment in the securities identified was or will be profitable.
Data is provided by various sources and prepared by Stringer Asset Management, LLC and has not been verified or audited by an independent accountant.
Read more commentaries by Stringer Asset Management