Key Takeaways
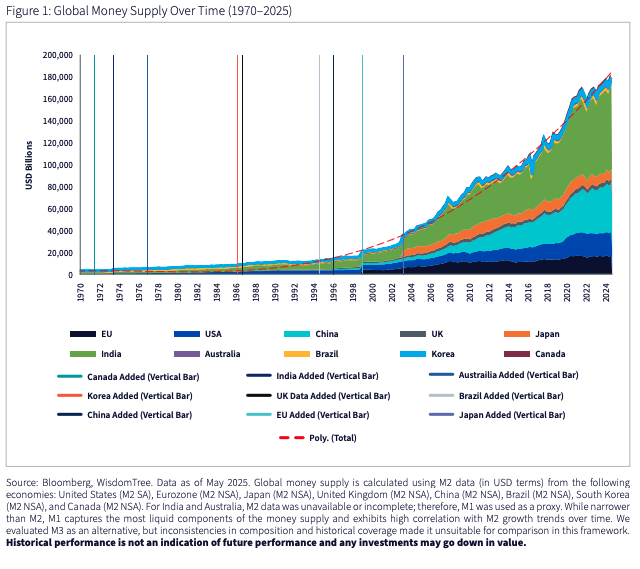
- With global money supply expanding from under $1 trillion in 1970 to over $180 trillion in 2025, hard monetary assets like gold and bitcoin are increasingly viewed as essential hedges against structural monetary debasement.
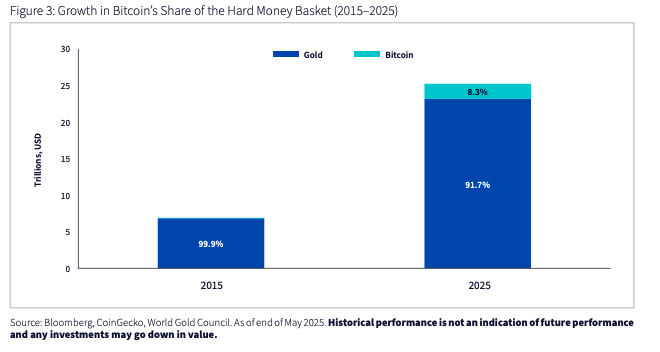
- Bitcoin’s share of the hard money asset pool has surged from less than 0.1% in 2015 to over 8% in 2025, driven by institutional adoption, macro stress, and diminishing trust in traditional financial systems.
- In WisdomTree’s base case scenario, bitcoin reaches $250,000 and gold $4,000 by 2030, with upside potential significantly higher if inflation accelerates and monetary expansion intensifies.
With inflation proving to be sticky, sovereign debt burdens escalating, and trust in institutions coming under scrutiny, investors are reassessing the role that hard assets play in protecting and preserving long-term purchasing power. Gold has historically fulfilled this role, serving as a reserve asset and inflation hedge across centuries. But now, bitcoin—a digitally native, decentralized, and provably scarce asset—is emerging as a credible alternative. This analysis presents a data-driven, scenario-based framework to explore how continued expansion of global money supply could shape the future valuation of ‘hard money’ assets like gold and bitcoin in the years ahead.
HISTORICAL CONTEXT
The historical trajectory of global money supply reveals a pattern of exponential growth. Based on aggregates from the world’s major economies, including the United States, Eurozone, China, Japan, the United Kingdom, Brazil, and India, the total money supply has expanded from less than $1 trillion in 1970 to approximately $180 trillion in 2025. This growth is not linear, but exponential, closely following a power-law curve—a reflection of the world’s ongoing dependence on monetary expansion to support economic growth, manage debt burdens, and fund fiscal deficits.

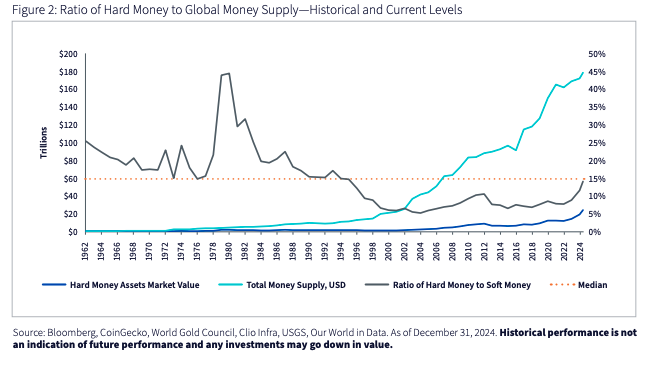
Throughout this period, gold has remained the benchmark hard monetary asset. Its dollar value relative to global money supply has fluctuated based on the macroeconomic regime. During stable or deflationary periods, gold’s value tends to represent a smaller portion of the total monetary base. In contrast, during inflationary or crisisdriven episodes, such as the 1970s, the market reprices gold upward as confidence in bonds and other assets wane. Historical data shows that gold's market capitalization has ranged from 5% to over 40% of global money supply in various market regimes (see Figure 2). The long-term median sits near 15%. As of the end of 2024, when combining gold ($18.2 trillion) with bitcoin ($1.8 trillion), the total hard asset share was approximately 12% of global money—elevated compared to the last few decades, but still within the historical range. In the first half of 2025, both assets reached new all-time highs, and the ratio has increased to levels approaching the historical median.
THE RISE OF BITCOIN AS A ‘HARD MONEY’ ASSET
Bitcoin’s evolution from a fringe experiment into a macro-relevant asset class has been remarkable. In 2015, with a total market capitalization under $5 billion, bitcoin constituted under 0.1% of the total ‘hard money’ basket. At the time, that basket was valued at approximately $6.8 trillion, representing about 7% of global money supply. A decade later, bitcoin’s market cap has grown to over $2 trillion, now making up more than 8% of a hard money basket that has expanded to over $25 trillion in value. As a result, the overall share of hard monetary assets relative to global money supply has nearly doubled, reflecting a growing investor response to structural risks in the traditional financial system.
This shift has been driven by both structural and cyclical forces. The emergence of institutional-grade infrastructure (custodians, prime brokers, and regulated financial products such as exchange-traded funds (ETFs)) has improved access and credibility. At the same time, dwindling trust in institutions and a changing macro landscape have supported bitcoin’s role as an emerging store of value and strengthened its perception as ‘digital gold’. Its relative strength during recent episodes of macro stress, including tariff-driven trade tensions1 , fiscal expansion2 , and bond market volatility3 , has only accelerated this shift. Bitcoin’s decoupling from traditional risk assets, such as tech equities, was evident in early April, when perceived threats to central bank independence sent prices upward4 . Between March 31 and April 21, bitcoin rose 6.0%, gold climbed 9.6%, and the Nasdaq fell 7.6%5 . These dynamics have acted as a litmus test for bitcoin’s investment thesis, highlighting its potential in periods of policy uncertainty. Recent price action and its rising share of hard money signals a broader trend toward its emergence as a credible, asymmetric complement to gold in a world increasingly hedging against currency debasement.
FORECASTING: WHAT CAN WE EXPECT FOR GOLD AND BITCOIN IN THE NEXT 5 YEARS AND BEYOND
The Framework
Our model estimates future market capitalizations and subsequent prices for gold and bitcoin based on the following key inputs
- Forecasted global money supply (in a deflationary, base, and inflationary case).
- The total share of global money supply allocated to ‘hard money’ assets.
- Bitcoin’s share of that ‘hard money’ asset pool.
- Projected supply of gold and bitcoin over time.
A simple formula captures the logic:
Where H is the hard-asset share of money supply M, B is bitcoin’s share of the hard-asset basket, and S is supply. For gold price, just replace B and Sbitcoin with 1-B and Sgold, respectively. For S, supply schedules are transparent for bitcoin and can be estimated for gold with relatively low uncertainty, given the small amount of newly mined gold per year. For M, H, and B, we can use history as a reference to frame out scenarios in alignment with what has occurred in past market regimes. As of 2025, the global money supply across major economies stands at approximately $180 trillion. Combined hard monetary assets, gold and bitcoin, are valued at approximately $25 trillion, equal to about 14% of global money. Of this, bitcoin alone comprises $2.1 trillion, or 8% of the hard-asset pool6 . These values anchor our assumptions across each scenario in our model projections.
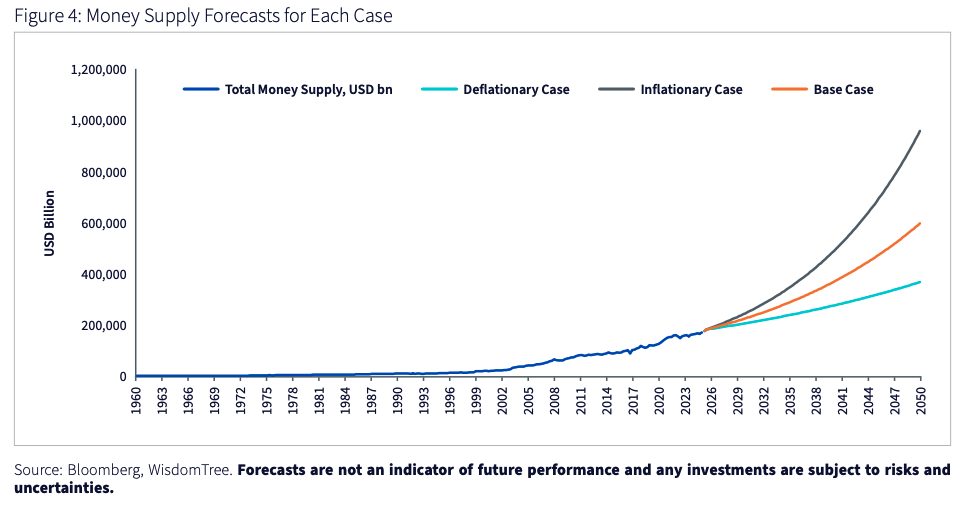
Since 1970, global money supply growth has varied significantly across macroeconomic regimes, with annual rates exceeding 10% during inflationary periods and falling to just above 2% in more stable environments such as the 2010s. These historical ranges form the basis for our forward-looking assumptions. We model three distinct growth trajectories: the Deflationary Case, the Base Case, and the Inflationary Case. Each reflects a plausible macroeconomic path, with corresponding inputs anchored in historical precedent and supported by coherent narratives around inflation, fiscal policy, and investor behavior.
Deflationary Case (3% money supply CAGR7 )
In this scenario, governments and central banks return to a path of fiscal discipline and tighter monetary conditions. Inflation moderates, real interest rates rise, and nominal money growth slows materially. While this path echoes the disinflationary backdrop of the 1990s and early 2000s, we view it as the least probable outcome given the current fiscal starting point.
- Global money supply compounds at 3%, reaching ~$206 trillion by the end of 2030.
- The value of hard money assets declines mildly from current levels to 12% of money supply, consistent with prior low-inflation decades, resulting in a combined market capitalization of bitcoin and gold of ~$20.6 trillion.
- Bitcoin’s share of the hard-asset pool increases from 2025’s 8% level to 10%, a modest continuation of adoption trends.
- Bitcoin follows its forecasted supply schedule and remains capped, while gold continues to be mined, growing supply at 1.5 % annually with a decay factor of 0.958 (this holds for each scenario).
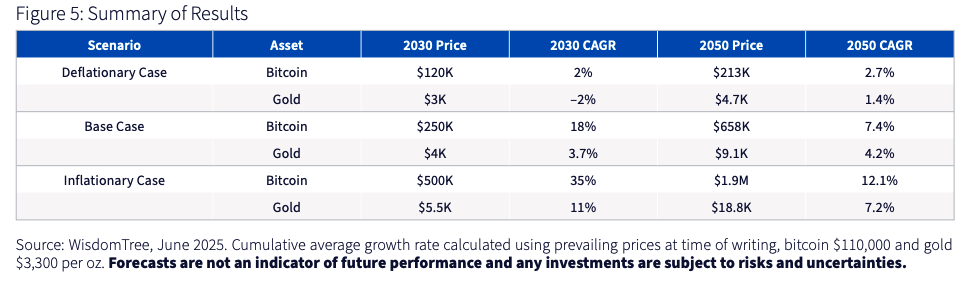
- In the deflationary case, we estimate a 2030-year end bitcoin price of ~$120,000, reflecting a ~2 % compound annual growth rate from the current 2025 price levels of ~$110,000. Gold is projected to reach $3,000 per ounce, retreating from current price levels of ~$3,300 by 2% per year. By 2050, bitcoin rises to approximately $213,000 (a 2.7% CAGR), while gold increases to $4,700 per ounce (a 1.4% CAGR). This scenario serves as a useful lower-bound anchor for valuation. Even in an environment of monetary restraint and reduced inflation, bitcoin and gold’s stable supply still supports long-term value preservation.
Base Case (5% money supply CAGR)
Our central scenario assumes a continuation of prevailing dynamics: mild but persistent inflation around central bank targets, moderate real GDP9 growth, and a steady expansion of global liquidity. This path closely tracks the historical average global money supply growth of the past 50 years.
- Global money supply reaches ~$230 trillion by the end of 2030.
- The relative value of hard money assets to money supply rises to 15%, which is both the historical median and a modest increase from current levels, expanding combined market capitalization of gold and bitcoin to ~$35 trillion.
- Bitcoin’s share of the ‘hard money’ basket rises to 15%, as adoption continues to accelerate on the back of institutionalization of the asset class.
- Supply remains constrained on both assets as described in the deflationary case
Under these assumptions, bitcoin is projected to reach $250,000 by year end 2030, delivering an 18% annualized return from current price levels. Gold rises to approximately $4,000 per ounce, equating to a 3.7 % CAGR over the same period. By 2050, bitcoin advances to over $650,000 (a 7.4 % CAGR), while gold reaches over $9,000 per ounce, appreciating over 4% annually.
This scenario reflects a continuation of current macro conditions: moderate inflation, modest real growth, and persistent monetary expansion. As liquidity increases, investors gradually reallocate to scarce monetary alternatives. Bitcoin continues to gain share alongside gold, which remains an anchor asset without being displaced.
Inflationary Case (7% money supply CAGR)
The high-end scenario reflects accelerating monetary expansion amid unresolved fiscal stress, rising debt burdens, and the political appeal of inflation as a hidden tax on debt. In this regime, investor demand for non-sovereign stores of value rises as investor confidence erodes.
- Global money supply expands to over $260 trillion by the end of 2030.
- The relative value of hard money assets to money supply climbs to 20%, elevated but still well below historical peaks over 30% seen during the 1970s inflation shock.
- Combined market value for hard money assets, gold and bitcoin, reaches $50 trillion.
- Bitcoin captures 20% of this value, reflecting the momentum of institutional adoption and increasing skepticism of traditional, centralized monetary systems.
- Supply remains constrained on both assets as described in the deflationary case.
In this scenario, where inflation reaccelerates and trust deteriorates, bitcoin is forecast to reach over $500,000 by 2030, delivering a 35% CAGR. Gold also sees meaningful appreciation, rising to over $5,500 per ounce, an 11% annualized return from current levels. Holding our assumptions out to 2050, bitcoin and gold approach $2 million per coin and $19,000 per ounce, respectively. These outcomes are consistent with investor behaviour during periods of monetary debasement. With bitcoin’s supply hard-capped, even modest increases in allocation during inflationary stress can produce disproportionate price impacts. Gold, meanwhile, reasserts its role as a central reserve asset amid rising demand for inflation protection.
CONCLUSION
This analysis frames bitcoin and gold as complementary hard monetary assets positioned to benefit from continued monetary expansion. If money supply grows in line with historical trends and investors reallocate toward scarce stores of value, both assets are poised for meaningful upside. In our base case, bitcoin reaches $250,000 and gold rises to $4000 within the next 5 years. Under more inflationary conditions, valuations could exceed $500,000 for bitcoin and $5000 per ounce for gold. With tightly constrained supply and increasing demand for monetary resilience, both assets offer differentiated roles in a diversified hard monetary asset allocation. In a structurally inflationary world, astute investors own both.
APPENDIX
All monetary data are drawn from Bloomberg economics indices. Every national M2 figure is converted into nominal US dollars. The seven blocs we track—the United States, the Euro Area, China, Japan, the United Kingdom, India, and Brazil—account for more than 85% of the world’s recorded M210. Including the remainder of the world would enlarge the level data by less than 5% and would not change the exponential growth profile. Although each country defines M2 differently, and in the case of India and Australia we actually use M1 due to data limitations, definitional quirks do not alter the long-run log-growth trend, which is the relevant measure for this framework
1Trump Tariffs on China Actually 145%, Says White House.” The Wall Street Journal, April 10, 2025.
2Rubin, Gabriel T. “Trump’s Tax Plan Would Push U.S. Debt to 122% of GDP, Budget Watchdog Says.” The Wall Street Journal, June 25, 2025.
3“Who Are the Bond Vigilantes?” Bloomberg News.
4Solimano, Pedro. “Why Bitcoin ‘Decoupling’ from Stocks Is a Big Deal in Crypto.” DL News, 22 Apr. 2025.
5Bloomberg, measured using XBTUSD for bitcoin return in USD, XAUUSD for gold return in USD, and NDX Index for USD return of the Nasdaq Index.
6 As of June 2025.
7 CAGR = compound annual growth rate.
8 Each year, the mining growth rate is multiplied by 0.95, and therefore the growth rate decays by 5%. Historically, gold has been mined at a rate between 0.5% and 1.5% of supply. Current levels are closer to the latter rate, but World Gold Council estimates depleting below ground supply that aligns with reduced mining production in the years to come.
9 GDP = gross domestic product.
10 M2 is a broad measure of money supply that includes M1 (cash, checking account deposits) plus savings accounts, money market funds, and small-time deposits. It represents a wider range of liquid assets and is often used by economists and central banks to monitor the overall health of an economy.
A message from Advisor Perspectives and VettaFi: To learn more about this and other topics, check out some of our webcasts.
IMPORTANT INFORMATION
There are risks associated with investing, including the possible loss of principal. Past performance is not indicative of future results.
Bitcoin is highly speculative and involves a high degree of risk, including the potential for loss of the entire investment. An investment in bitcoin involves significant risks (including the potential for quick, large losses) and may not be suitable for all investors.
The price of gold does not fluctuate and may be affected by numerous factors including supply and demand, the global financial markets and other political, financial, or economic events, which may negatively impact gold prices.
This material contains the opinions of the authors, which are subject to change, and should not be considered or interpreted as a recommendation to participate in any particular trading strategy or deemed to be an offer or sale of any investment product, and it should not be relied on as such. There is no guarantee that any strategies discussed will work under all market conditions. This material represents an assessment of the market environment at a specific time and is not intended to be a forecast of future events or a guarantee of future results. This material should not be relied upon as research or investment advice regarding any security in particular. The user of this information assumes the entire risk of any use made of the information provided herein. Unless expressly stated otherwise, the opinions, interpretations or findings expressed herein do not necessarily represent the views of WisdomTree or any of its affiliates.
WisdomTree Funds are distributed by Foreside Fund Services, LLC.
© WisdomTree, Inc.
Read more commentaries by WisdomTree, Inc.