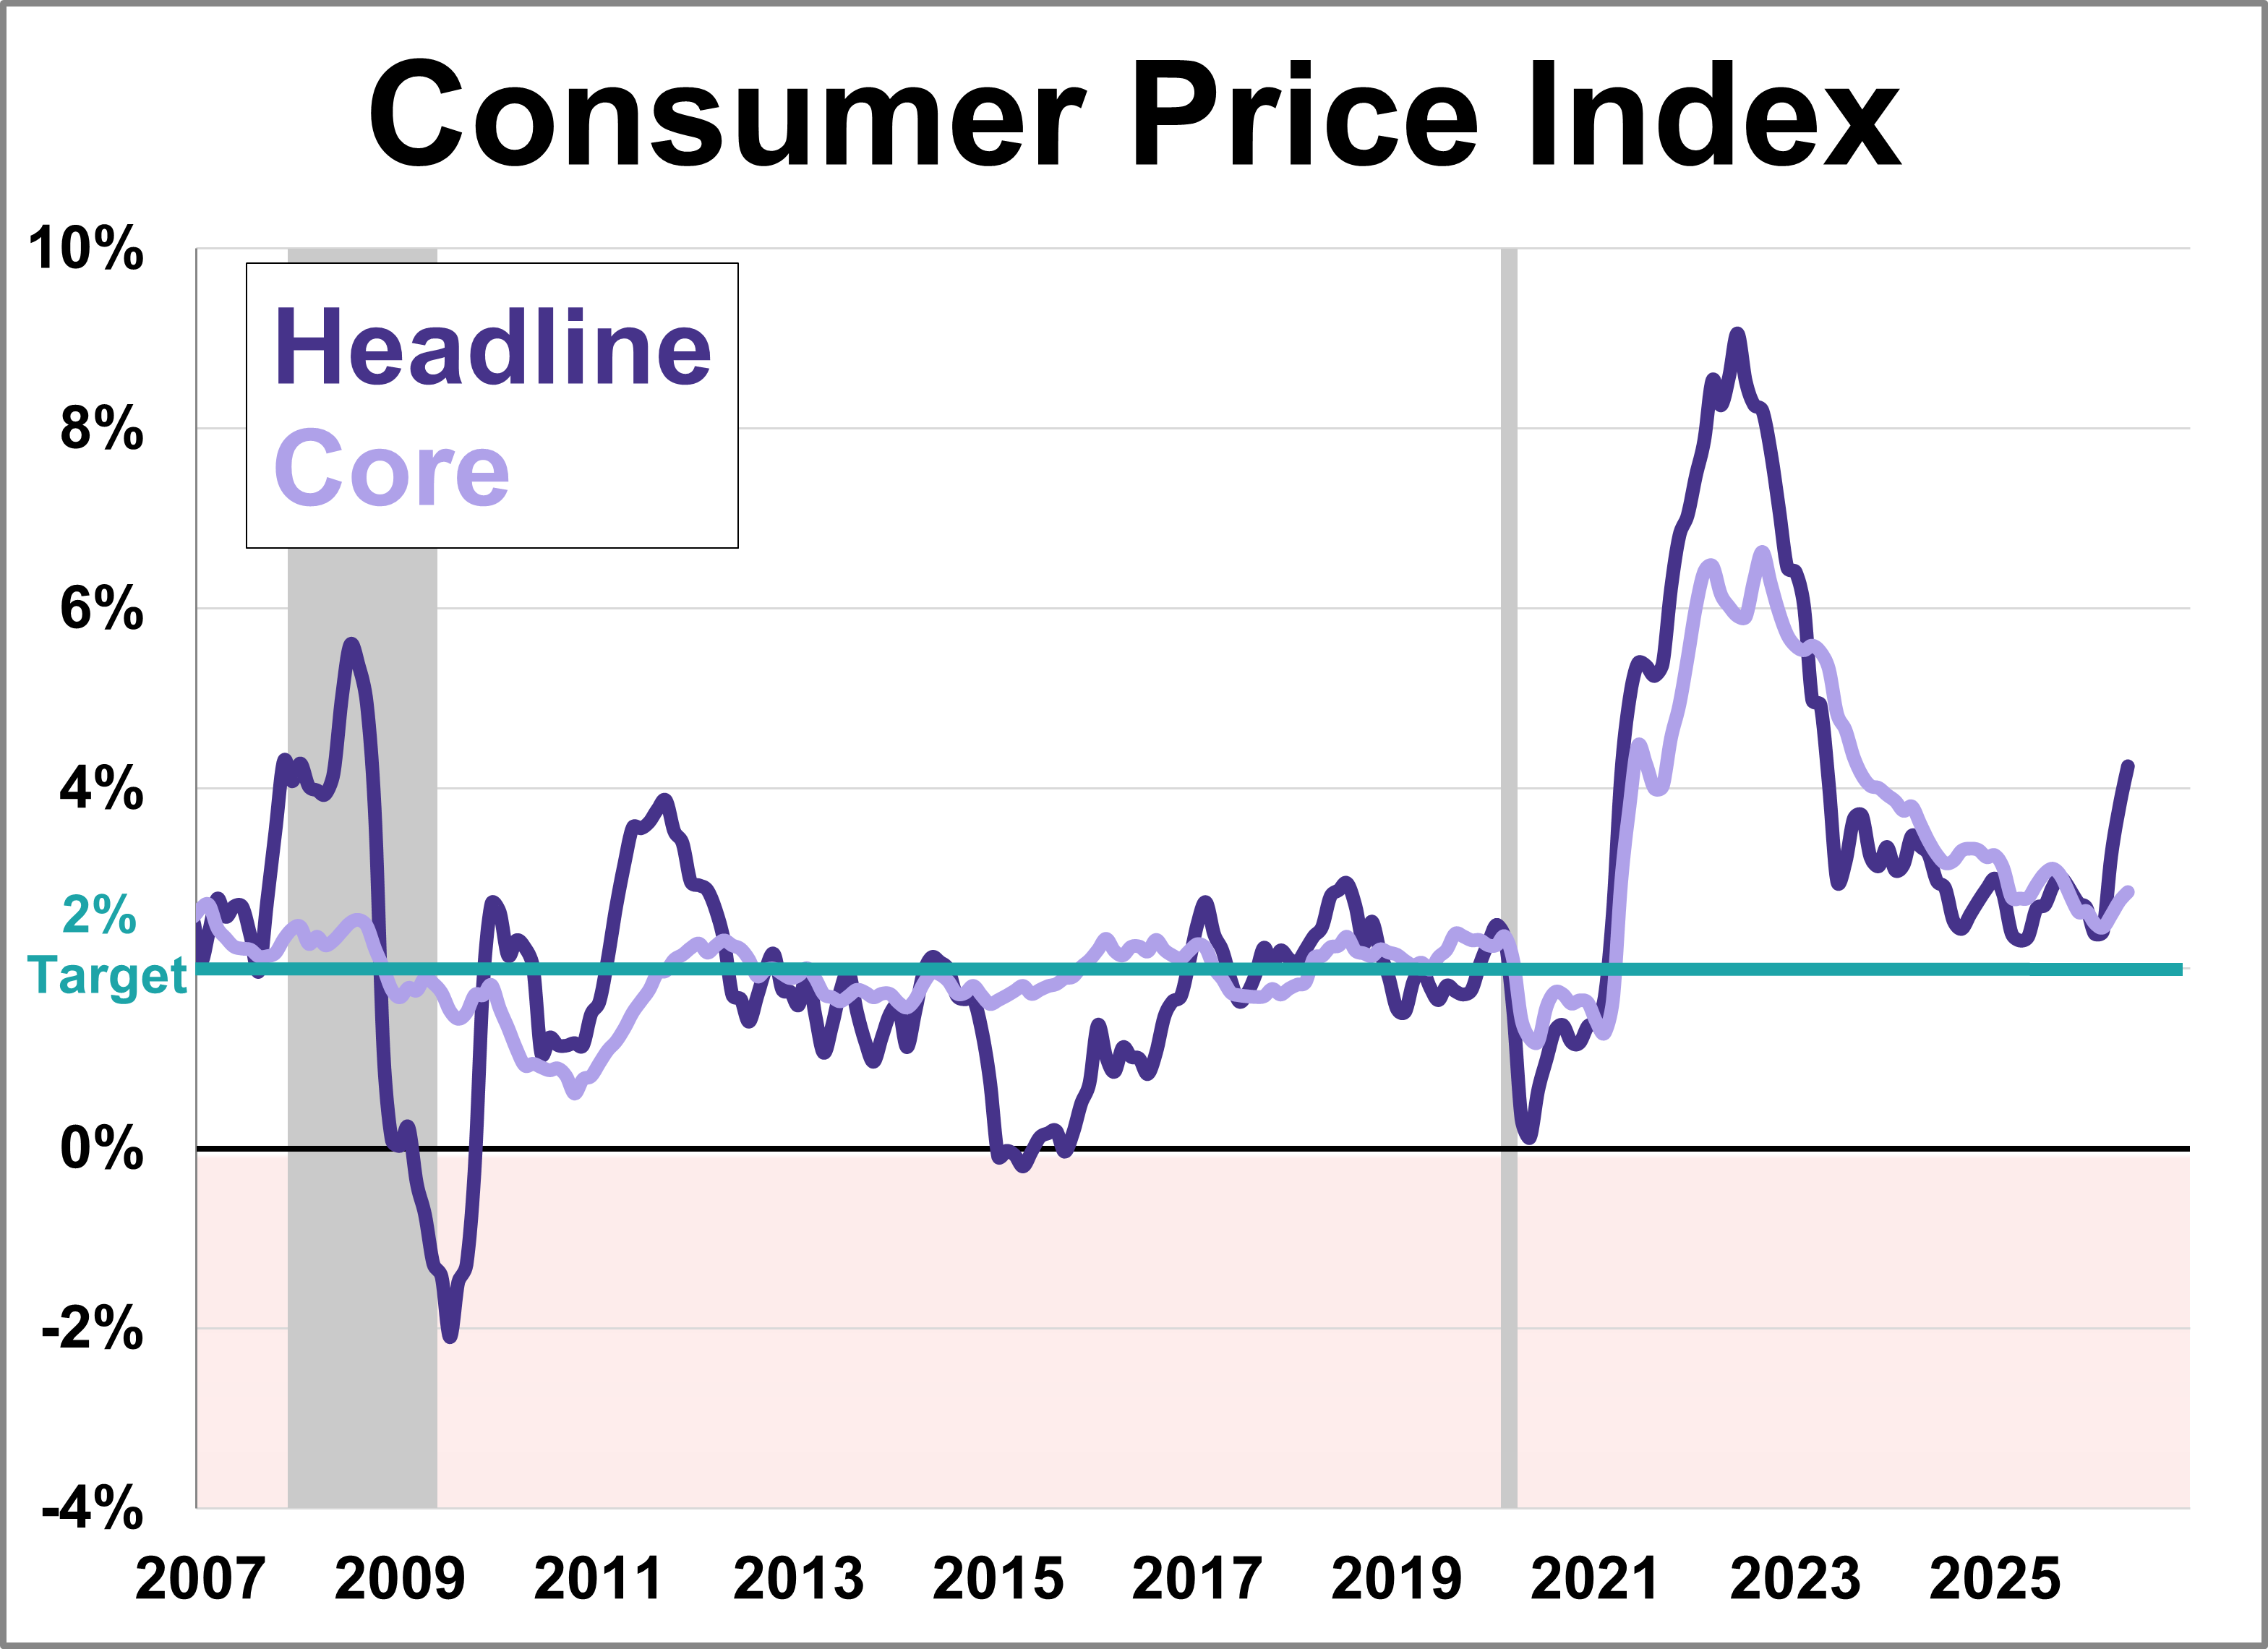
Inflation surged to 4.2% year-over-year in May, hitting its highest level in over three years. The headline figure for the Consumer Price Index (CPI) was consistent with the forecast, driven primarily by cost increases in energy, shelter, and food.
Several articles enjoyed strong performance during the month of May, though there does not seem to have been a unifying theme, unless it is pointing out mistaken beliefs or unexamined conventions.
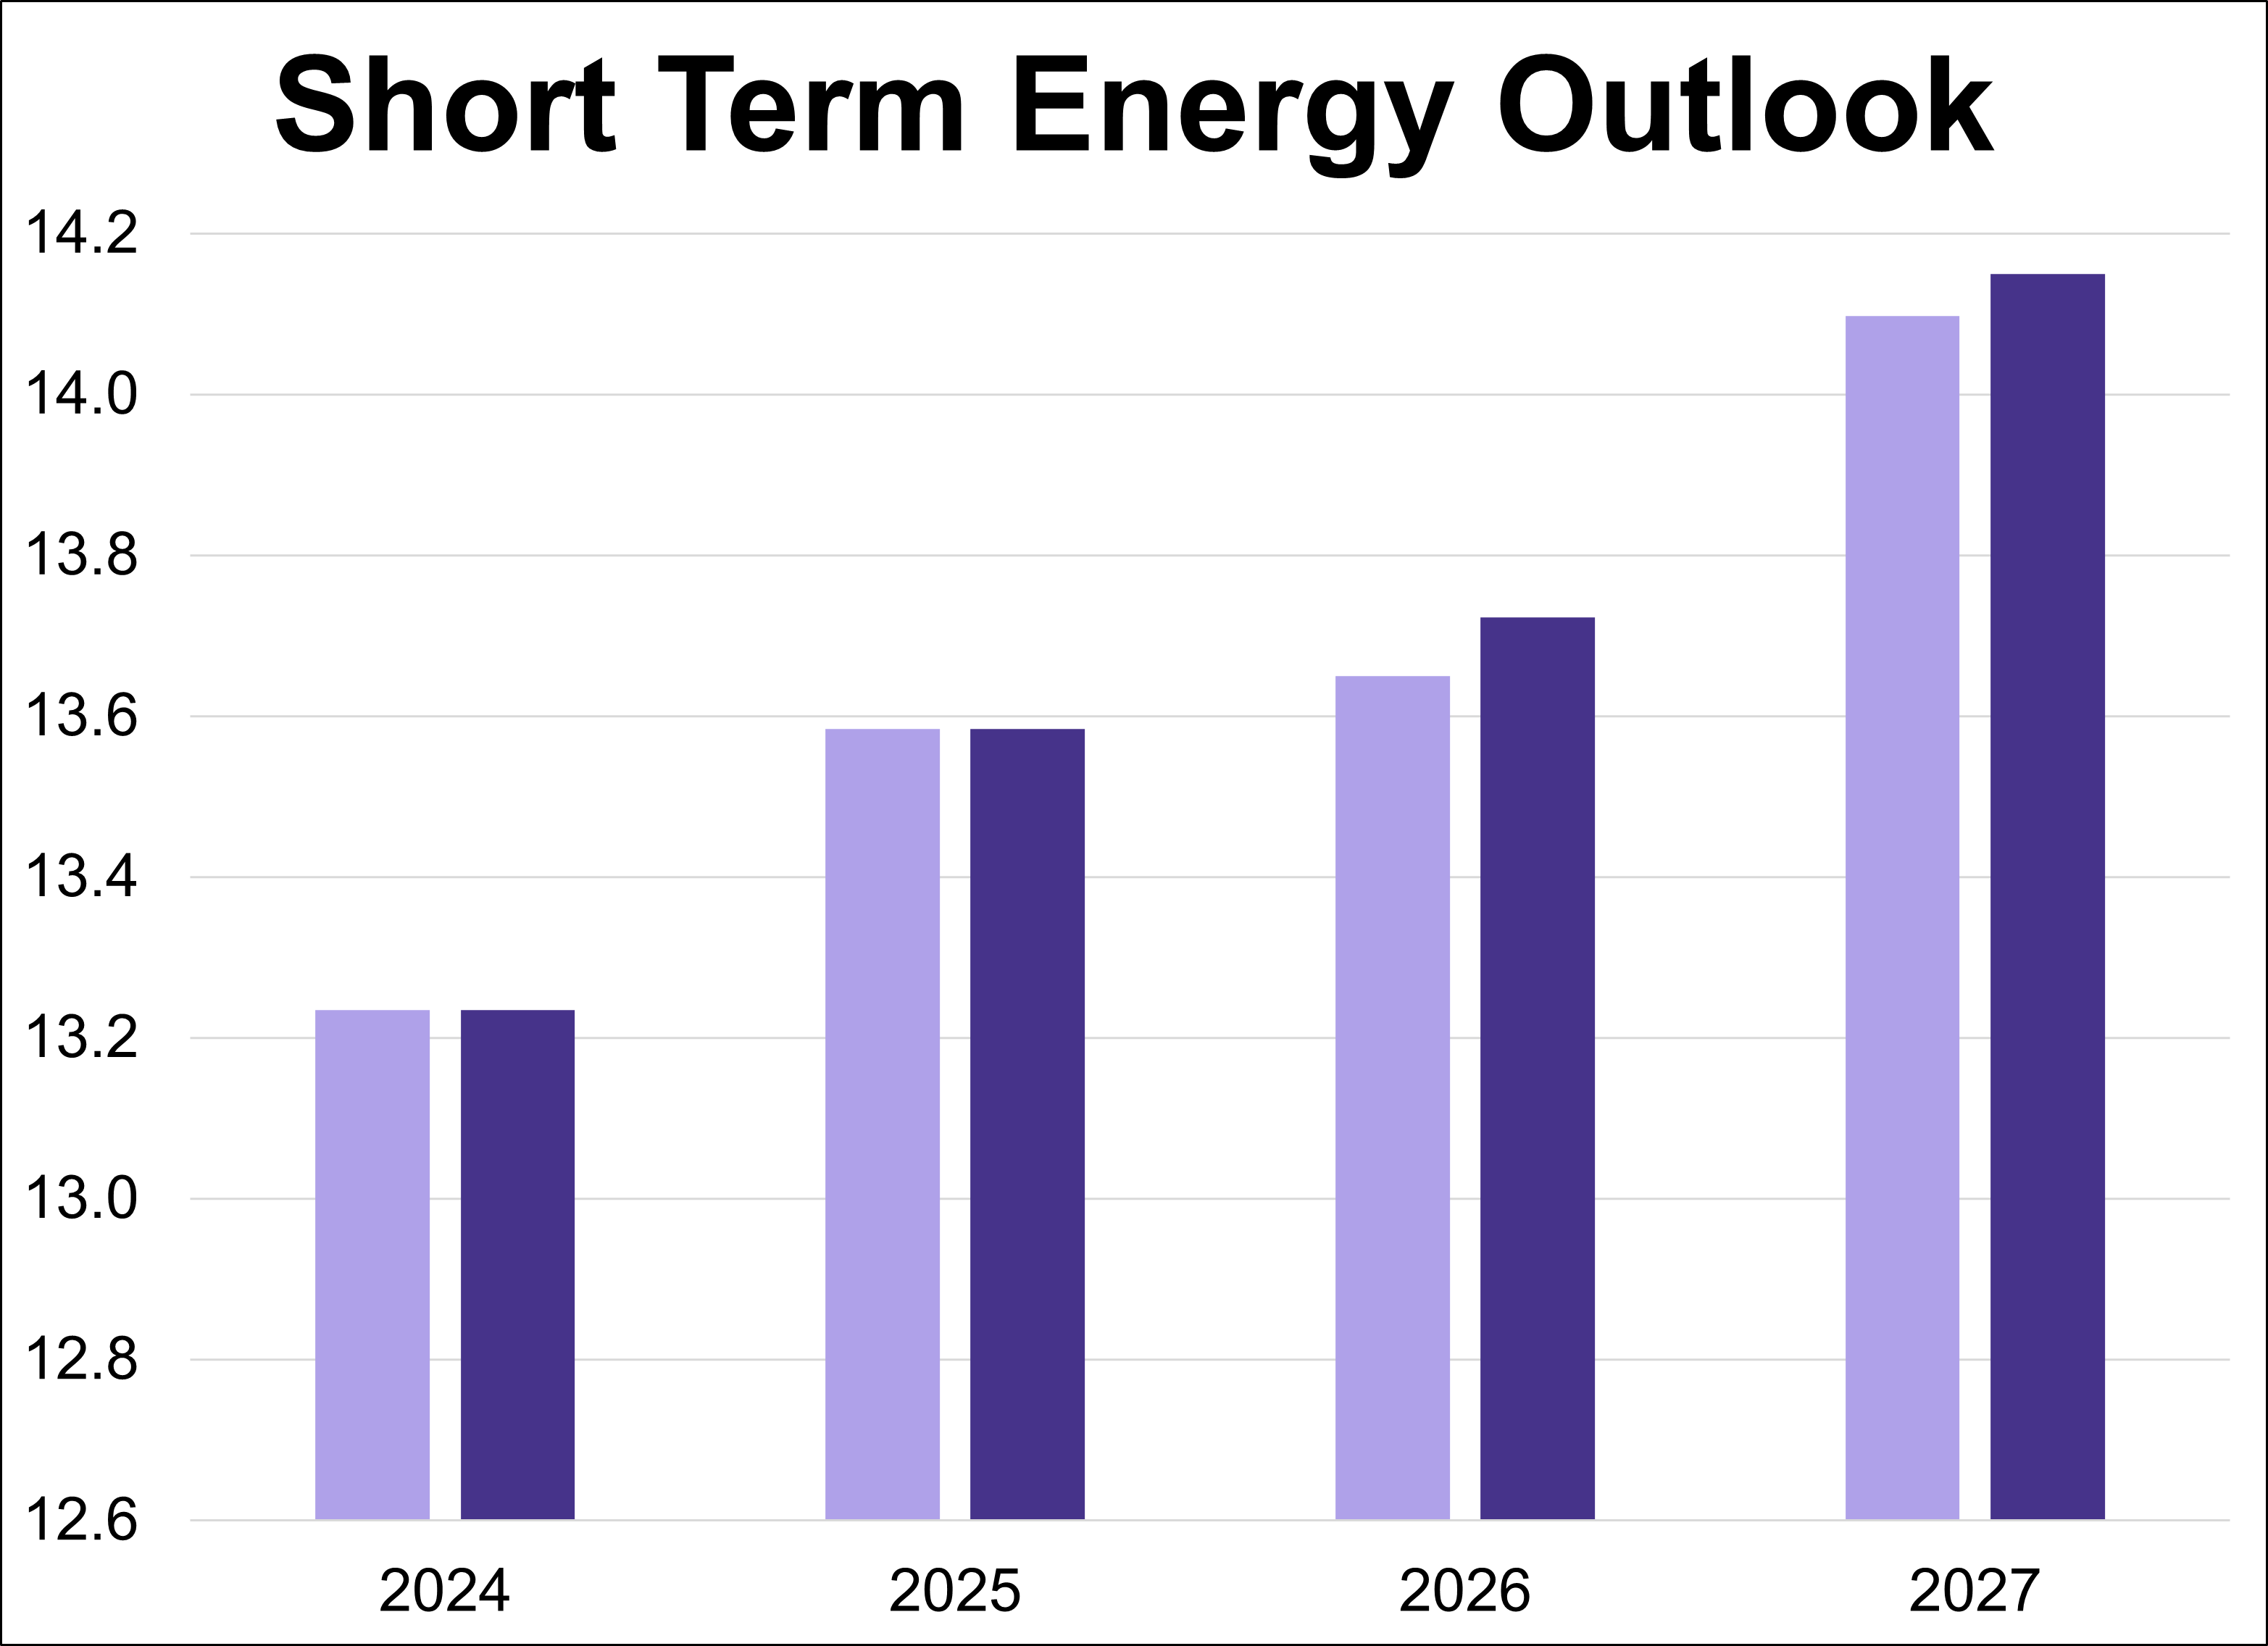
The U.S. Energy Information Administration (EIA) has released its latest Short-Term Energy Outlook (STEO), providing forecasts for energy markets. This article presents the annual production outlooks for crude oil, natural gas, and natural gas liquids (NGLs), comparing the June 2026 projections against the previous month's estimates.
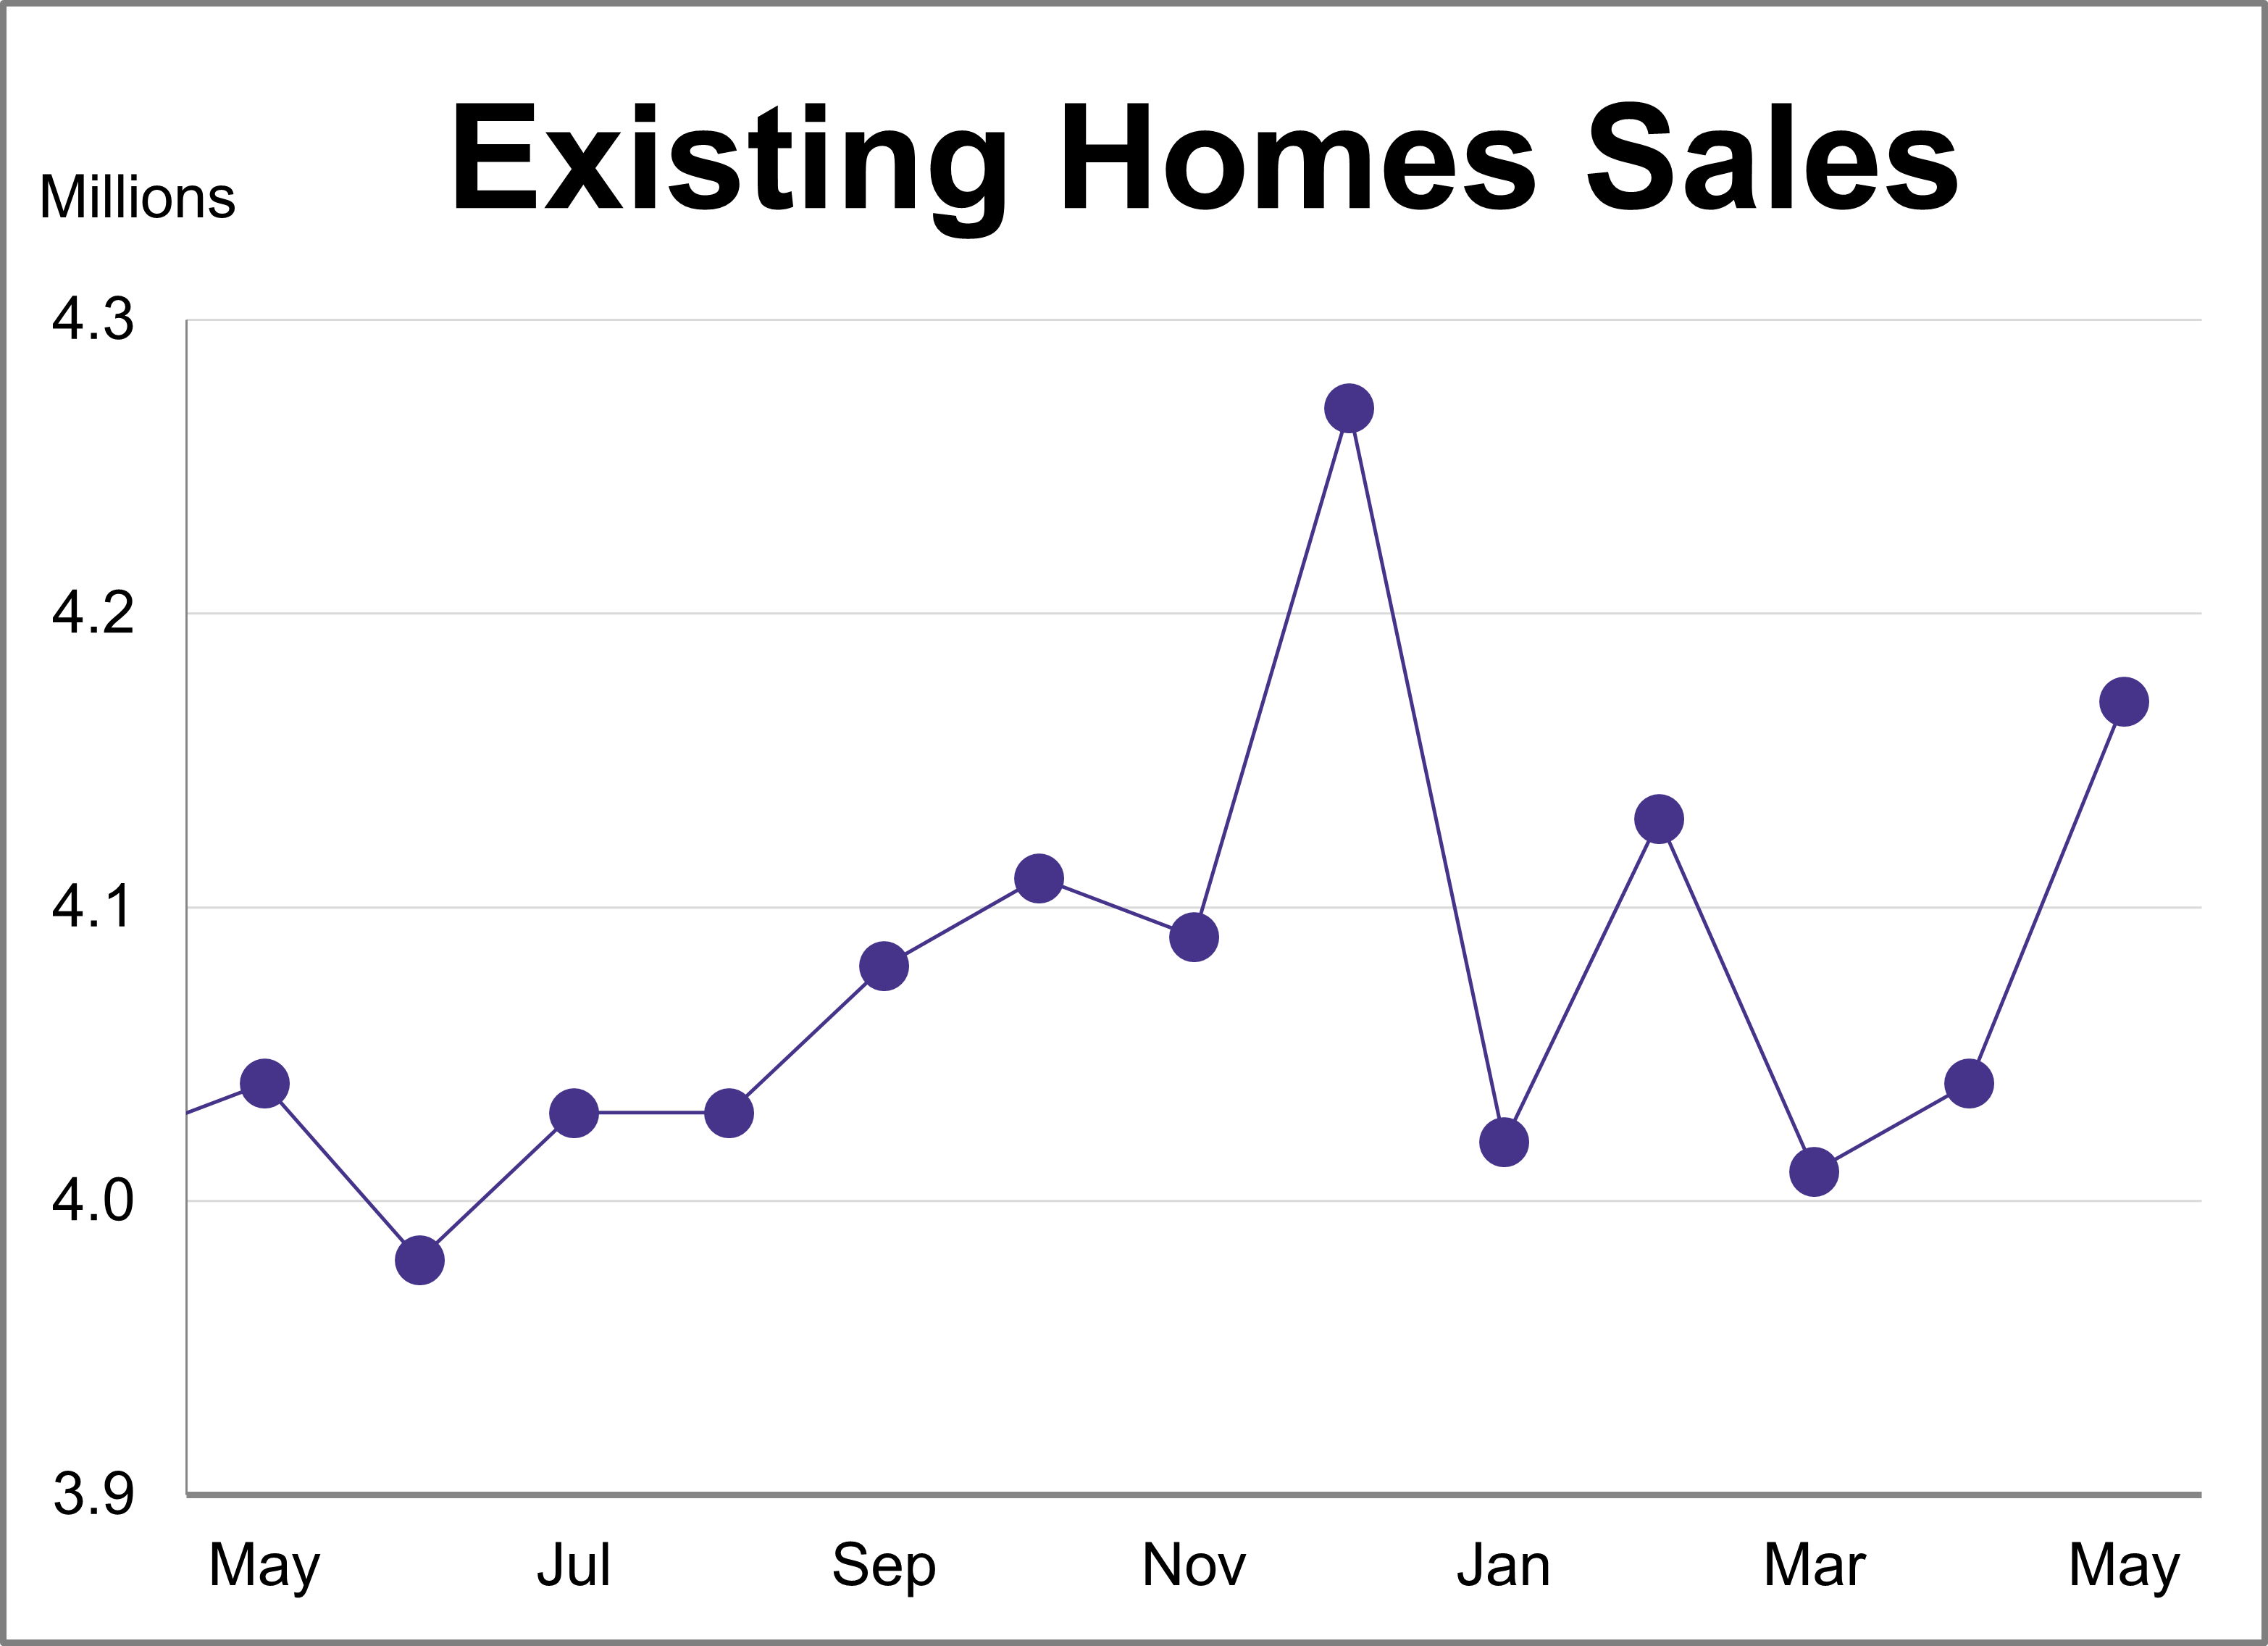
Existing home sales reached their highest level of the year in May, rising 3.2% after a 0.7% increase in April. According to the National Association of Realtors (NAR), sales reached a seasonally adjusted annual rate of 4.17 million units, surpassing the projected 4.07 million.
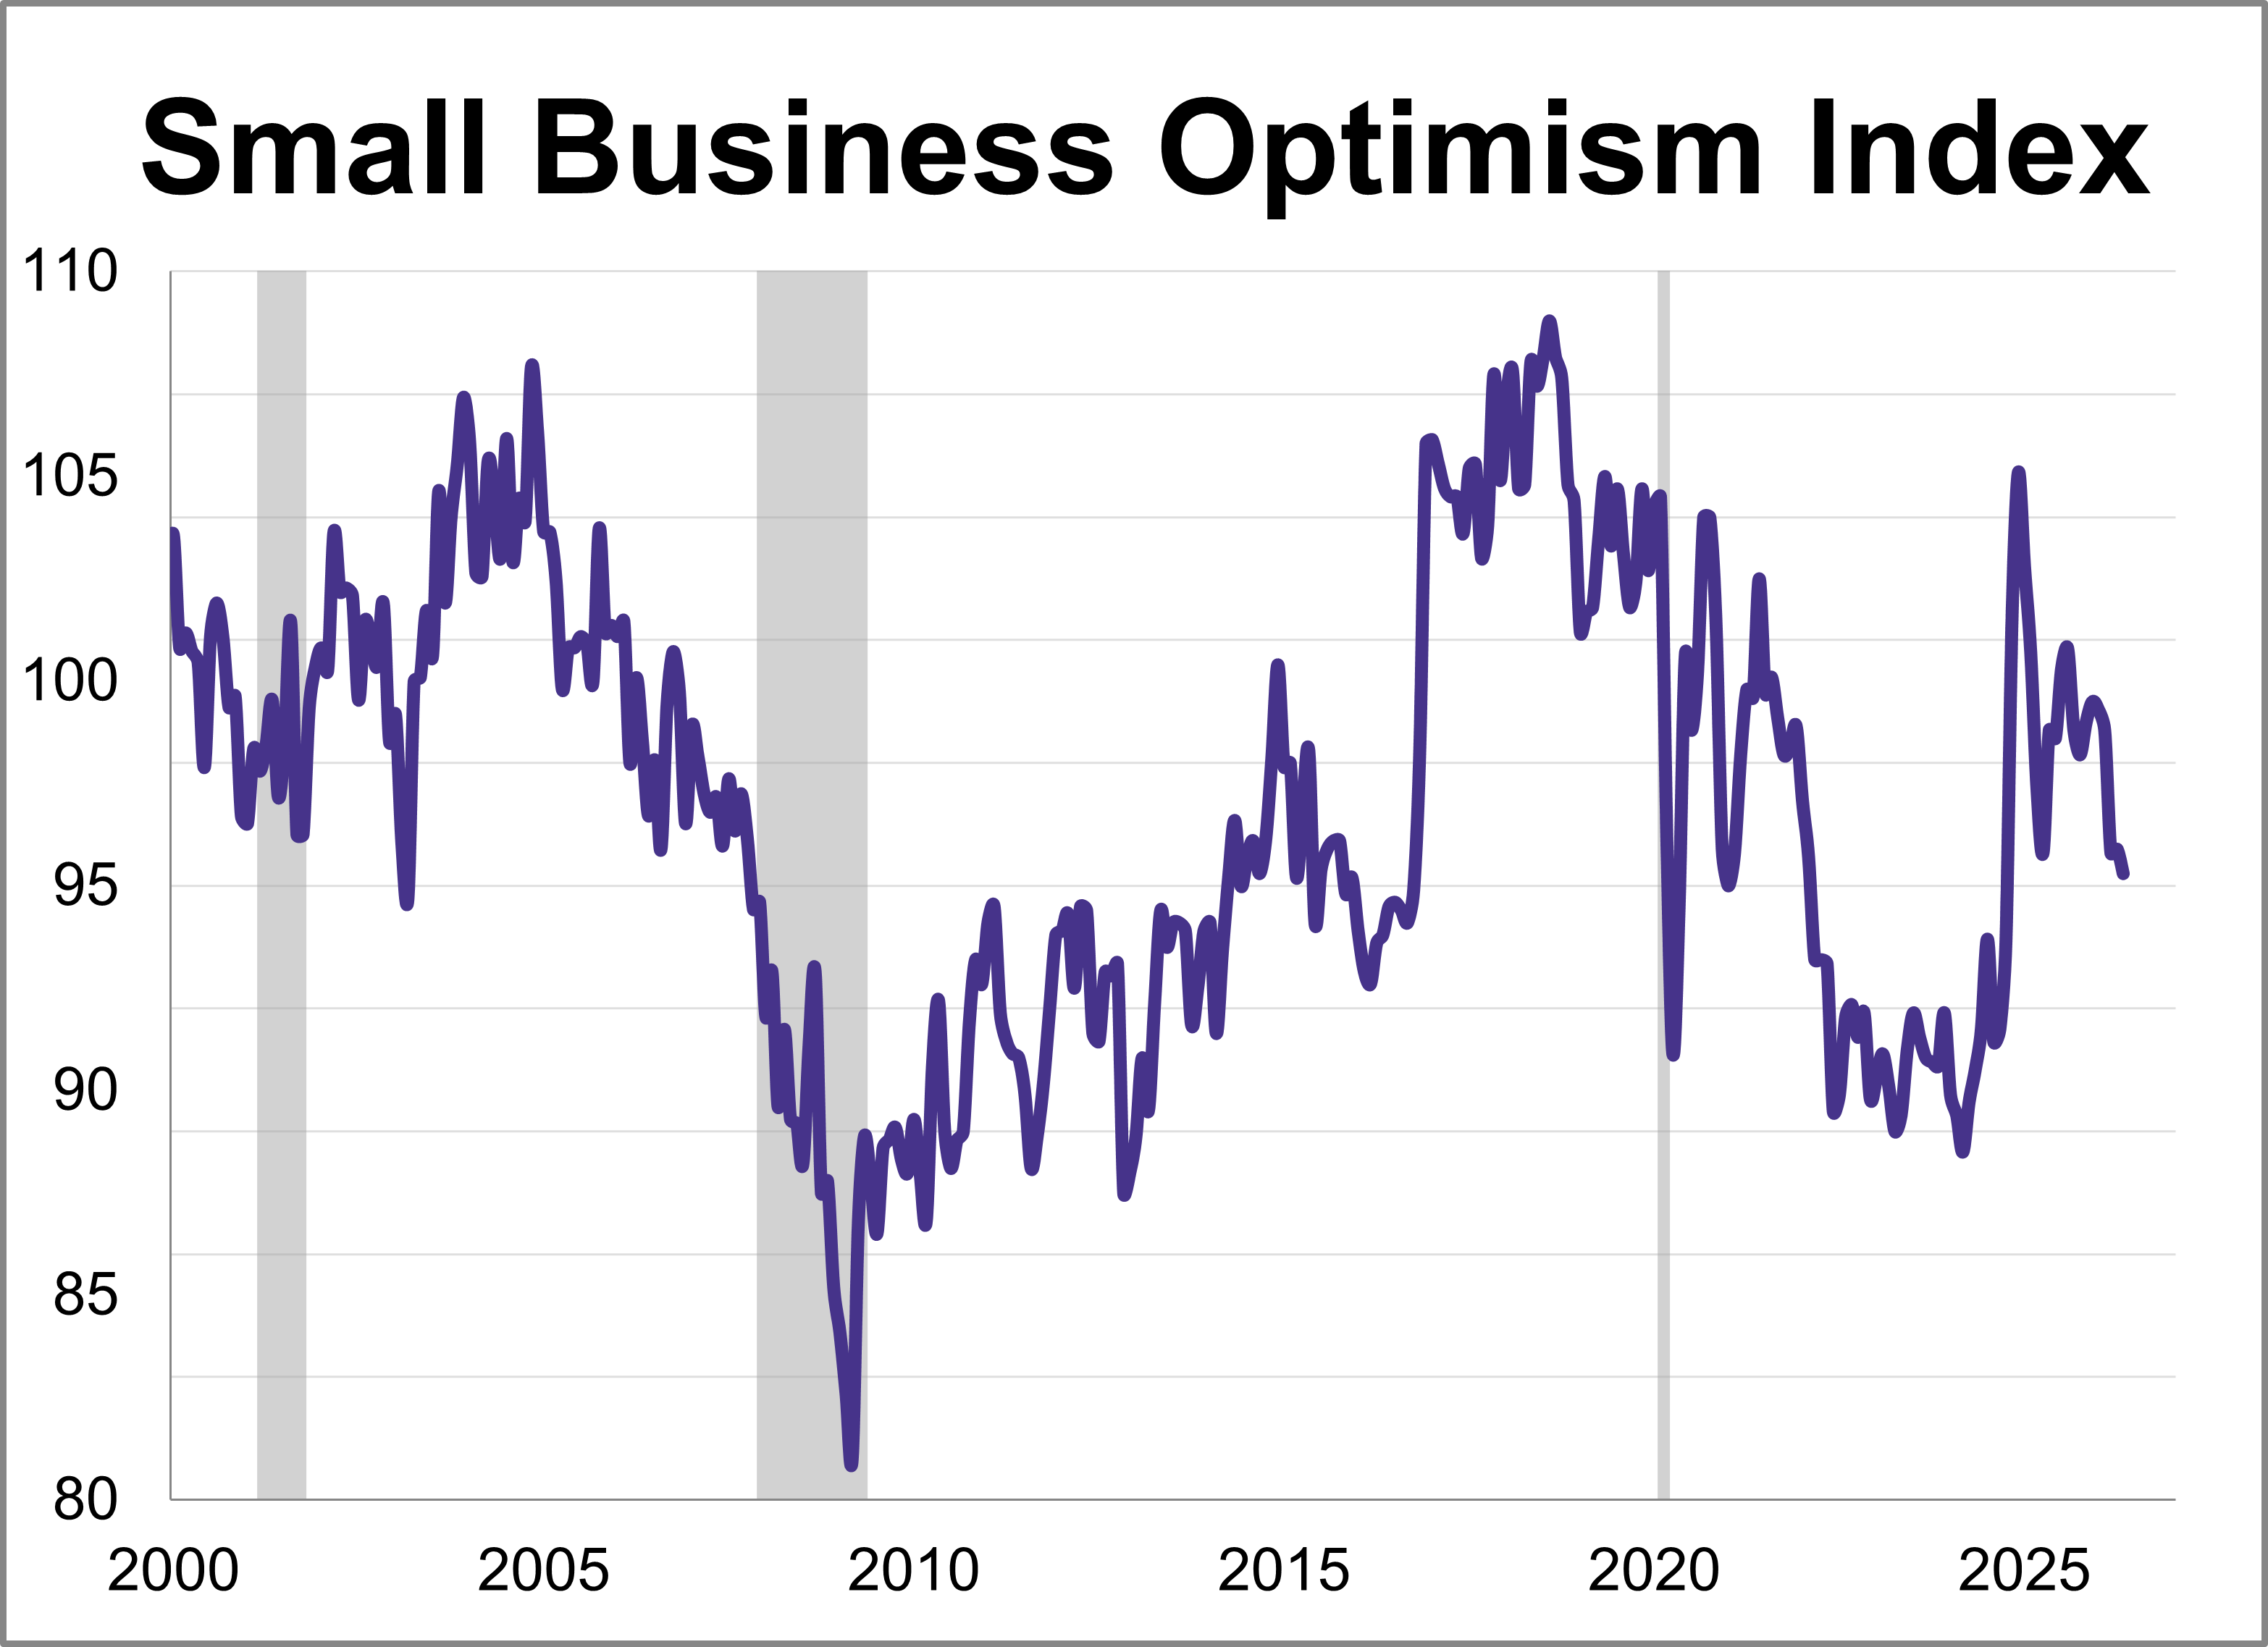
The NFIB Small Business Optimism Index dropped 0.6 points to 95.3, reaching its lowest level since October 2024. The index remains below its historical average for a third straight month.
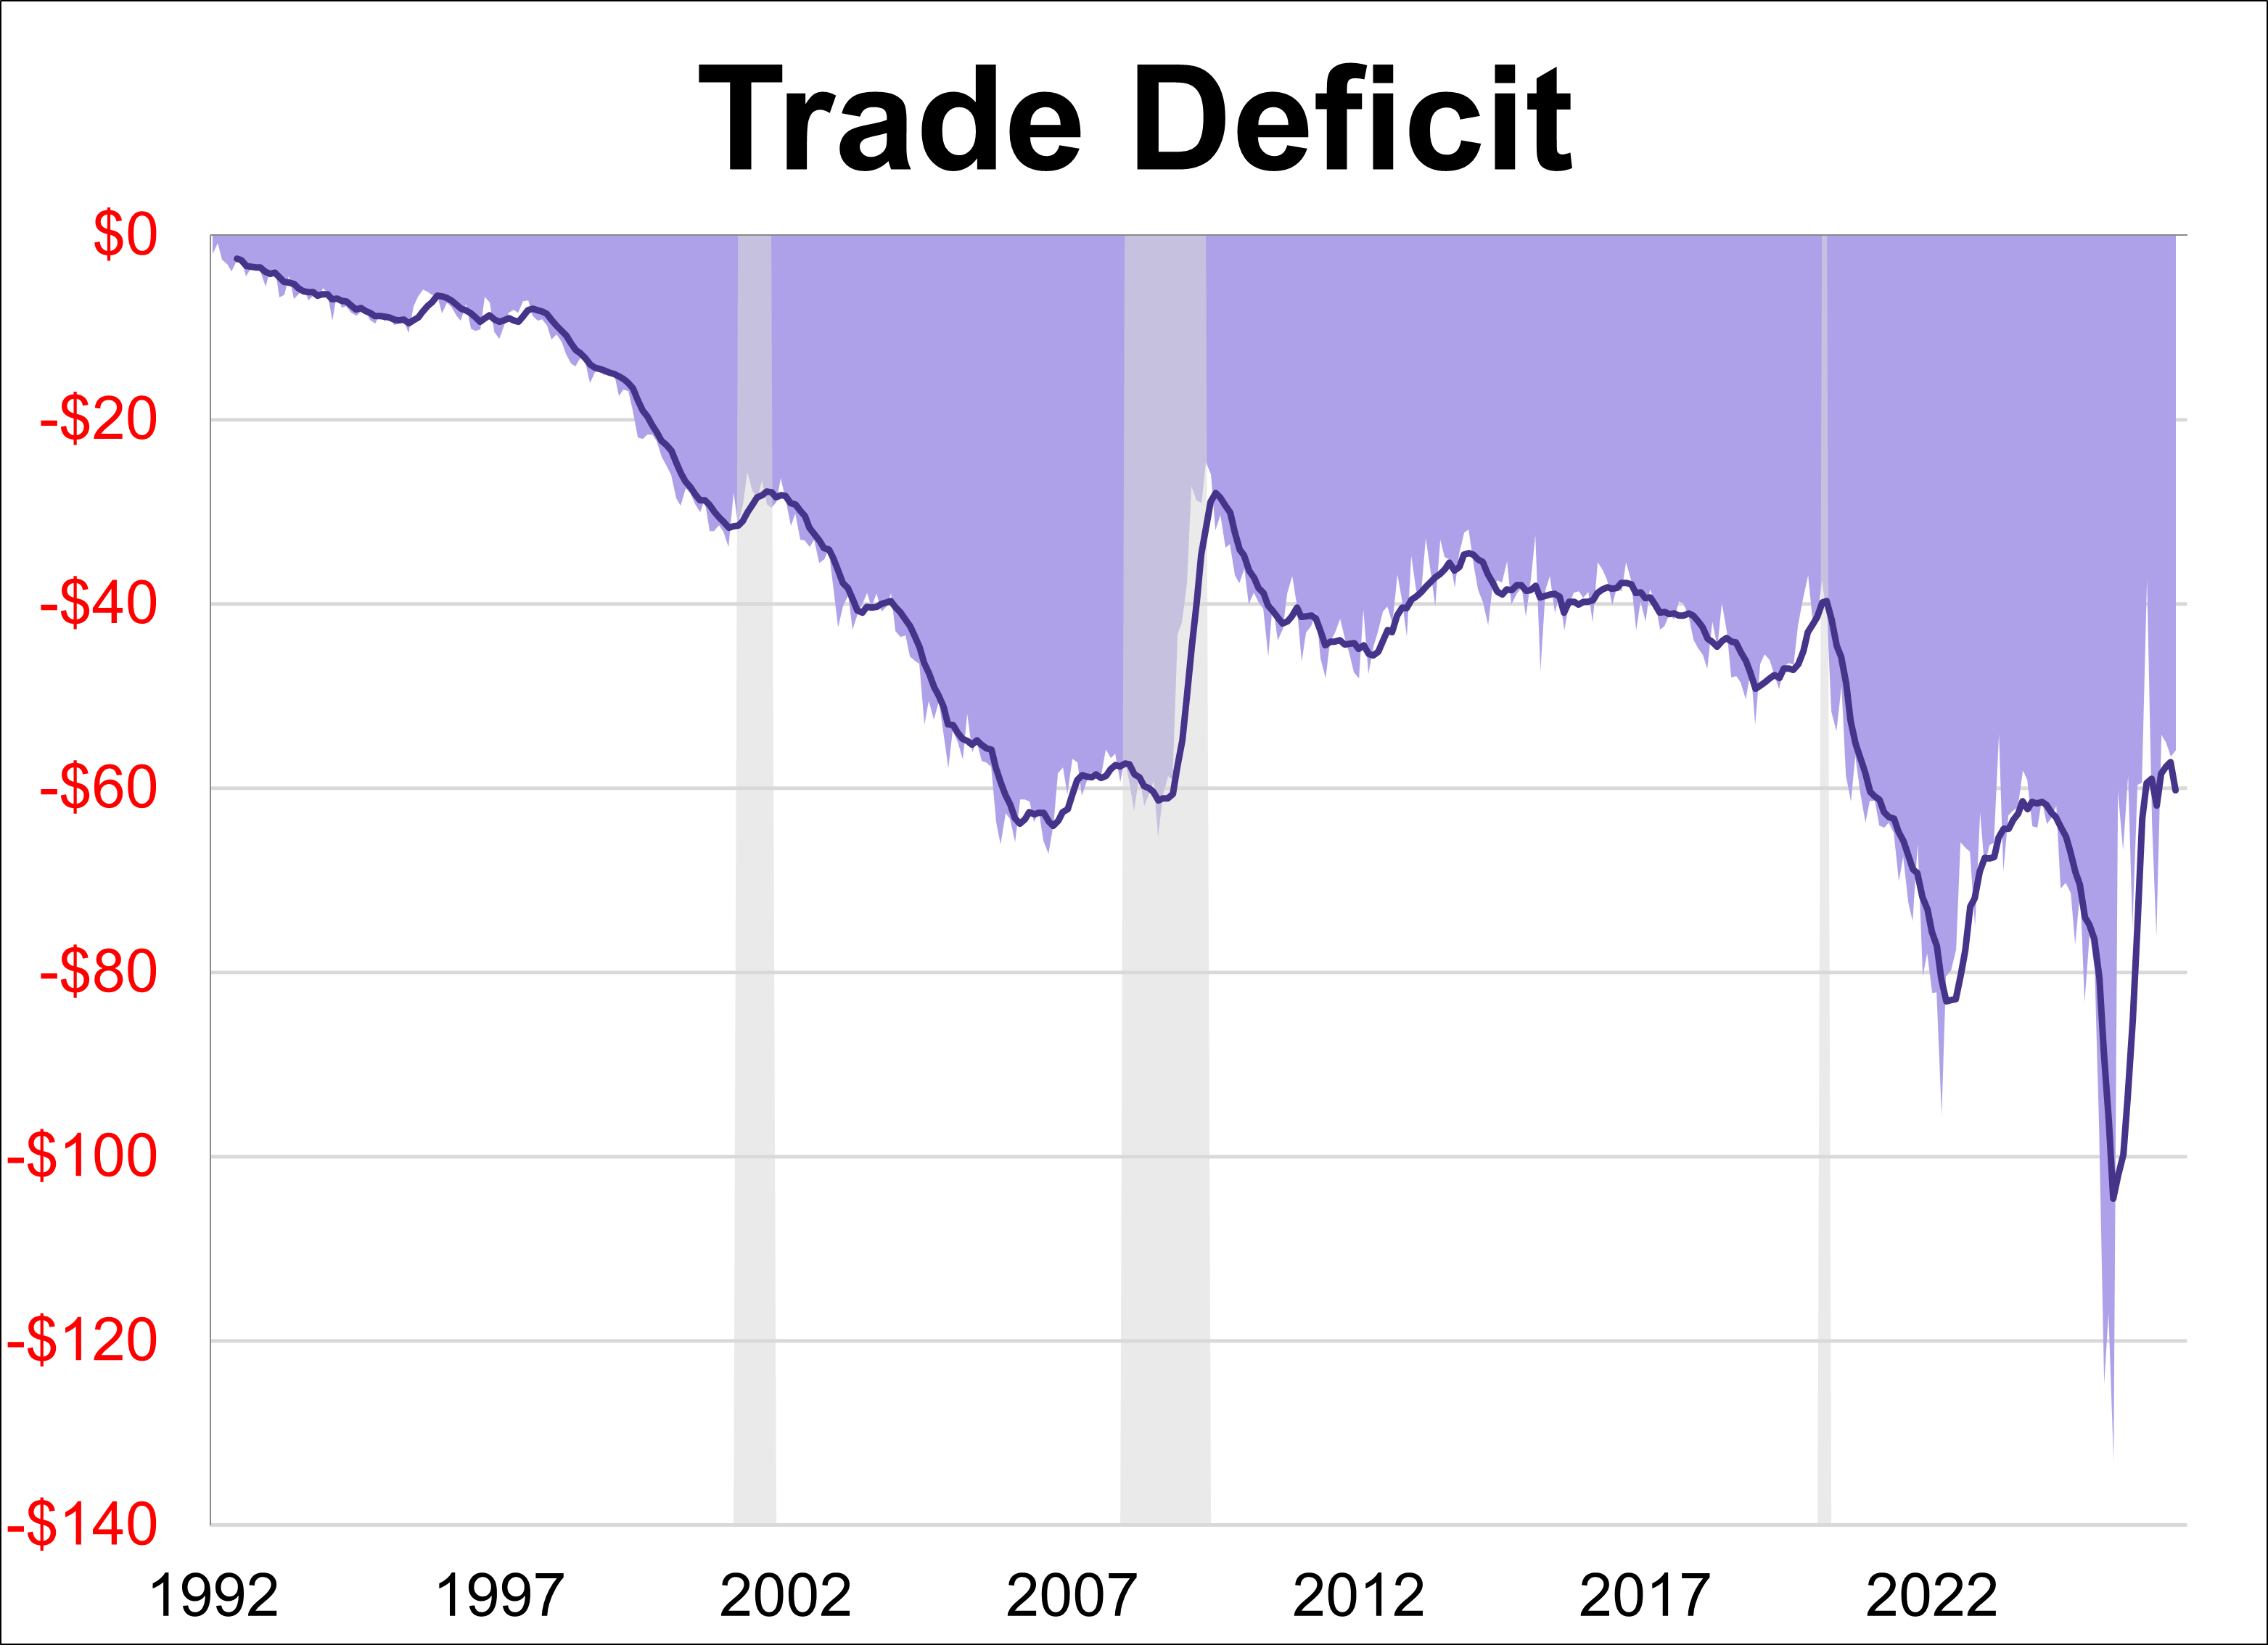
The U.S. trade deficit shrunk just over 1% in April to $55.88B after expanding nearly 3% the previous month. The latest reading barely missed the forecast of -$56.20B.
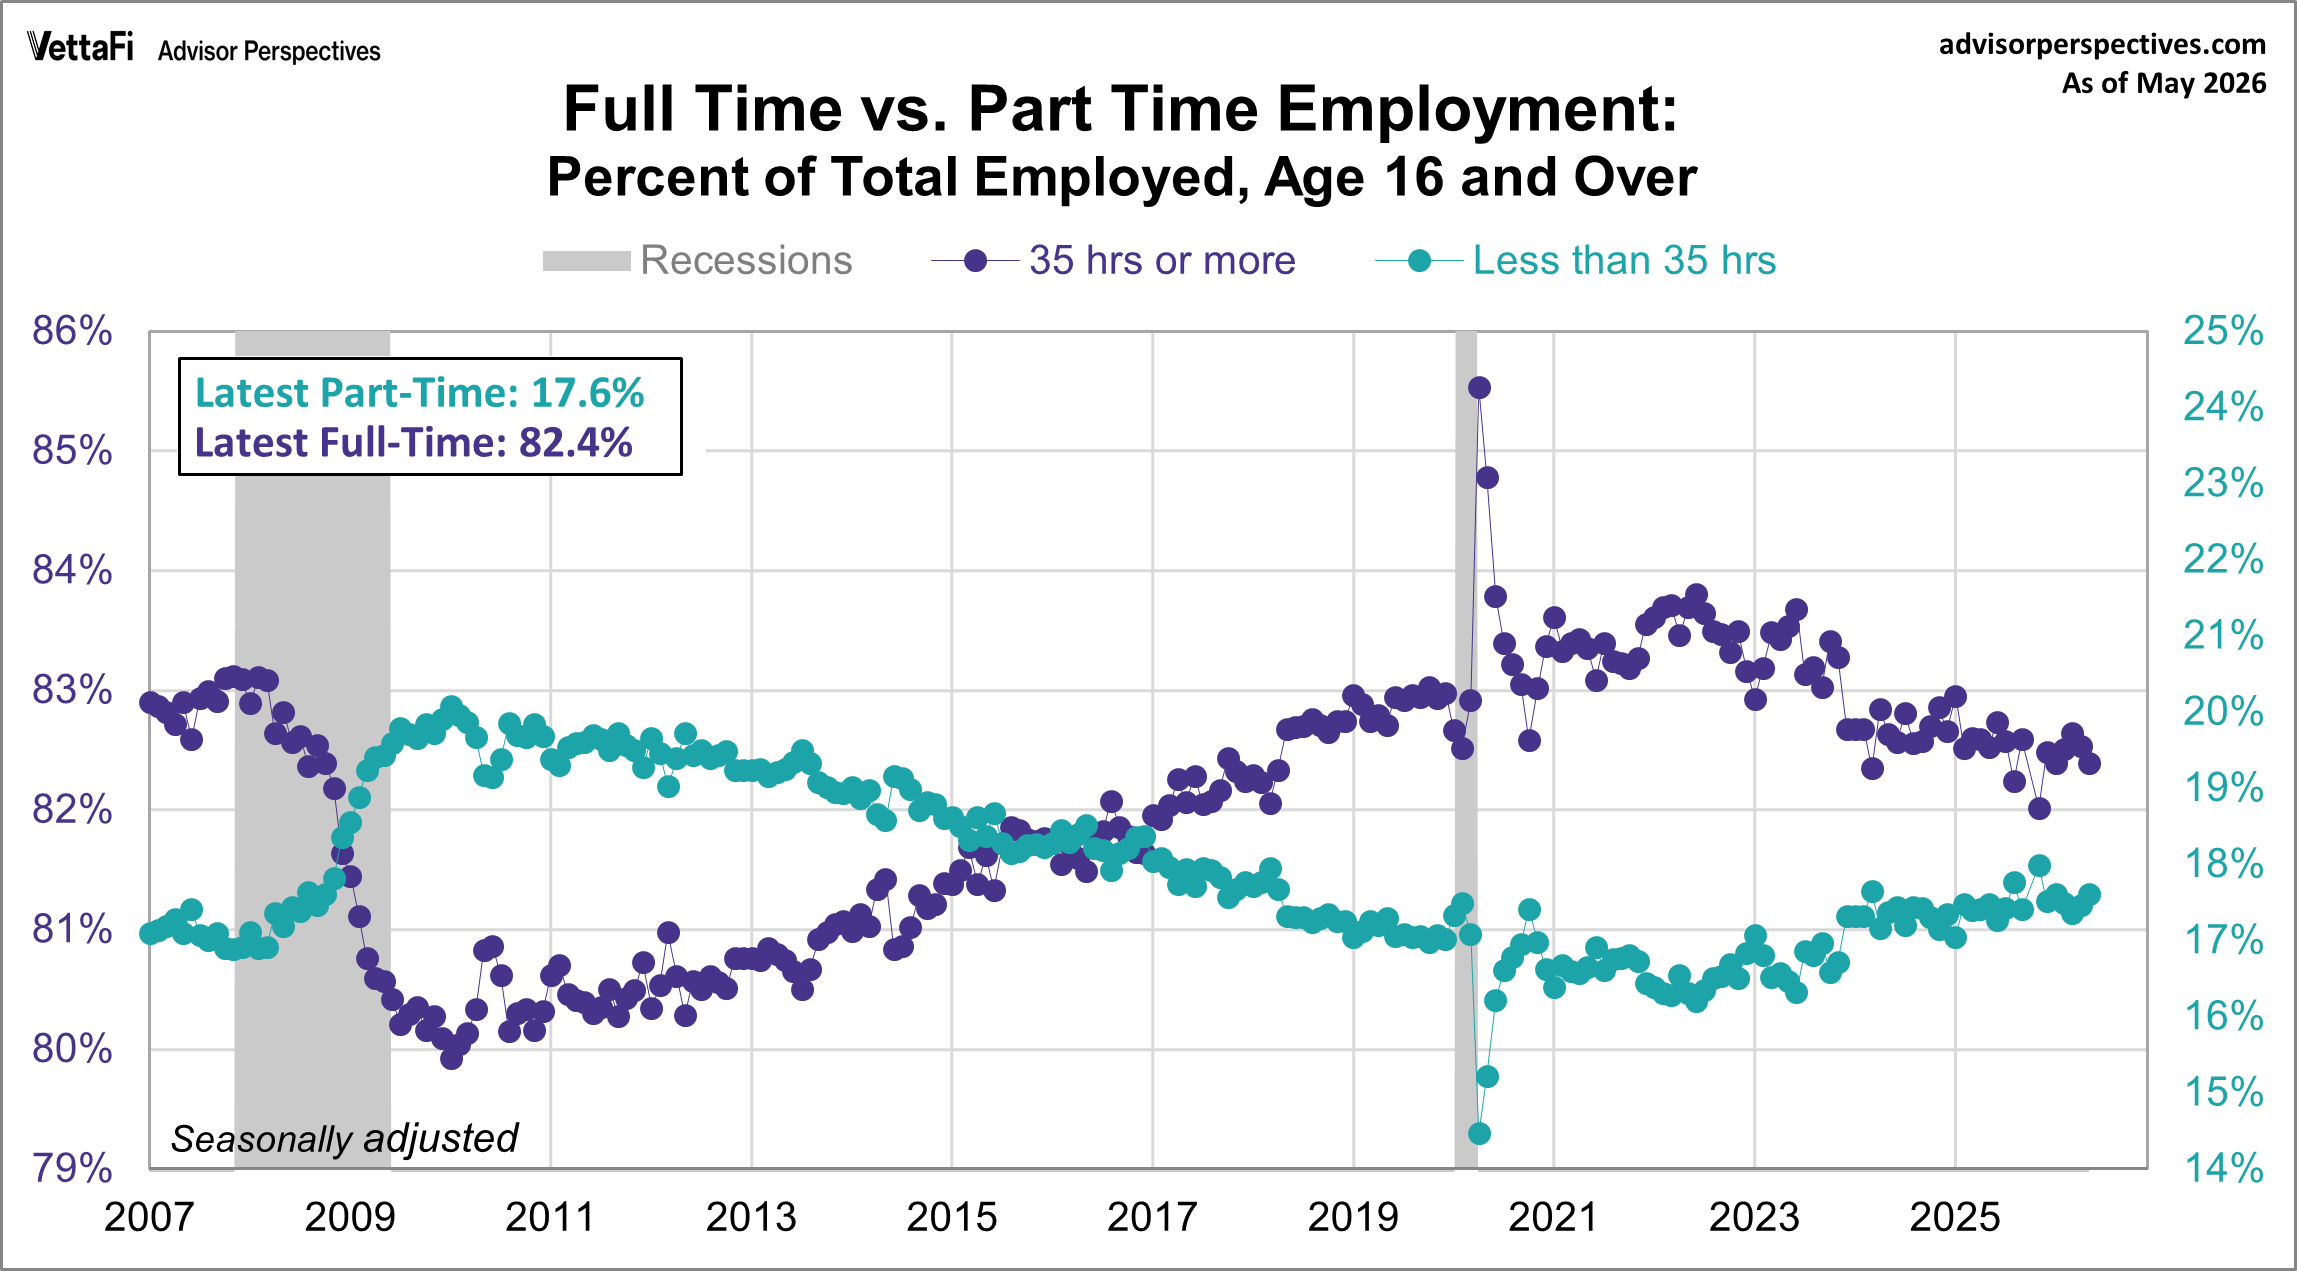
May's employment report showed that 17.6% of total employed workers were part time and 82.4% of total employed workers were full-time.
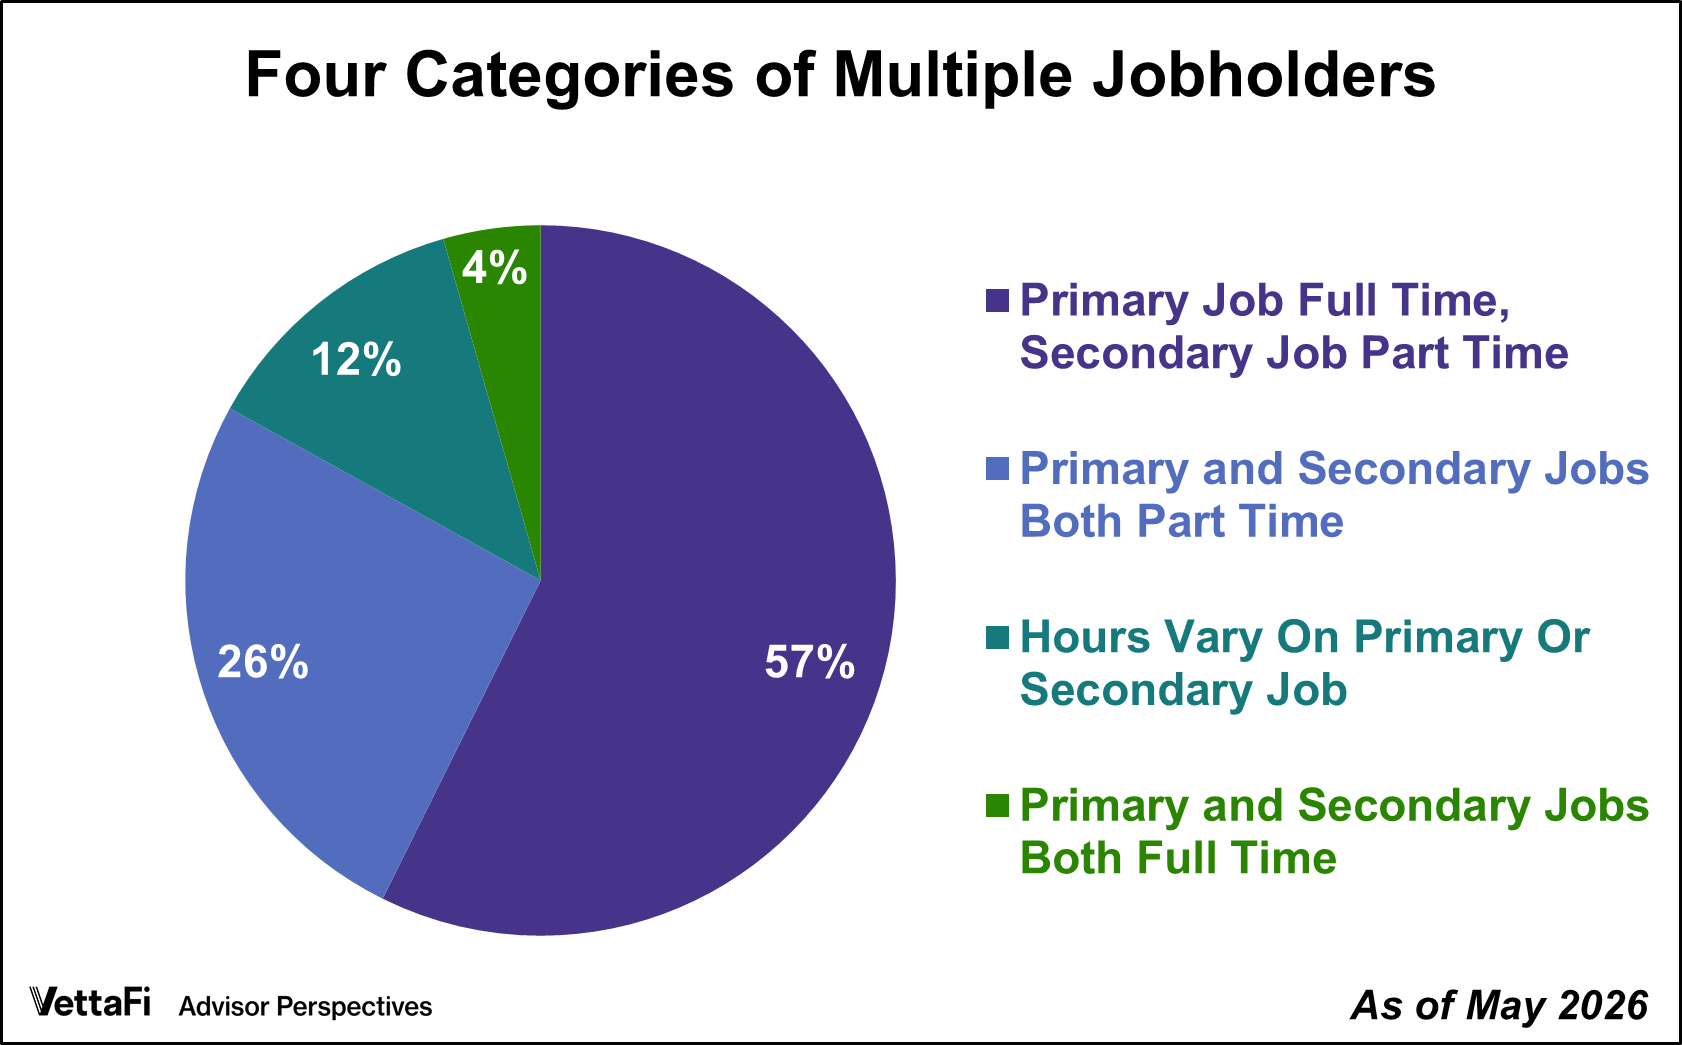
Multiple jobholders accounted for 5.1% of civilian employment in May, the lowest level in ten months.
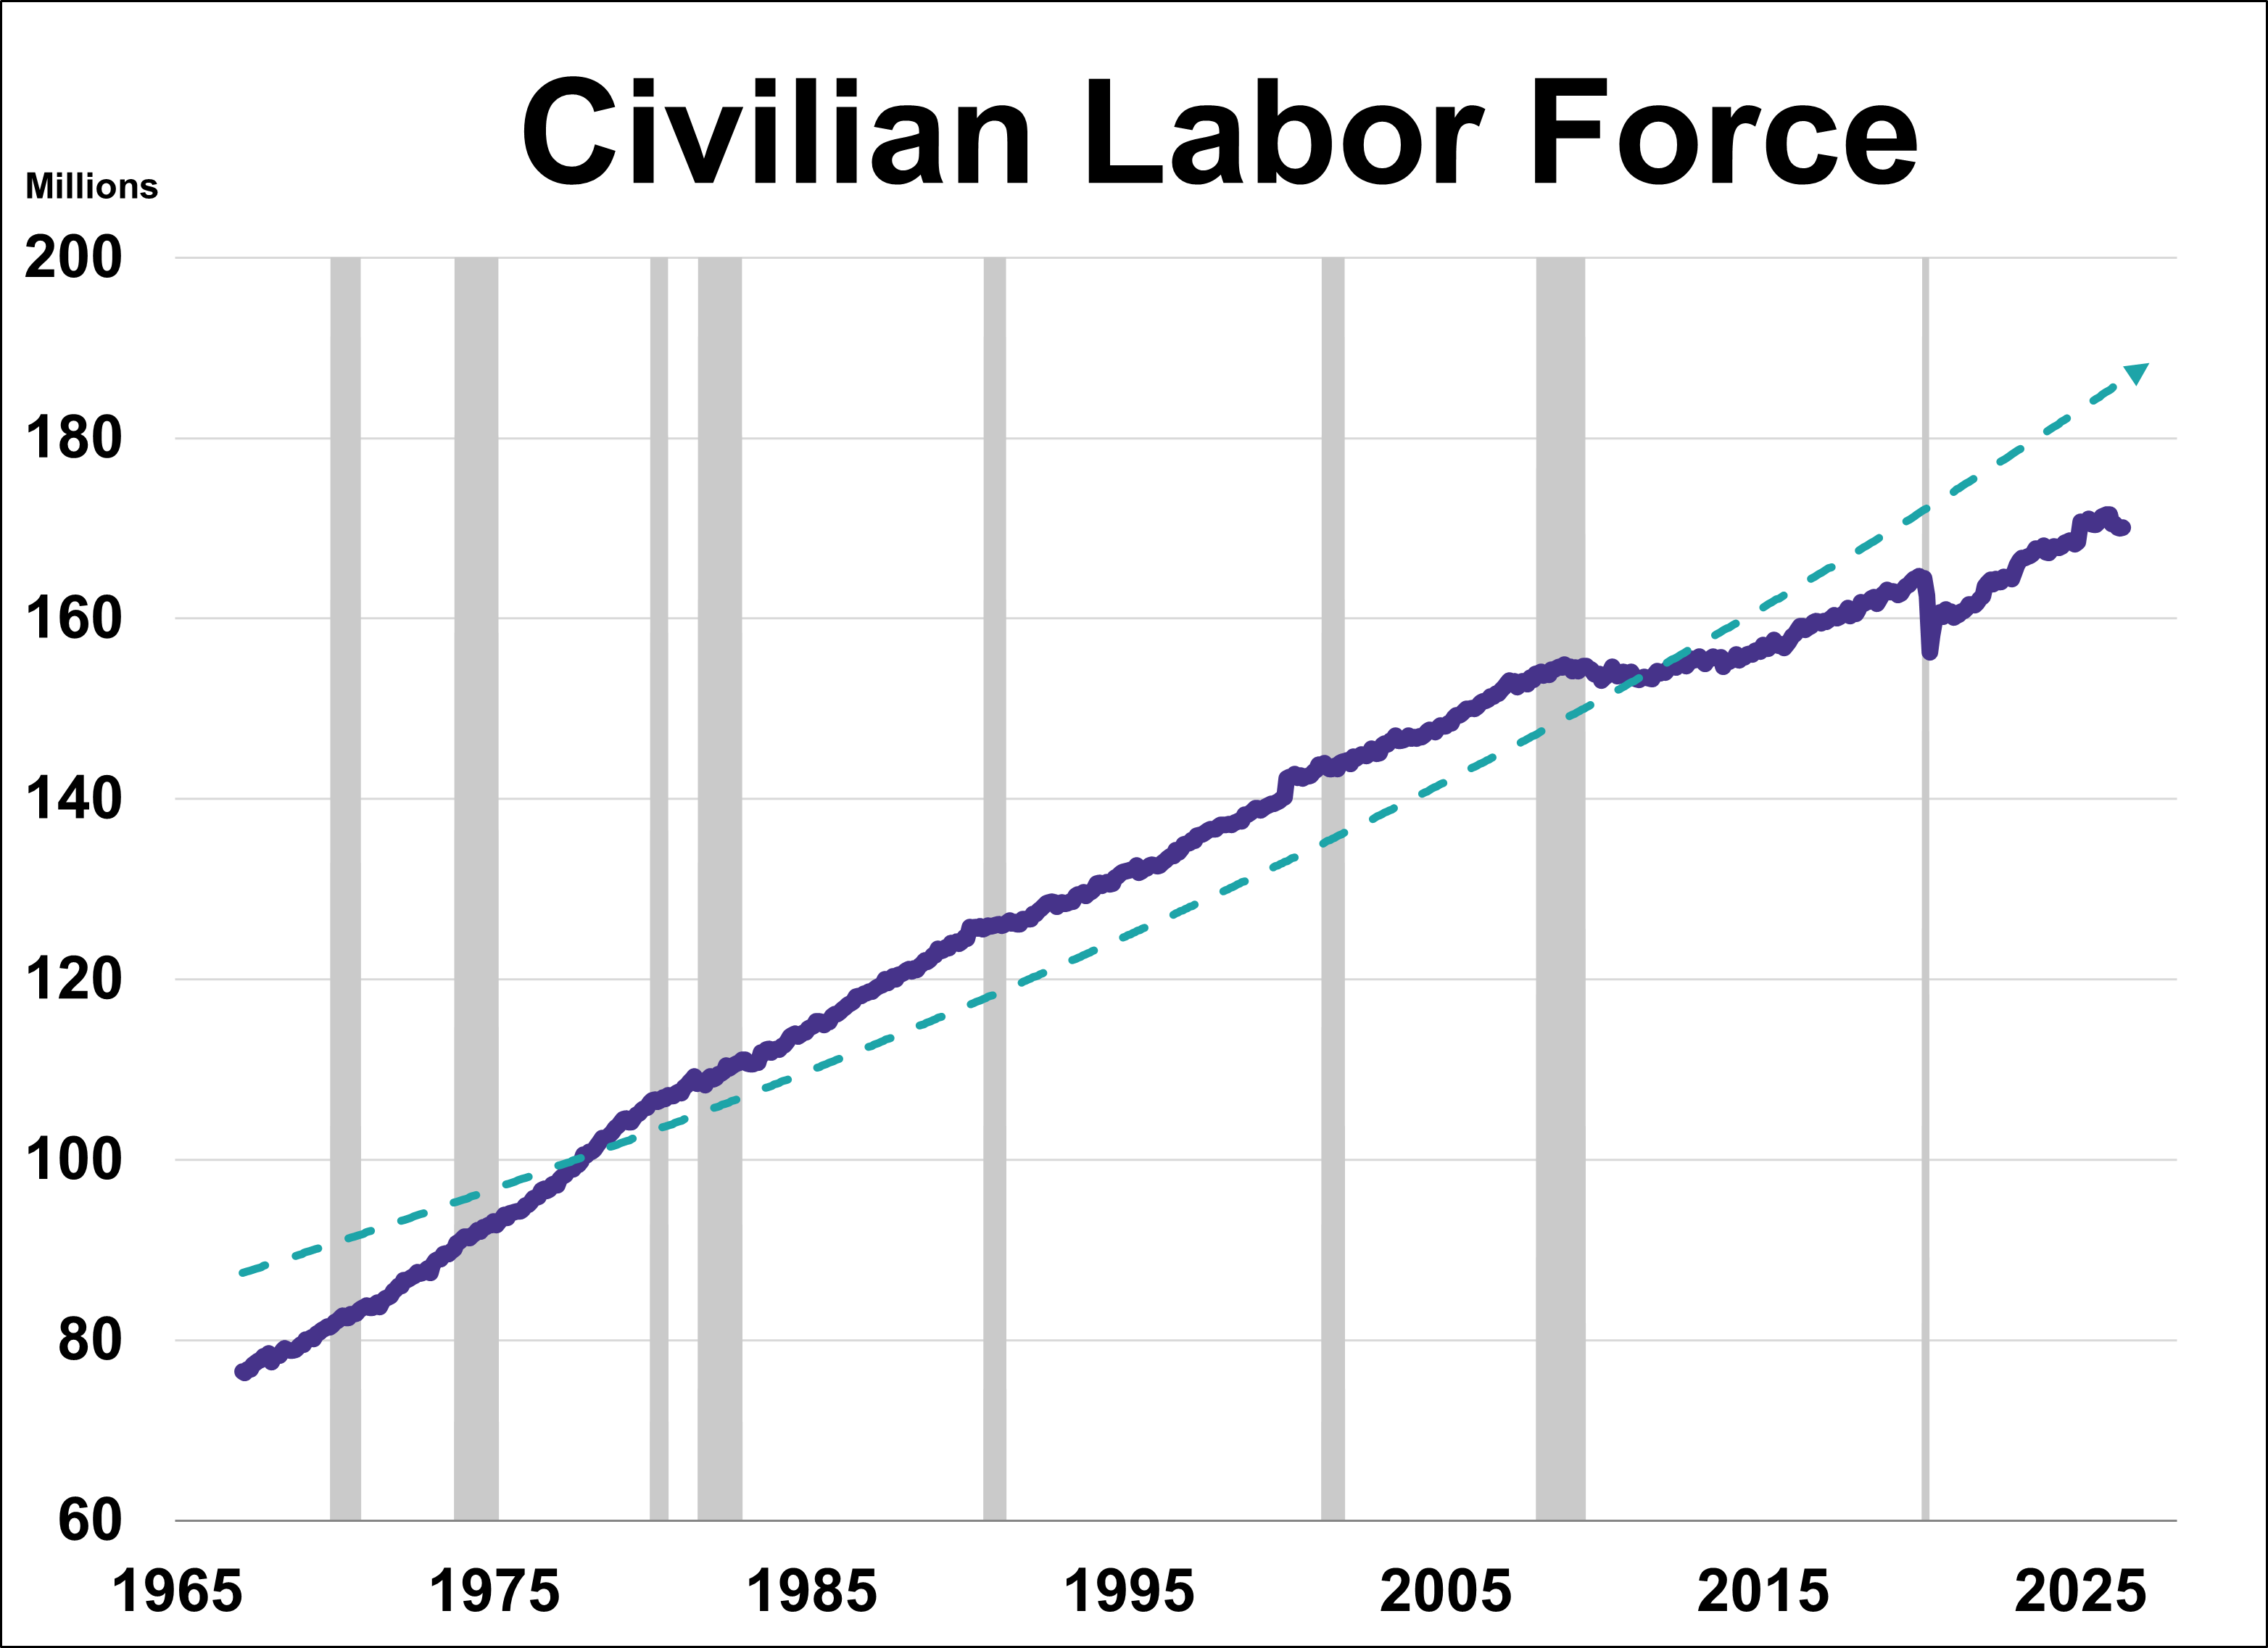
What does the ratio of unemployment claims to the civilian labor force tell us about where we are in the business cycle and recession risk?
The U.S. labor market took center stage last week as three major labor market indicators outperformed forecasts. Robust payroll additions in both the public and private sectors, paired with a massive surge in job openings, point to a workforce on solid footing.
Ride the momentum wave. Discover how tech-fueled factors propelled momentum and high-beta ETFs to historic, benchmark-crushing gains.
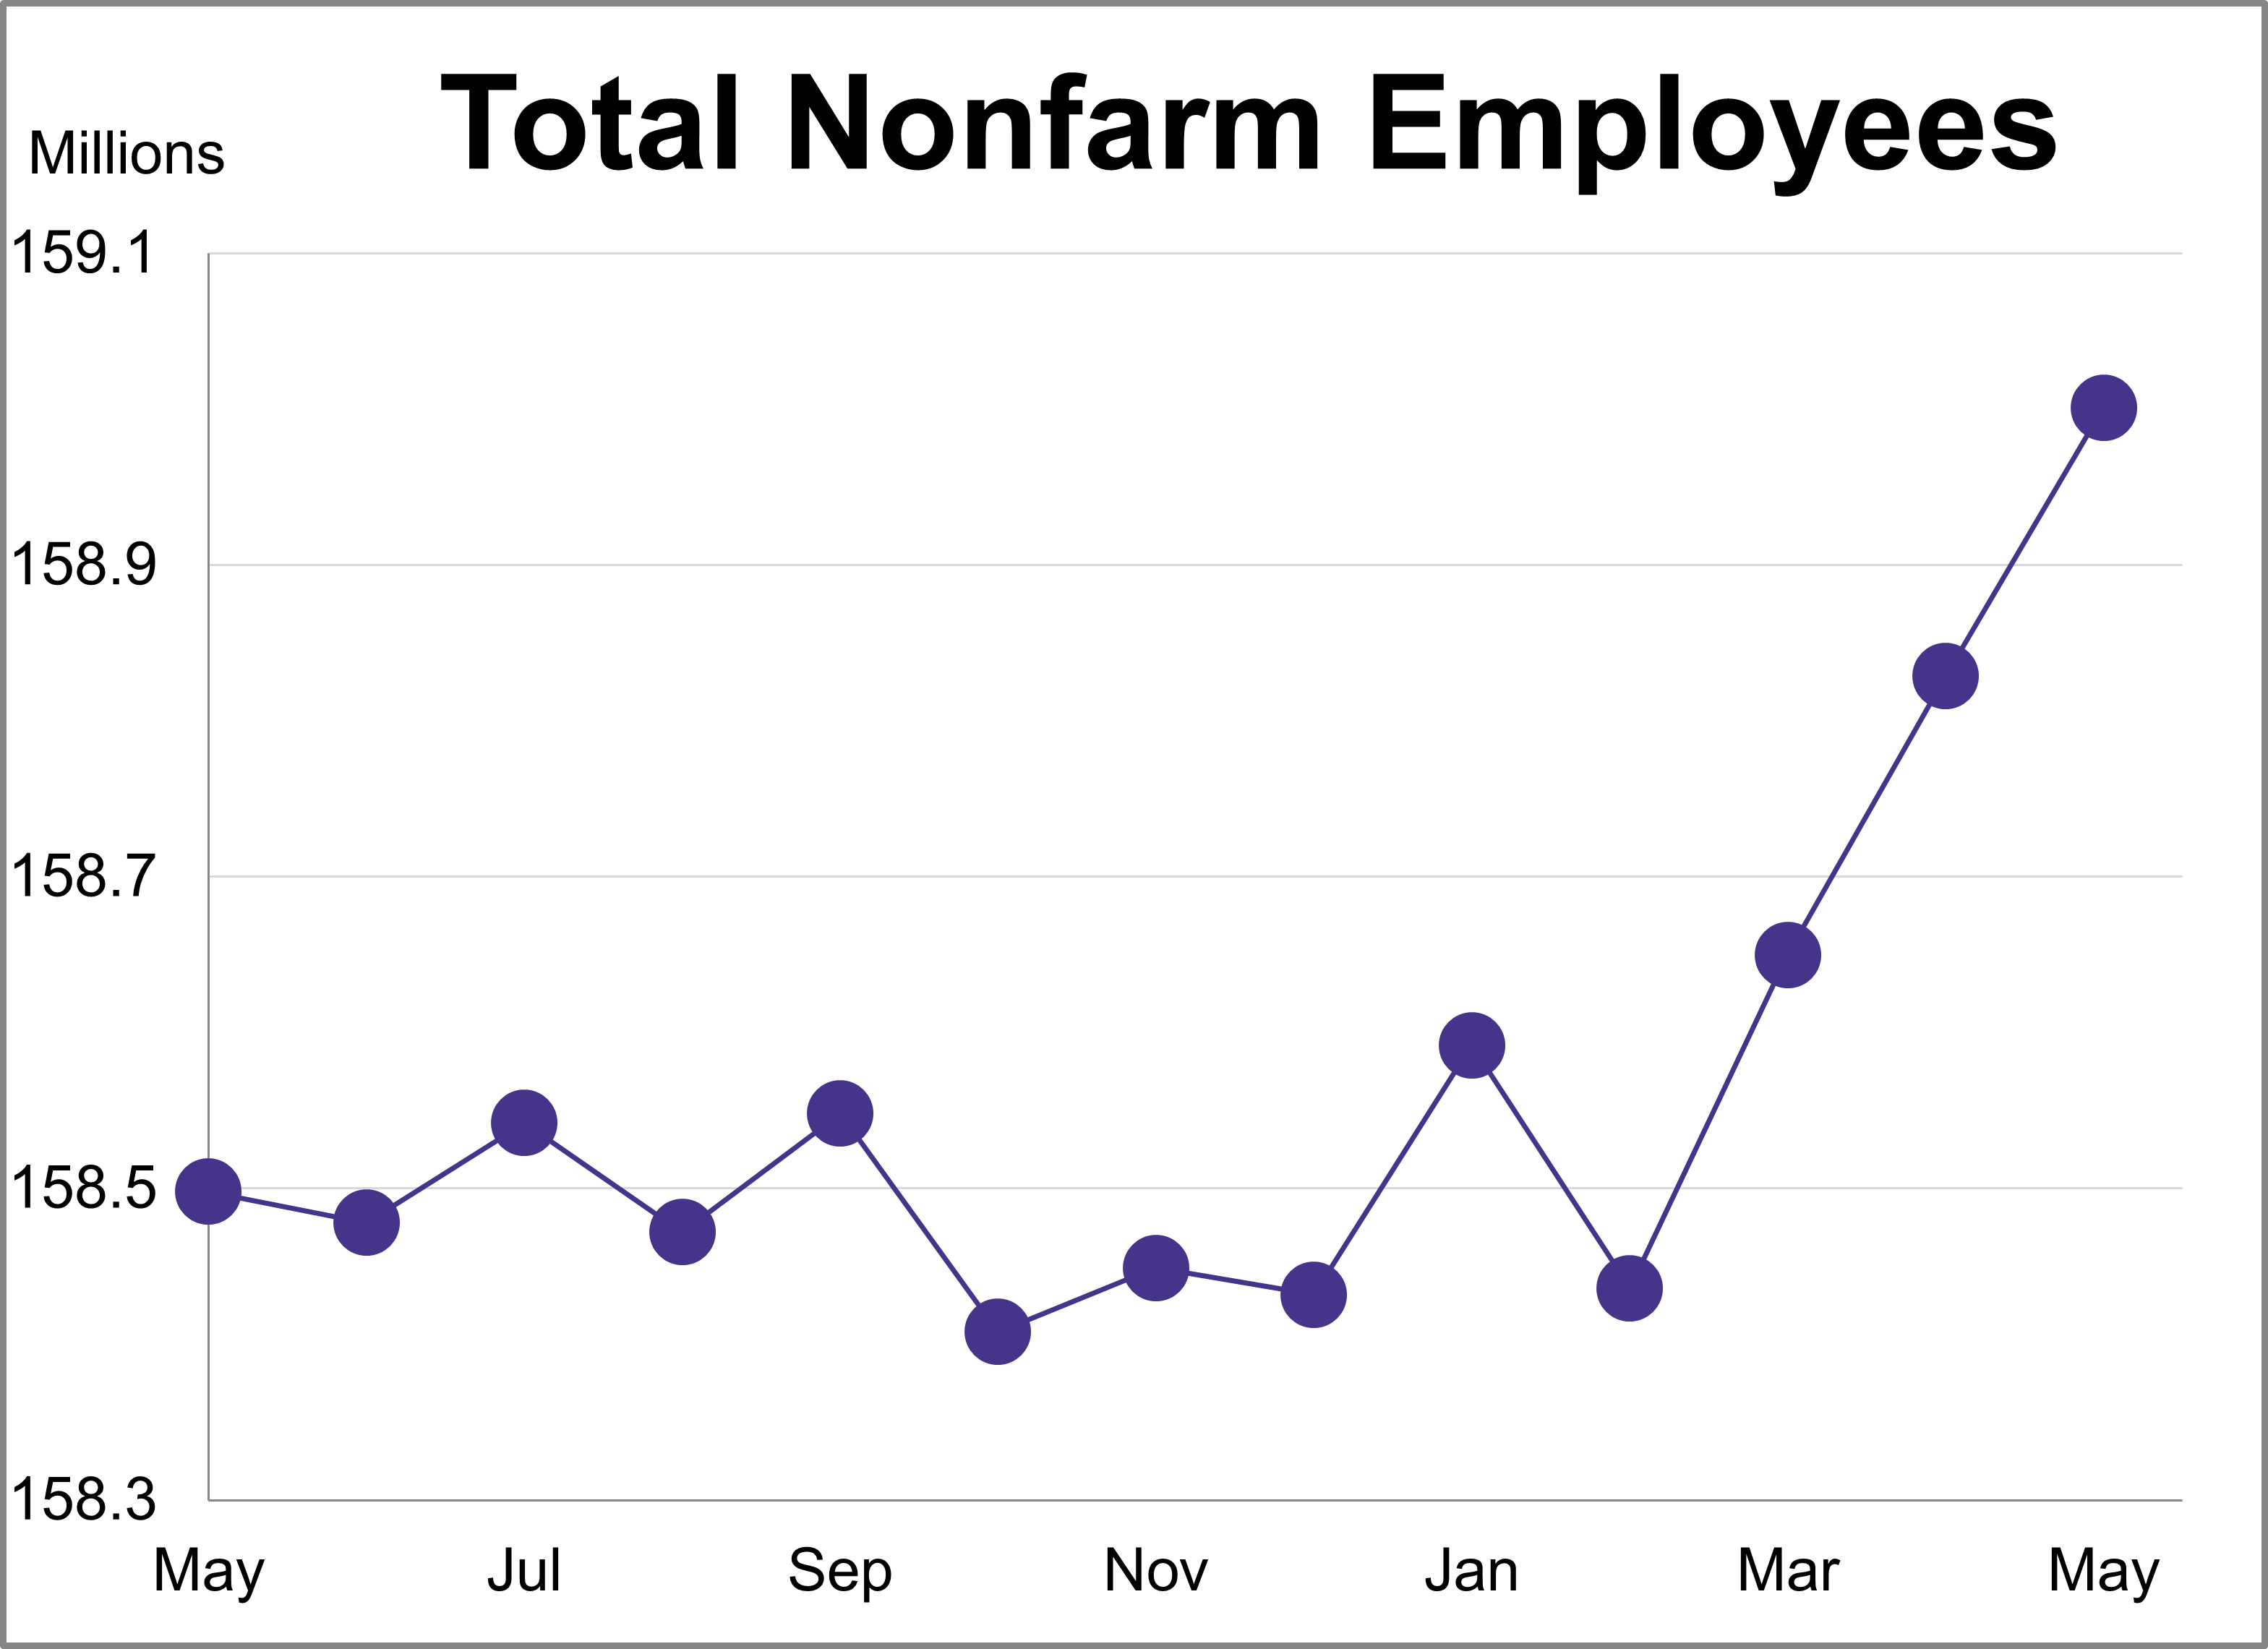
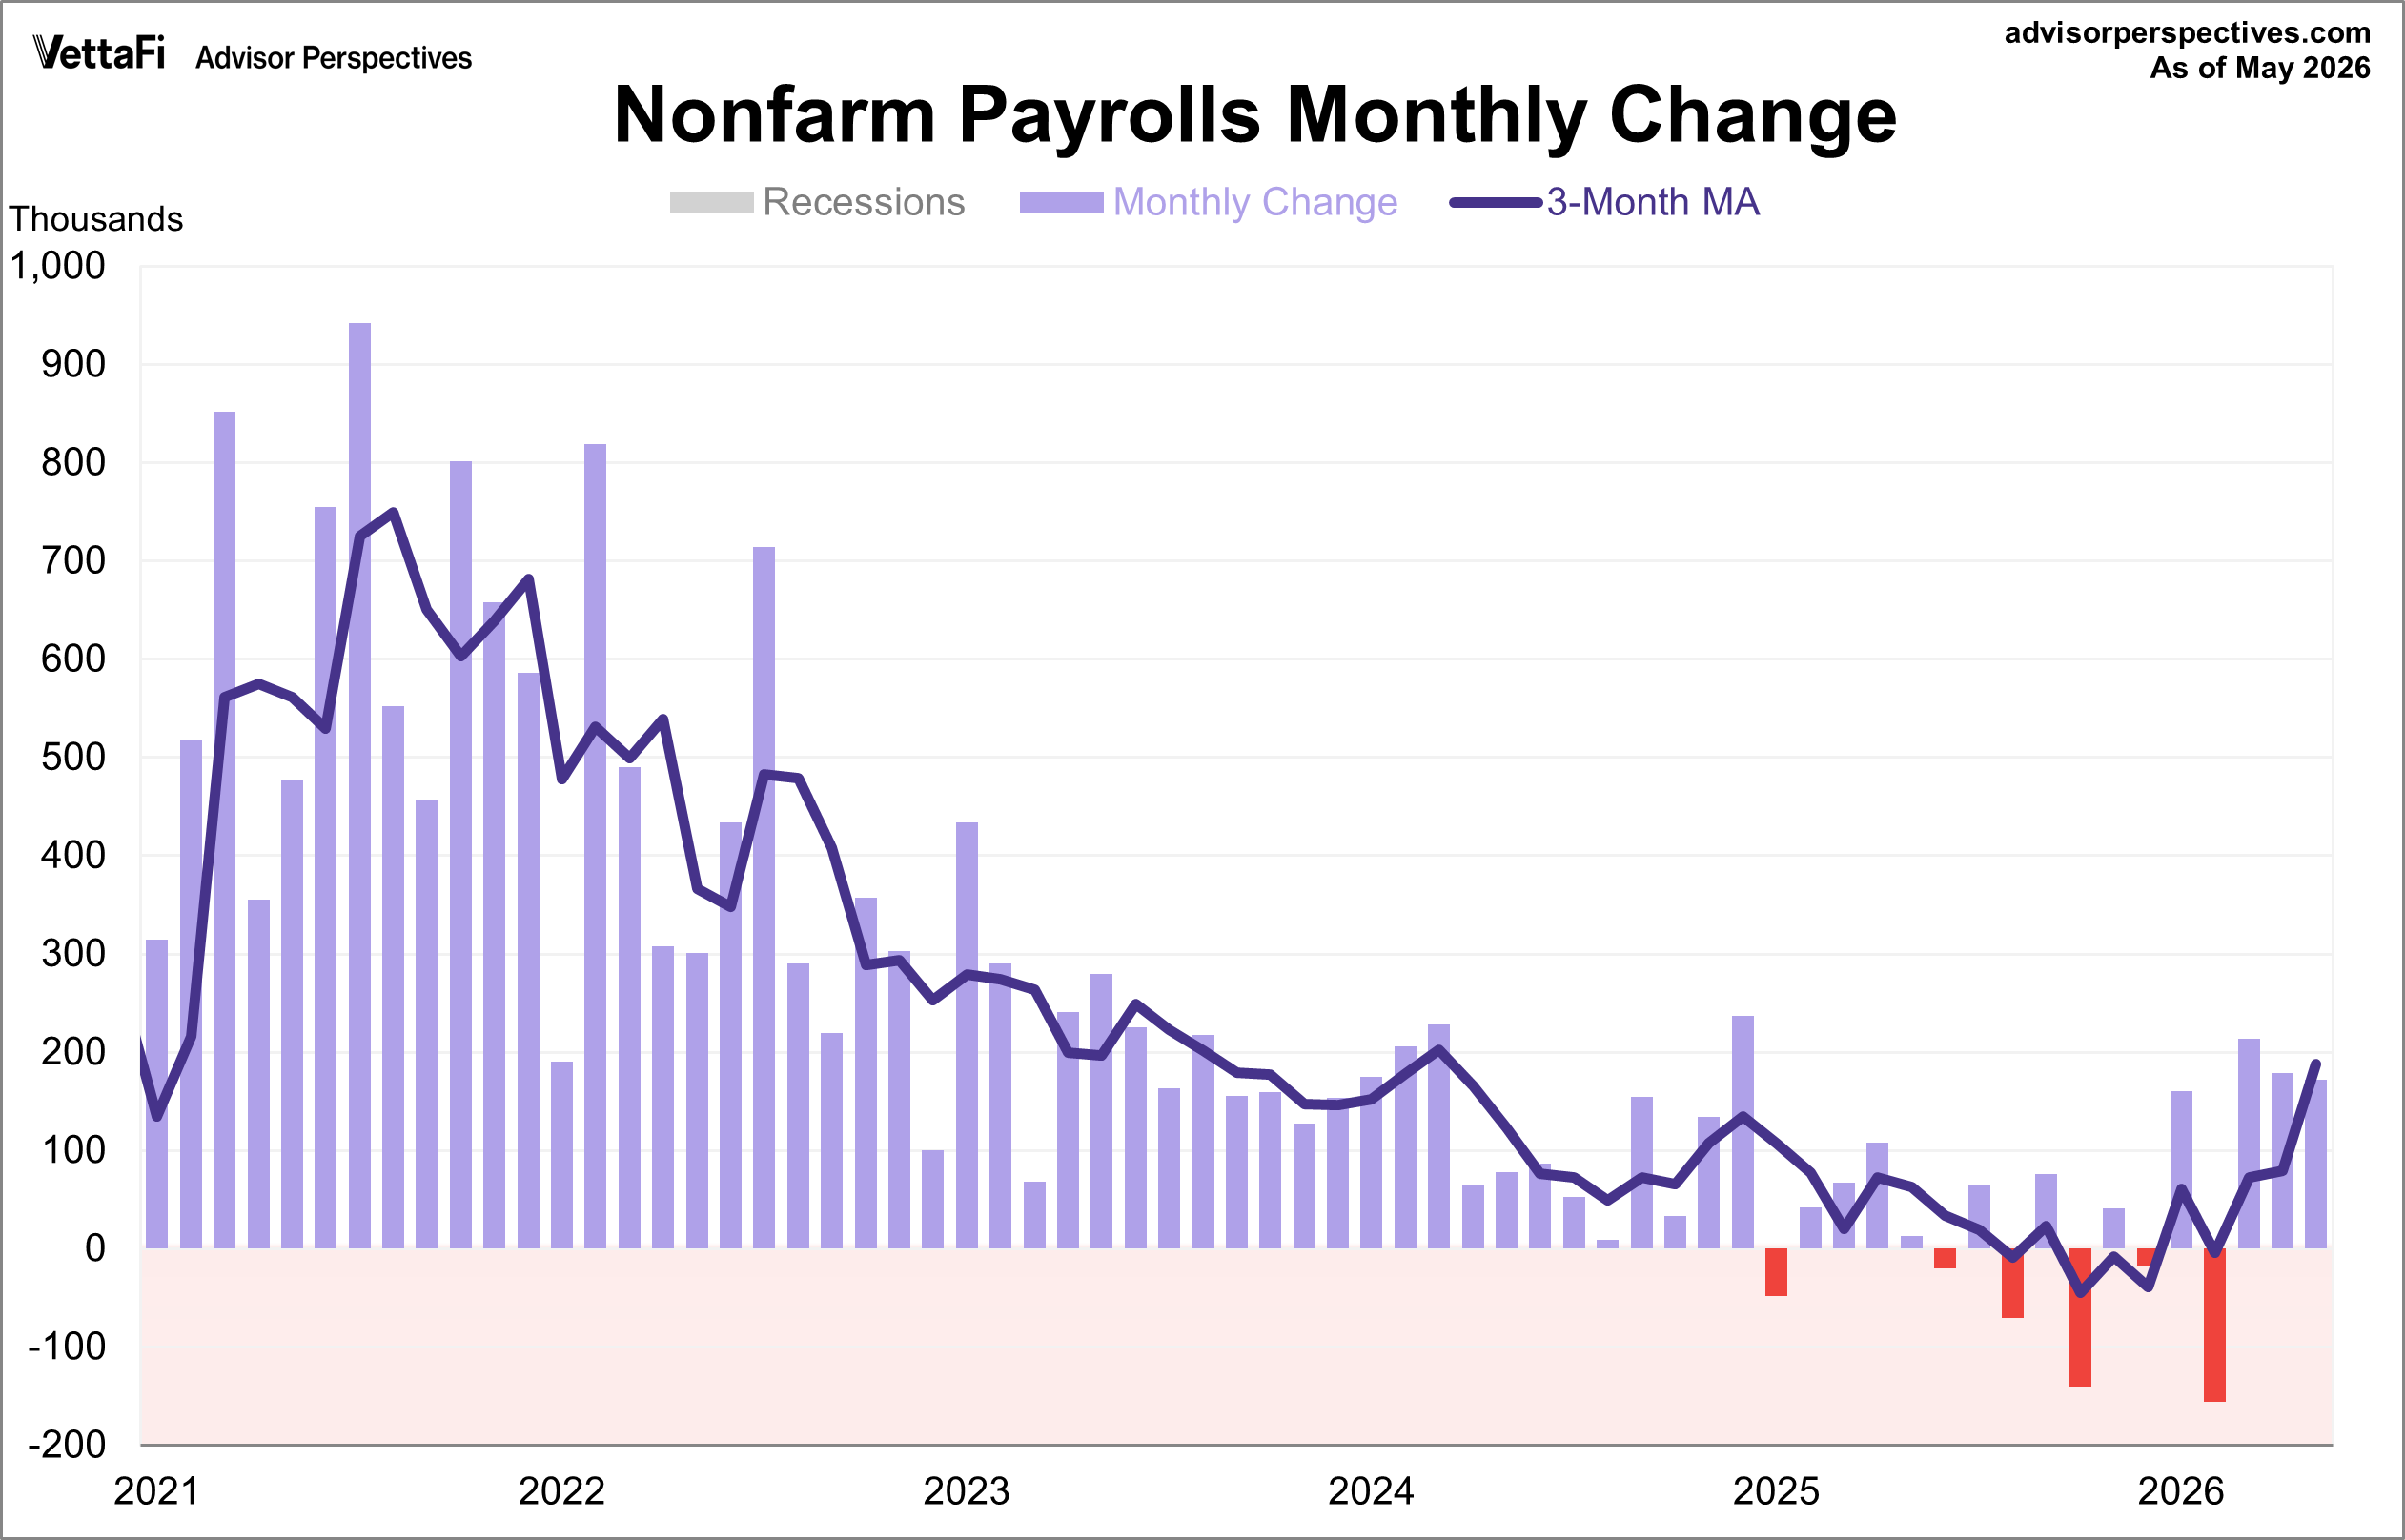
There is a general belief that there are four big indicators that the NBER Business Cycle Dating Committee weighs heavily in their cycle identification process. This commentary focuses on one of these indicators: nonfarm employment. In May, total nonfarm payrolls increased by 172,000 while the unemployment rate remained at 4.3%.
The latest employment report showed that 172,000 jobs were added in May, down slightly from April's 179,000 gain. This figure was more than double the projected addition of 85,000 jobs. Meanwhile, the unemployment rate remained at 4.3%, as expected.
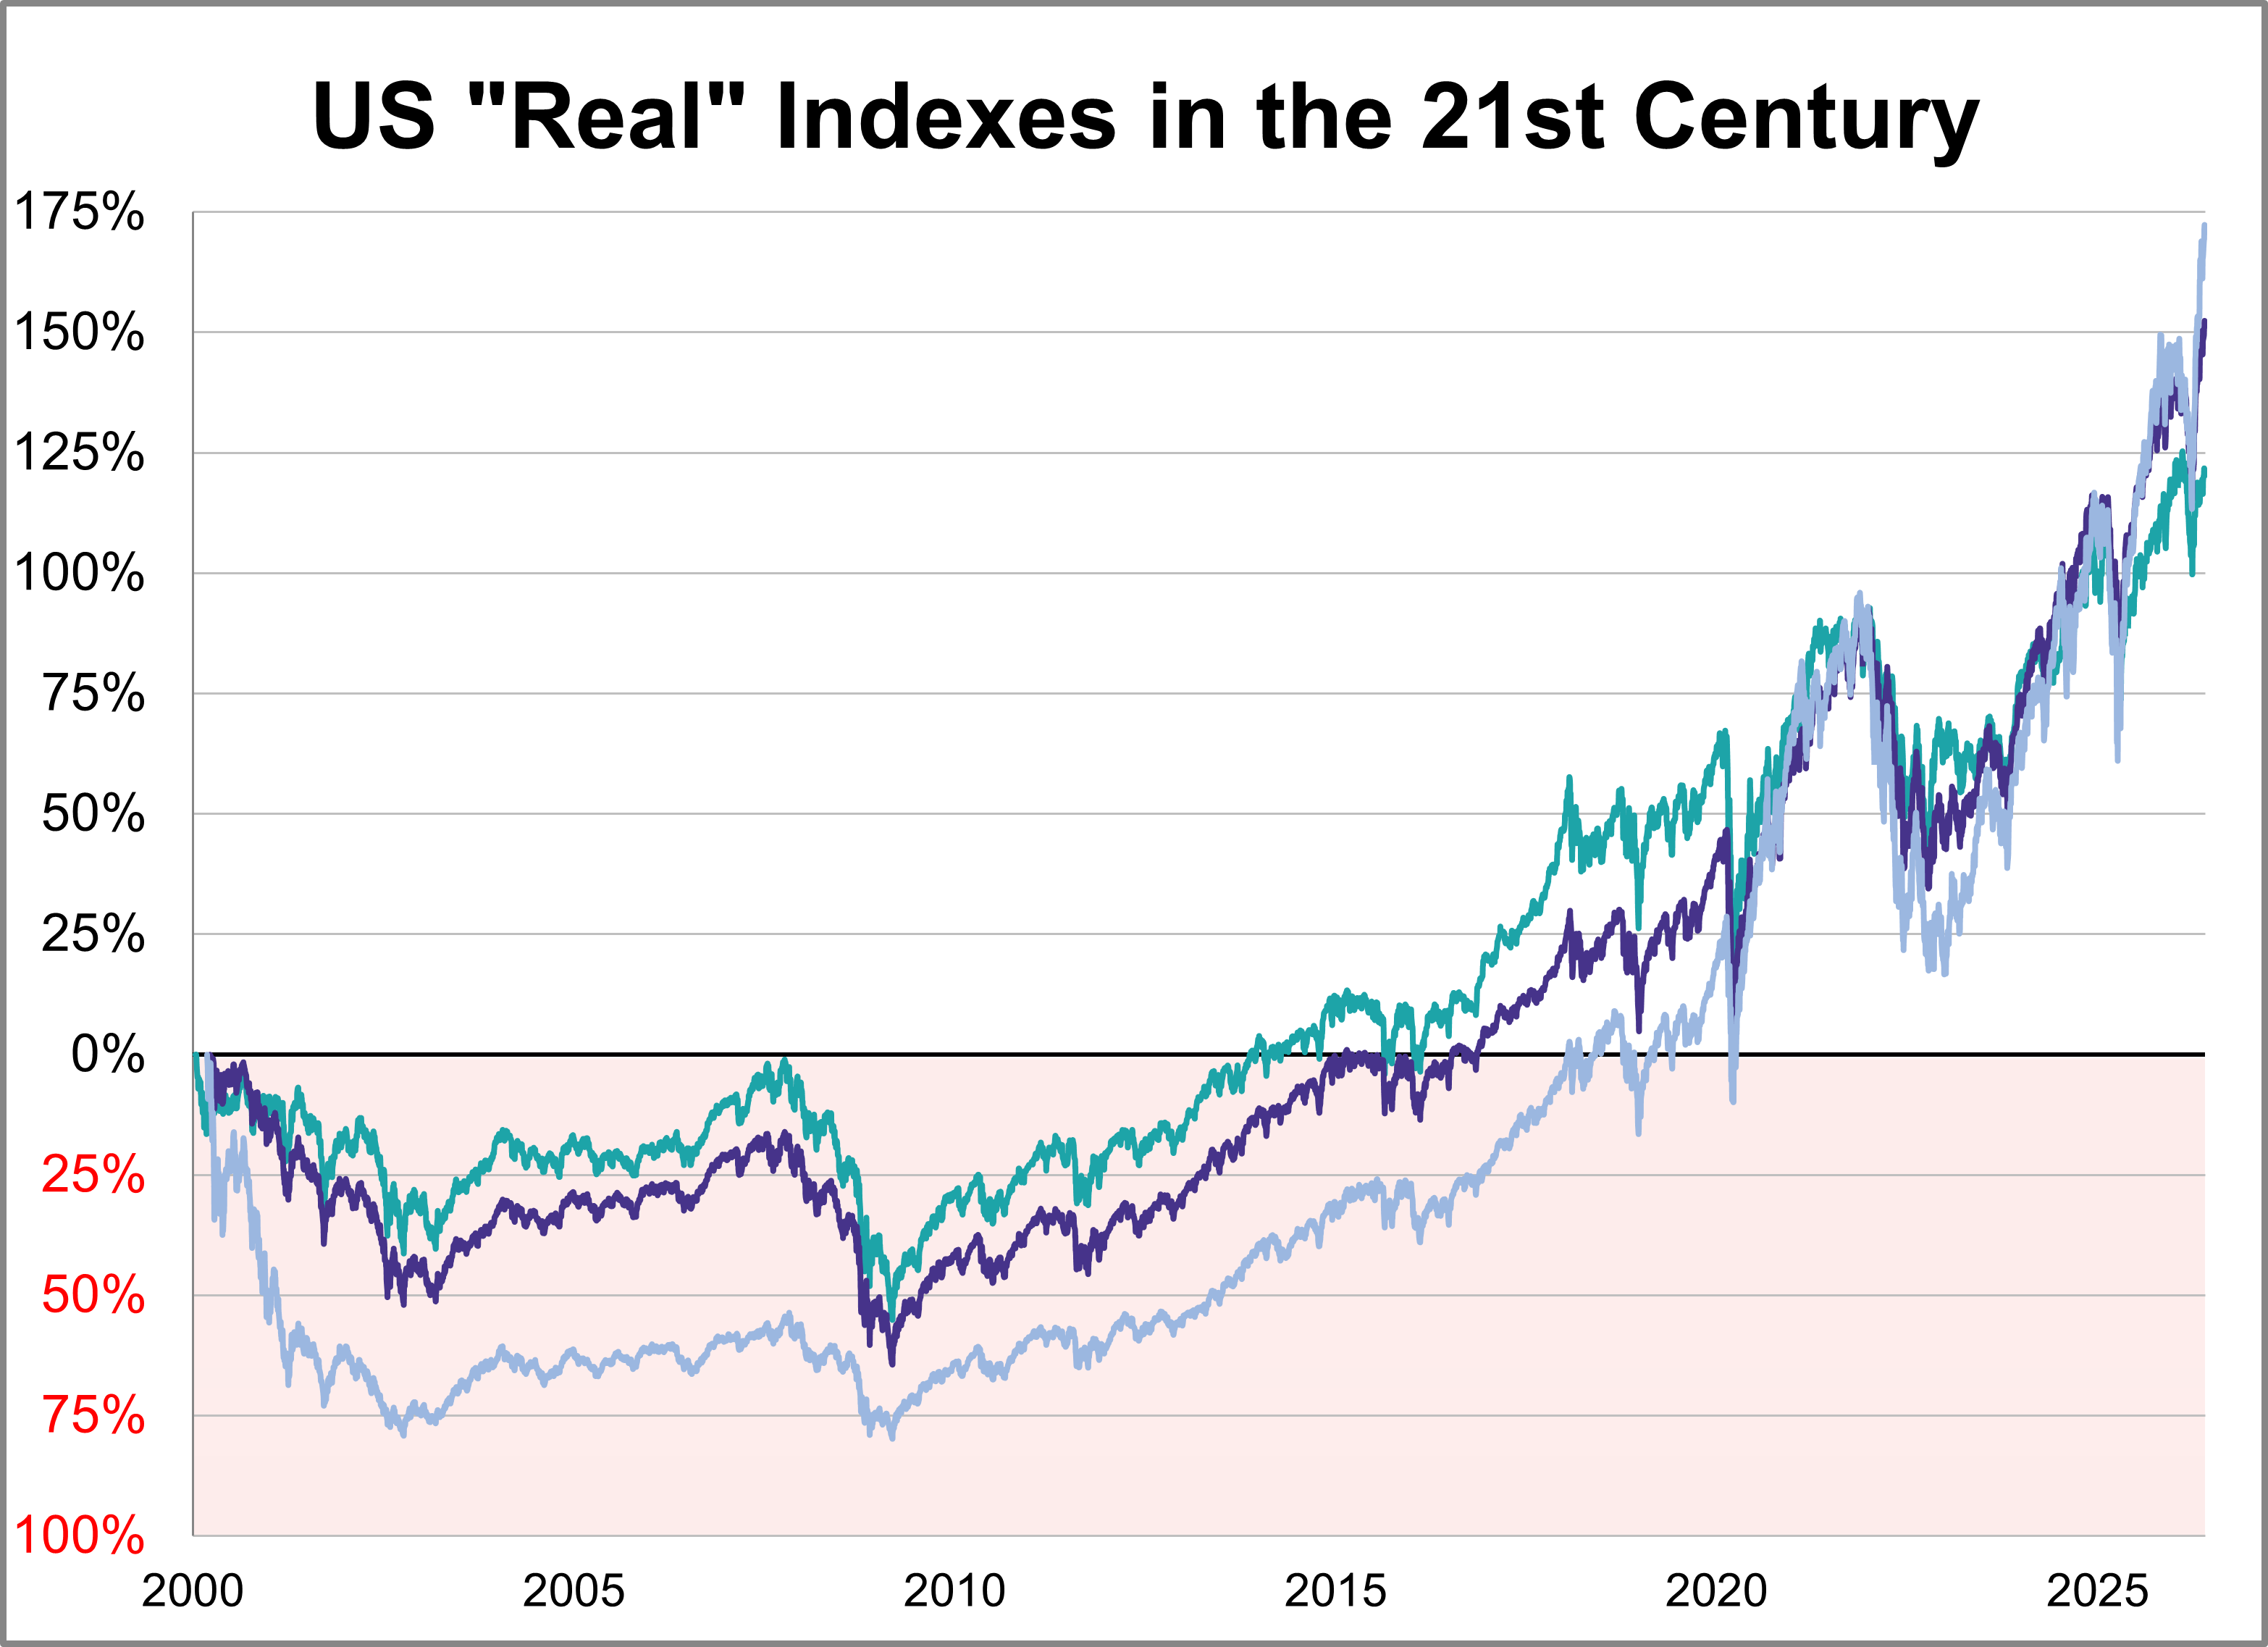
Here is a look at real (inflation-adjusted) charts of the S&P 500, Dow 30, and Nasdaq composite since their 2000 highs. We've updated this through the May 2026 close.
Here's an interesting set of charts that will especially resonate with those of us who follow economic and market cycles. Imagine that five years ago you invested $10,000 in the S&P 500. How much would it be worth today, with dividends reinvested but adjusted for inflation?
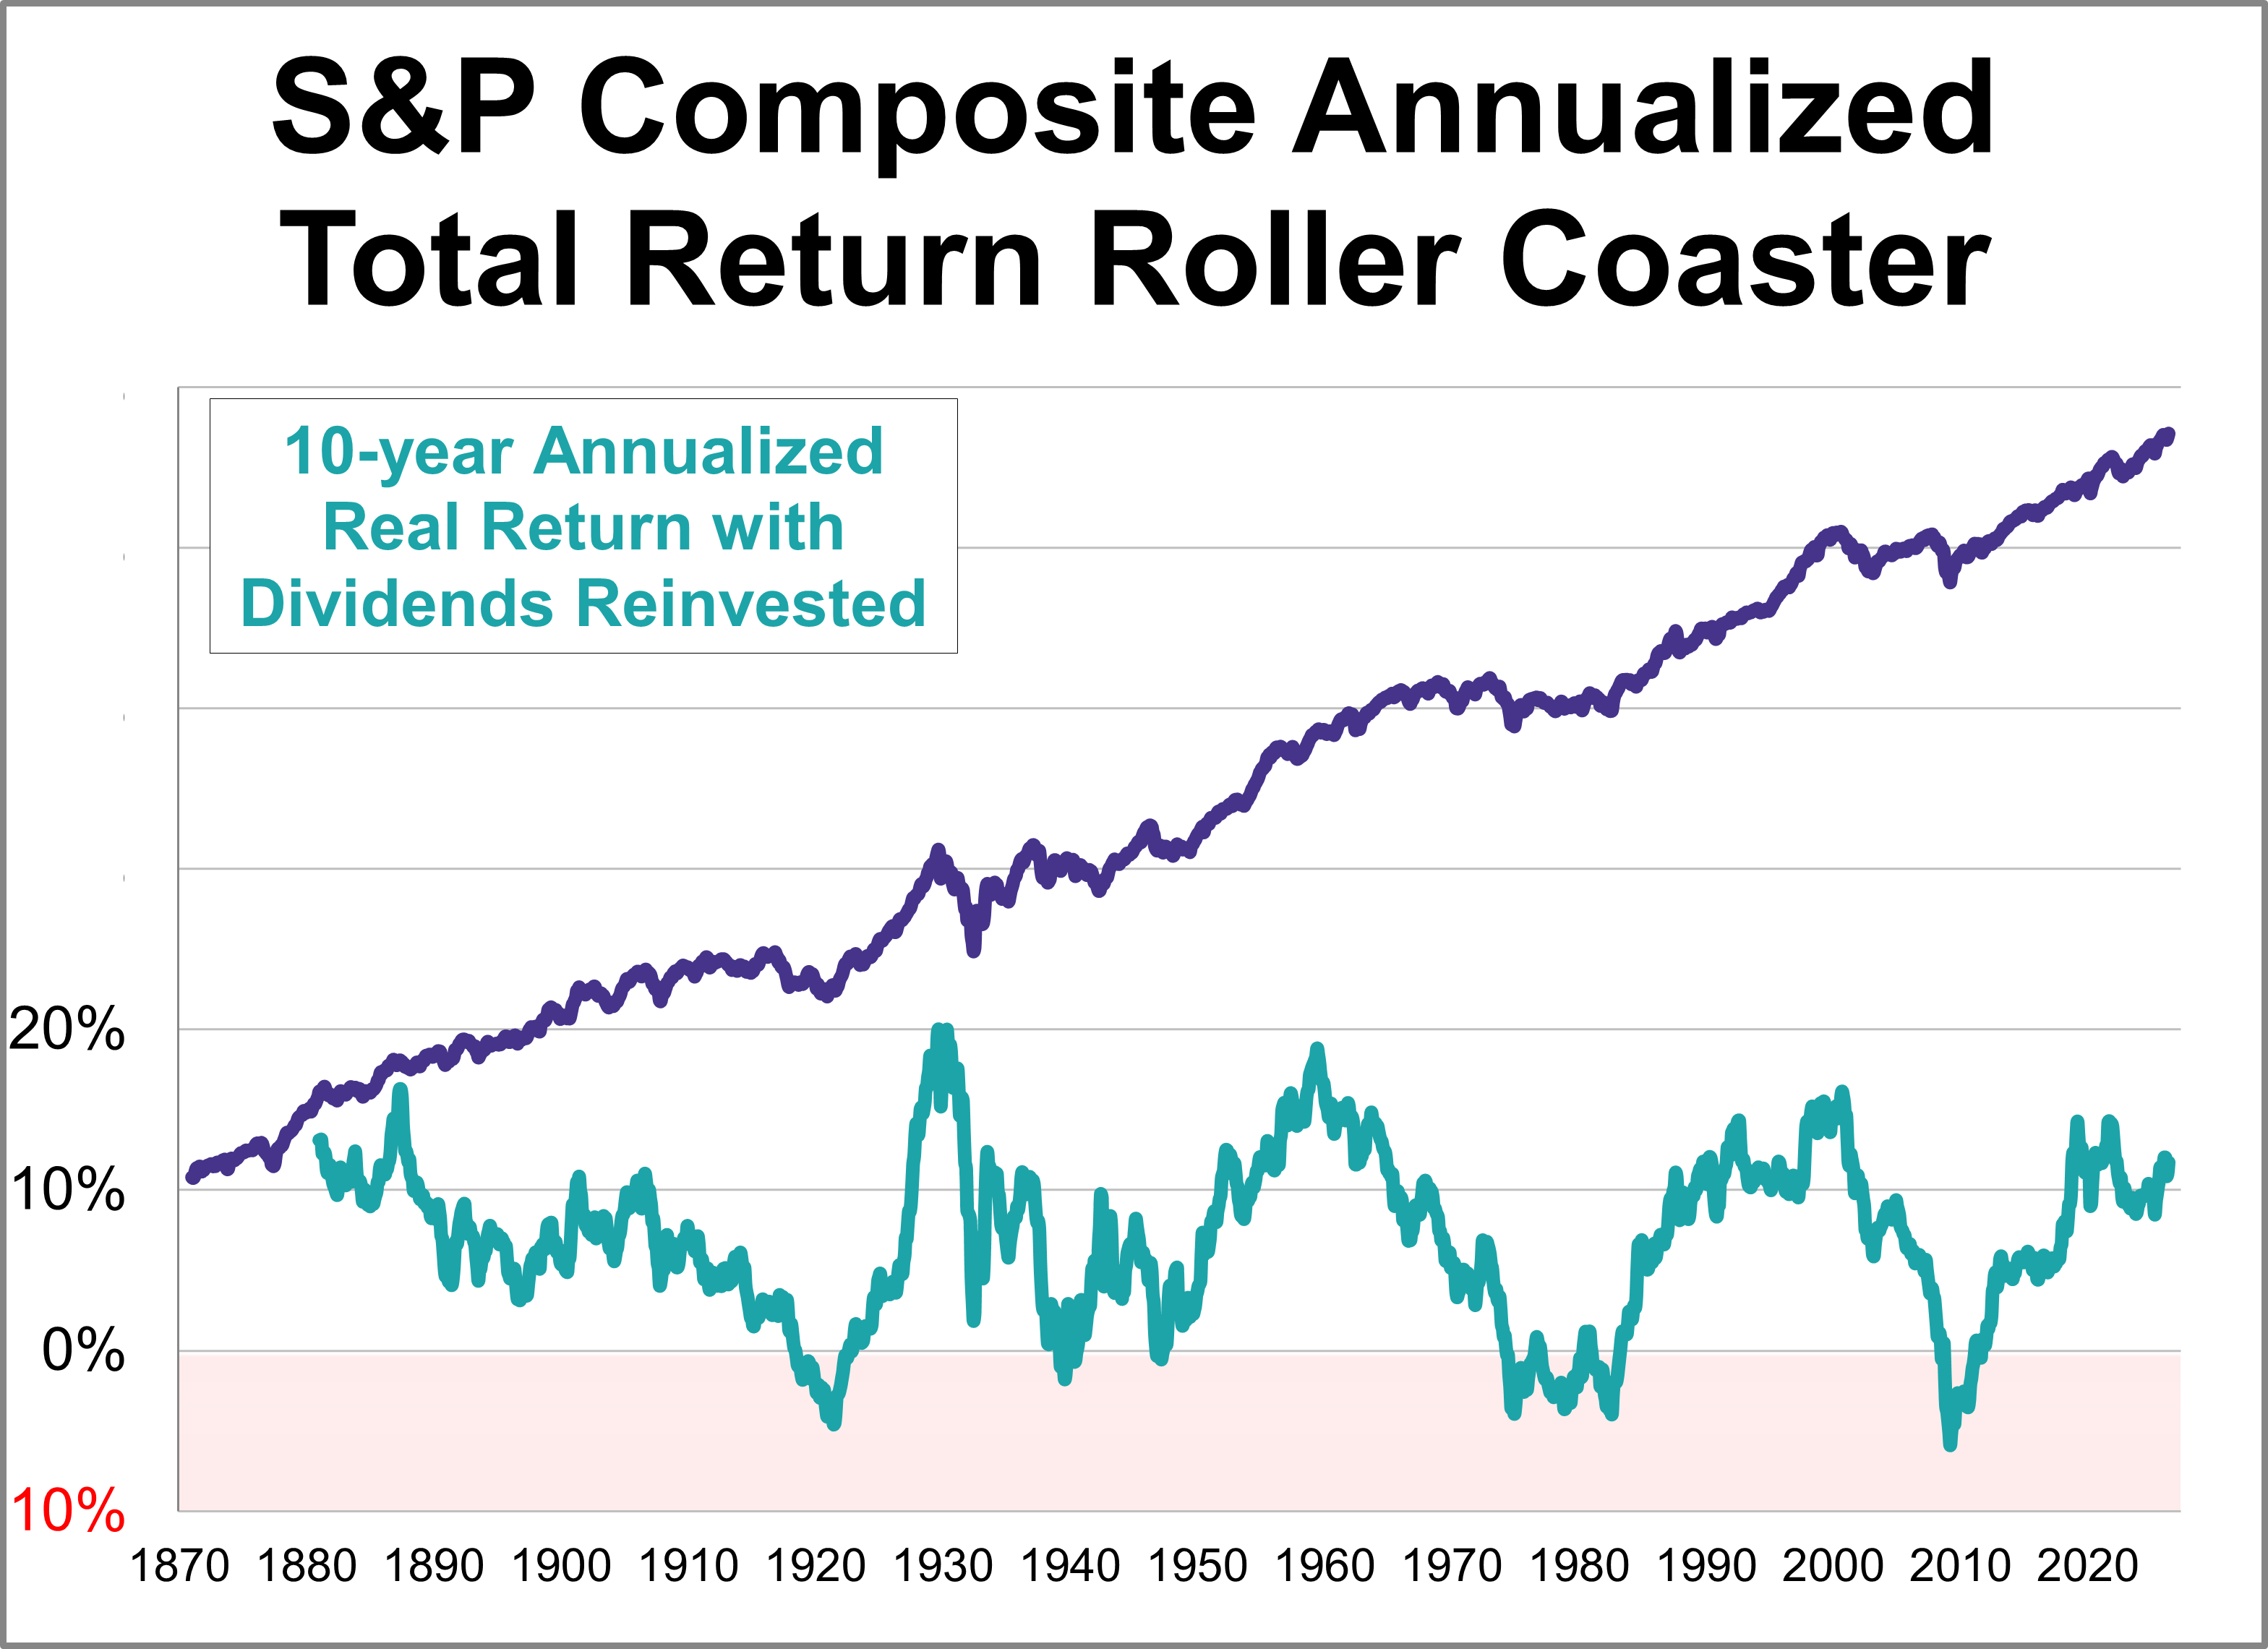
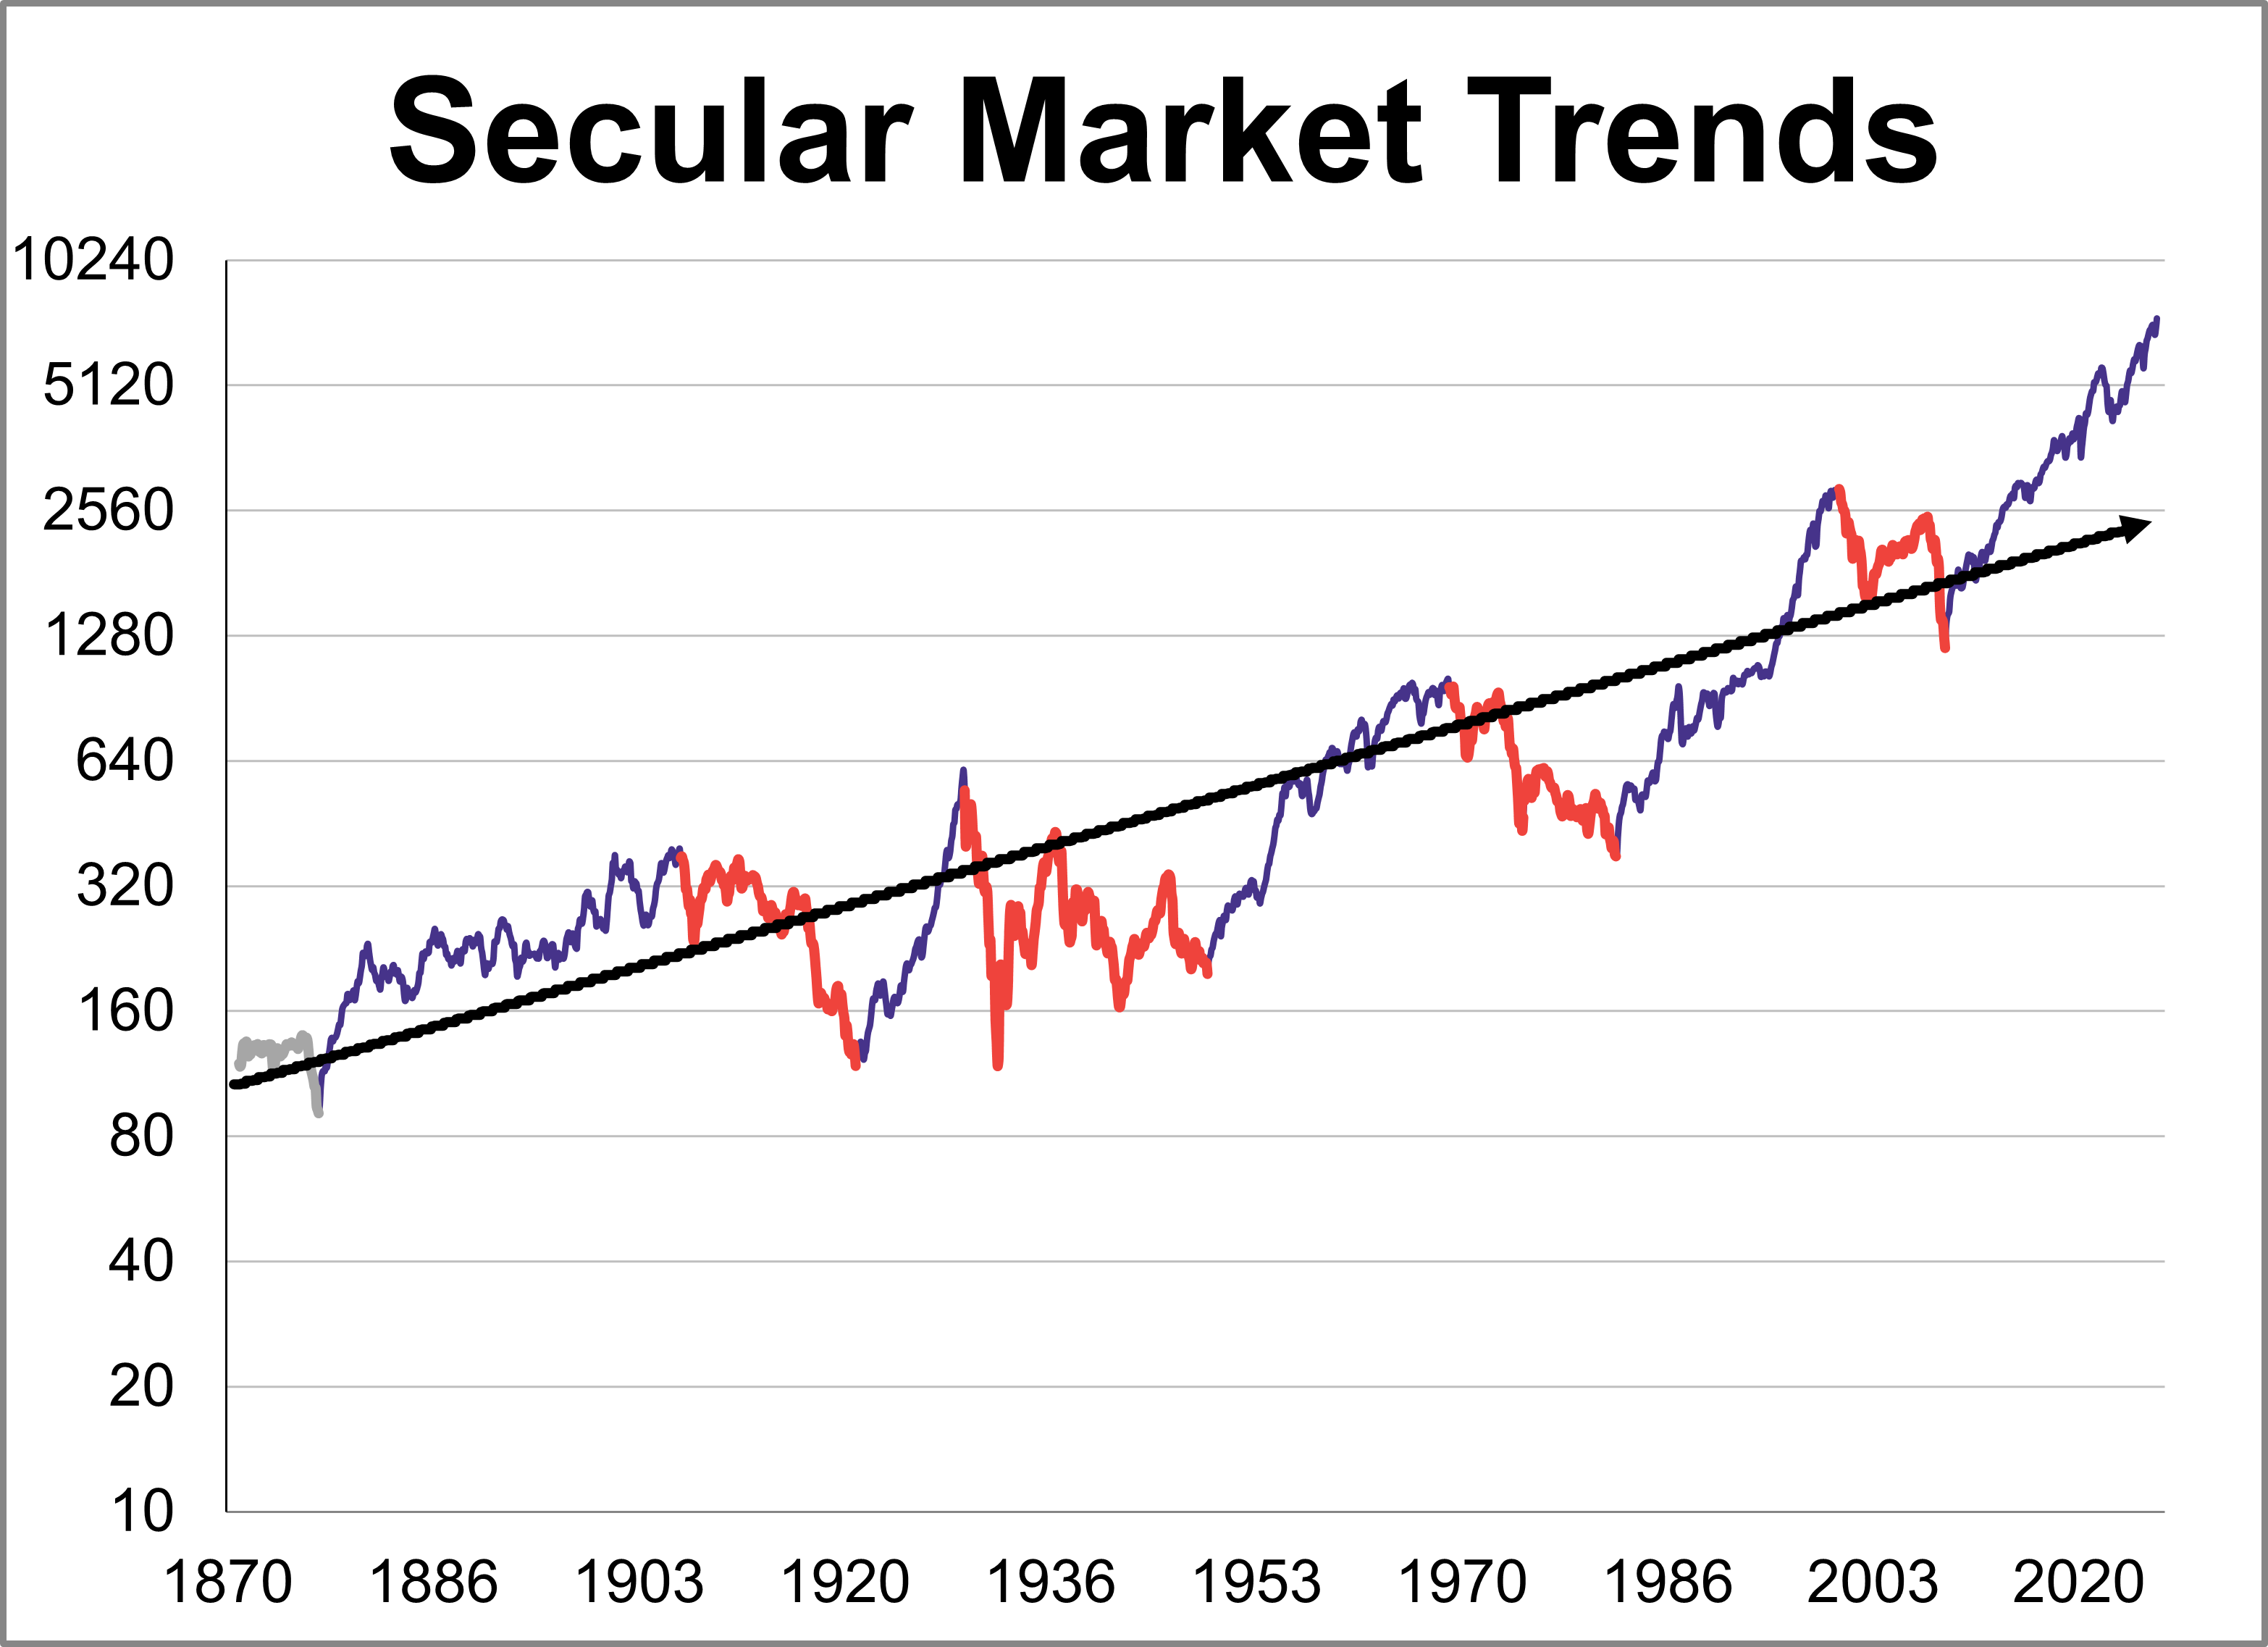
The S&P 500 real monthly averages of daily closes reached a its all-time high in May 2026. Let's examine the past to broaden our understanding of the range of historical bull and bear market trends in market performance.
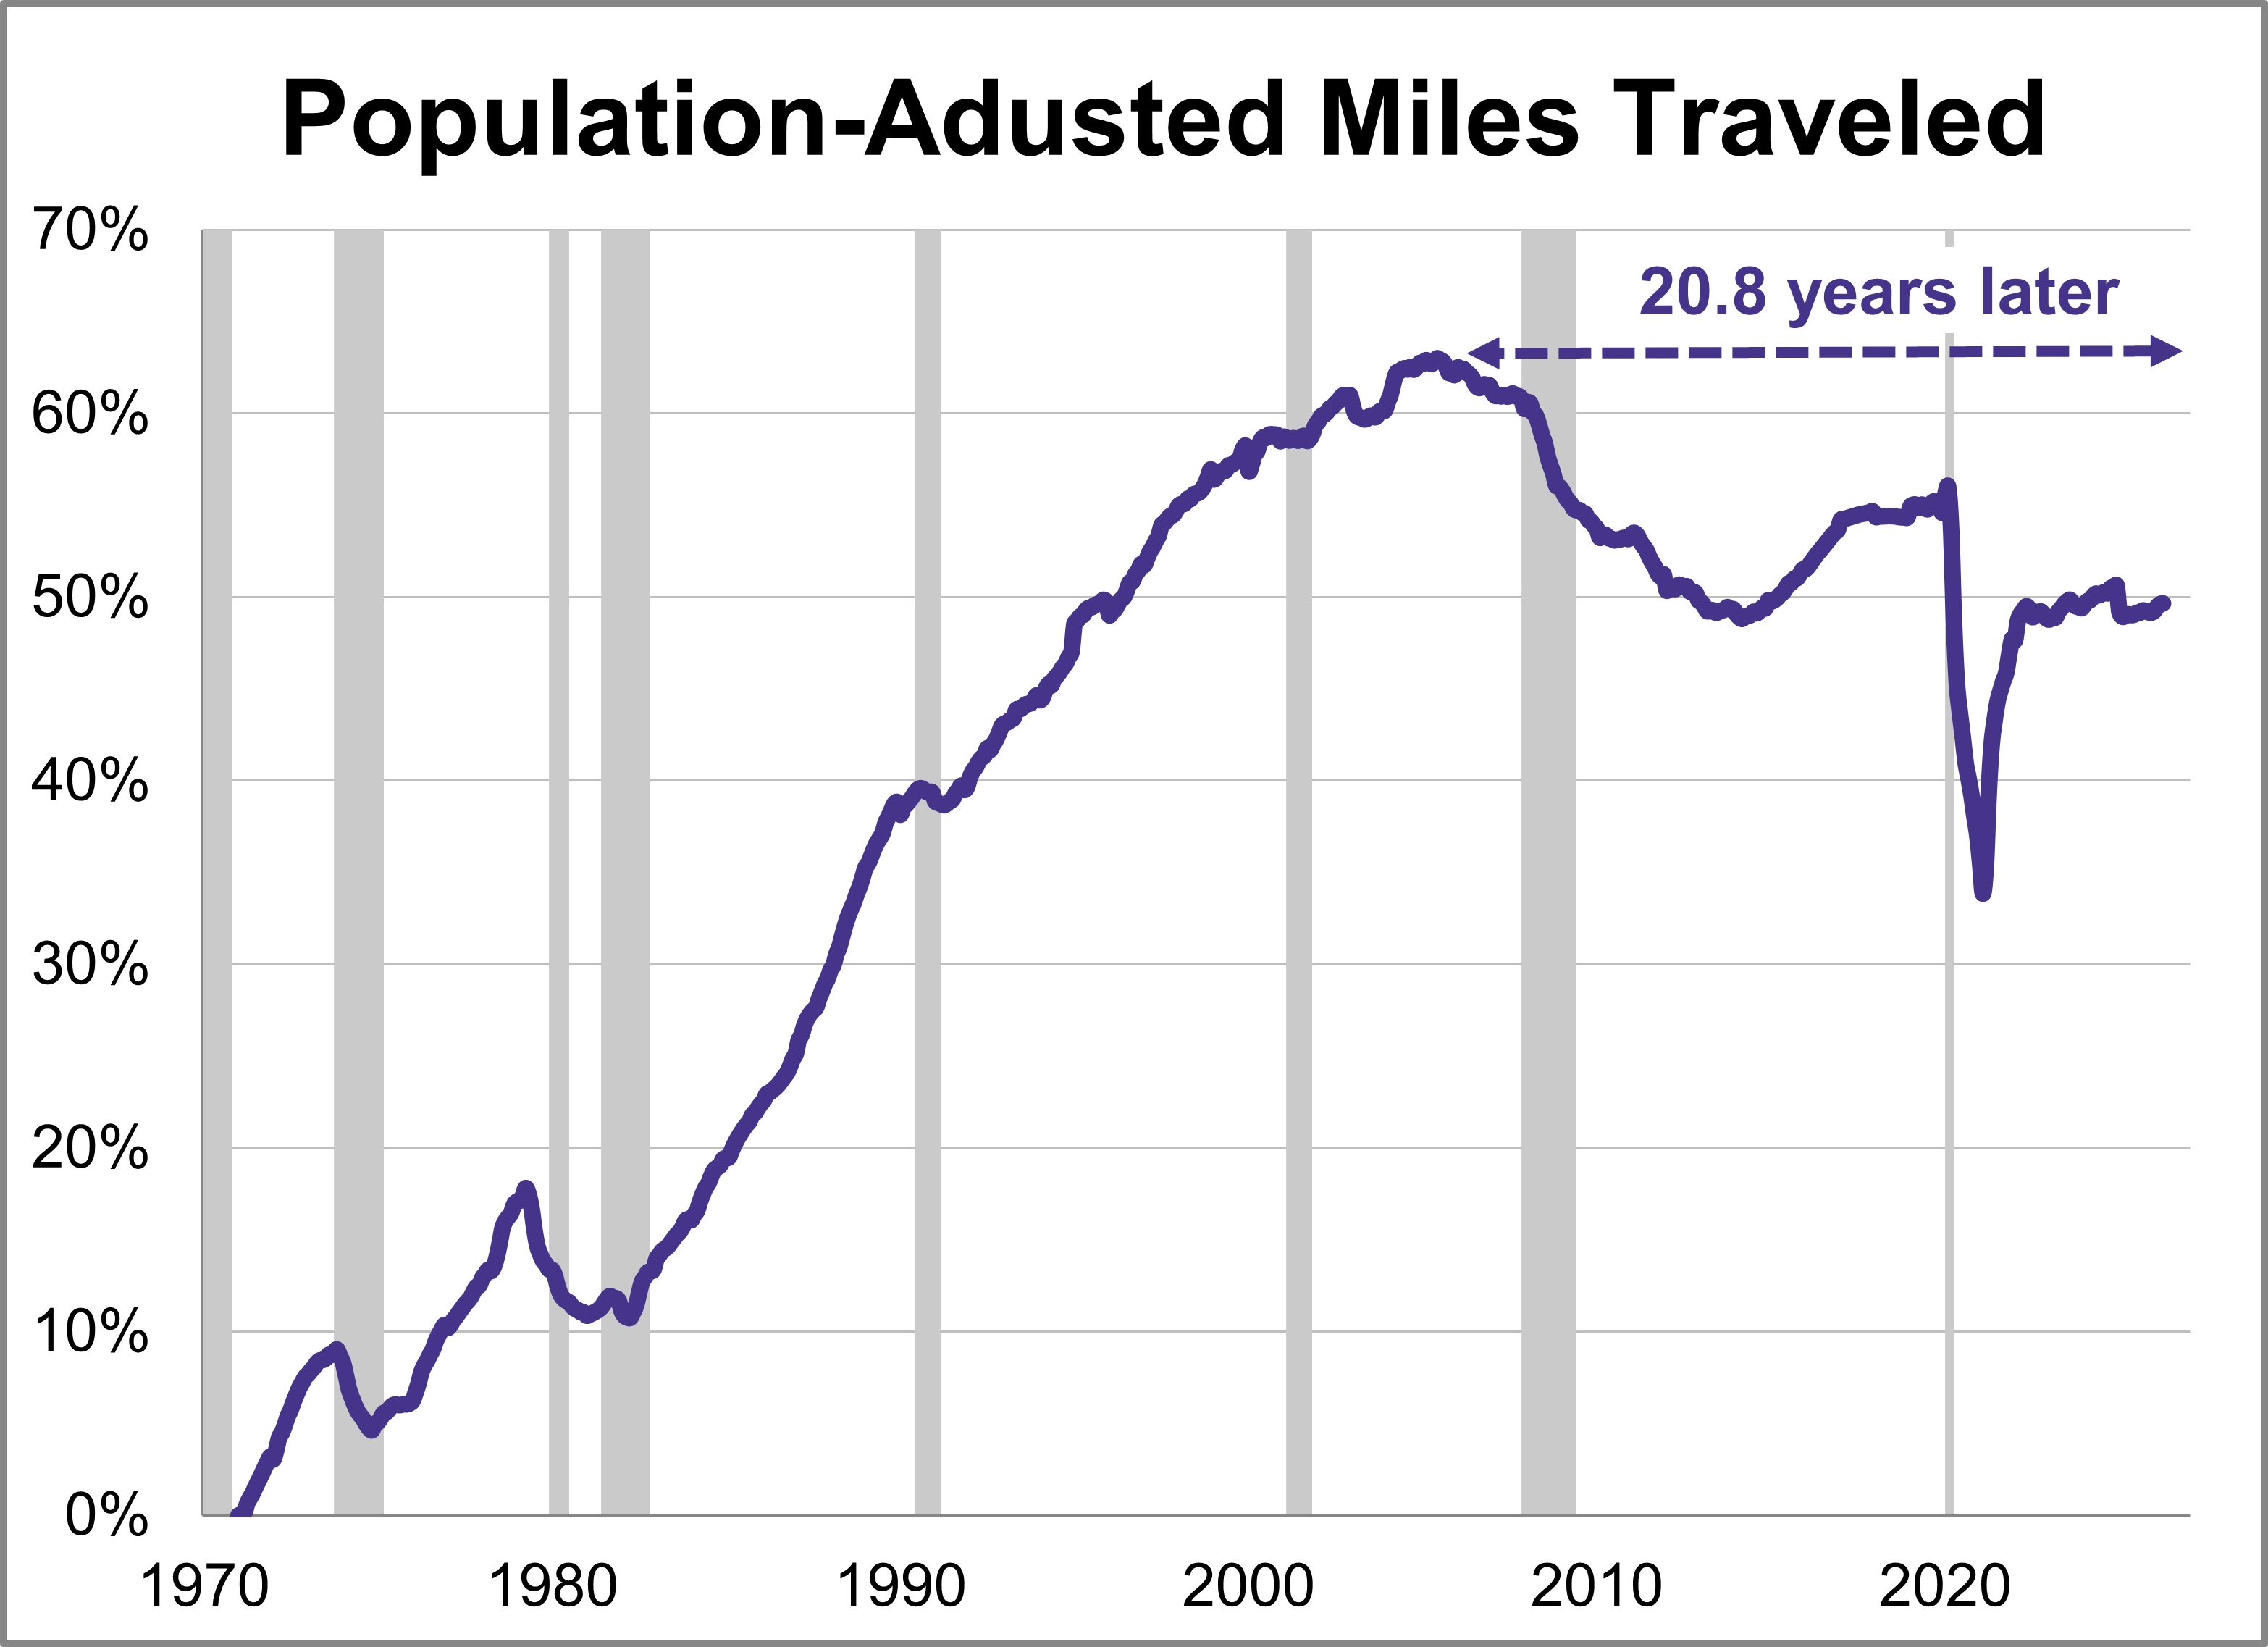
Travel on all roads and streets increased in April. The 12-month moving average was up 0.05% month-over-month and was up 1.04% year-over-year. However, if we factor in population growth, the 12-month MA of the civilian population-adjusted data (age 16-and-over) was up 0.02% month-over-month and up 0.40% year-over-year.
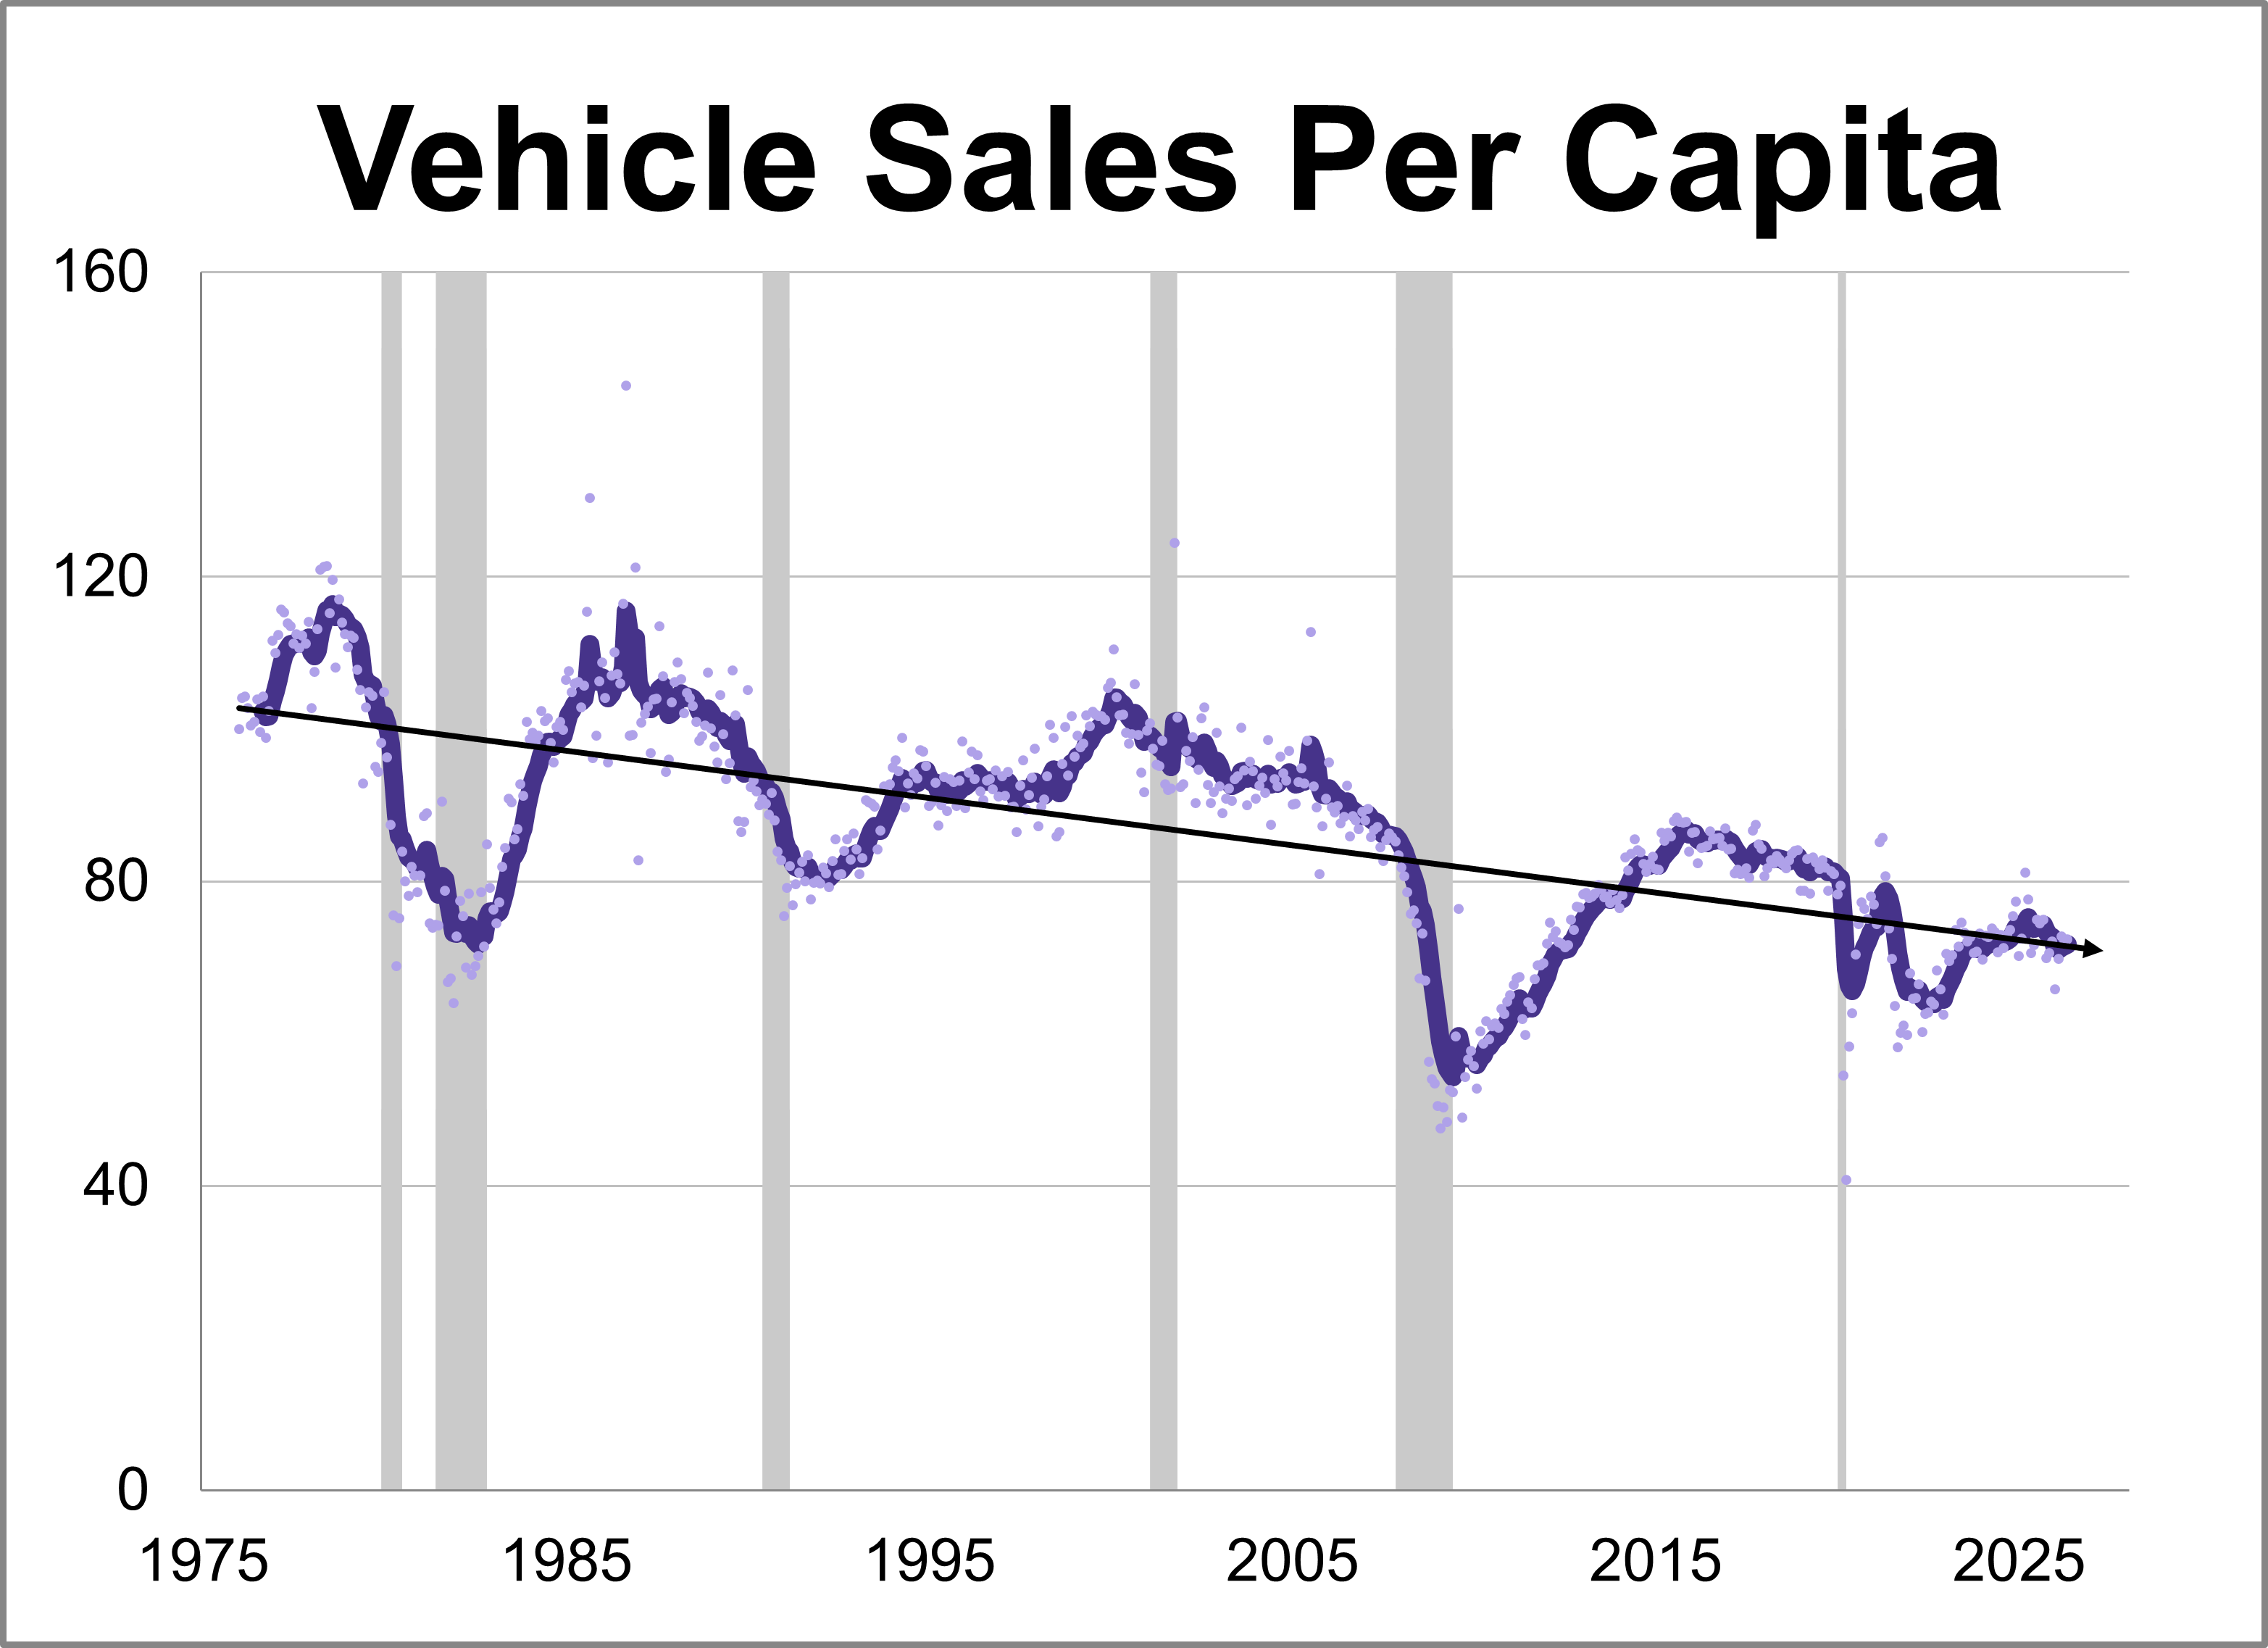
Vehicle sales inched up in May, coming in at a seasonally adjusted annual rate of 16.083 million units. This represents a 0.4% increase from the previous month and a 3.2% rise from one year ago.
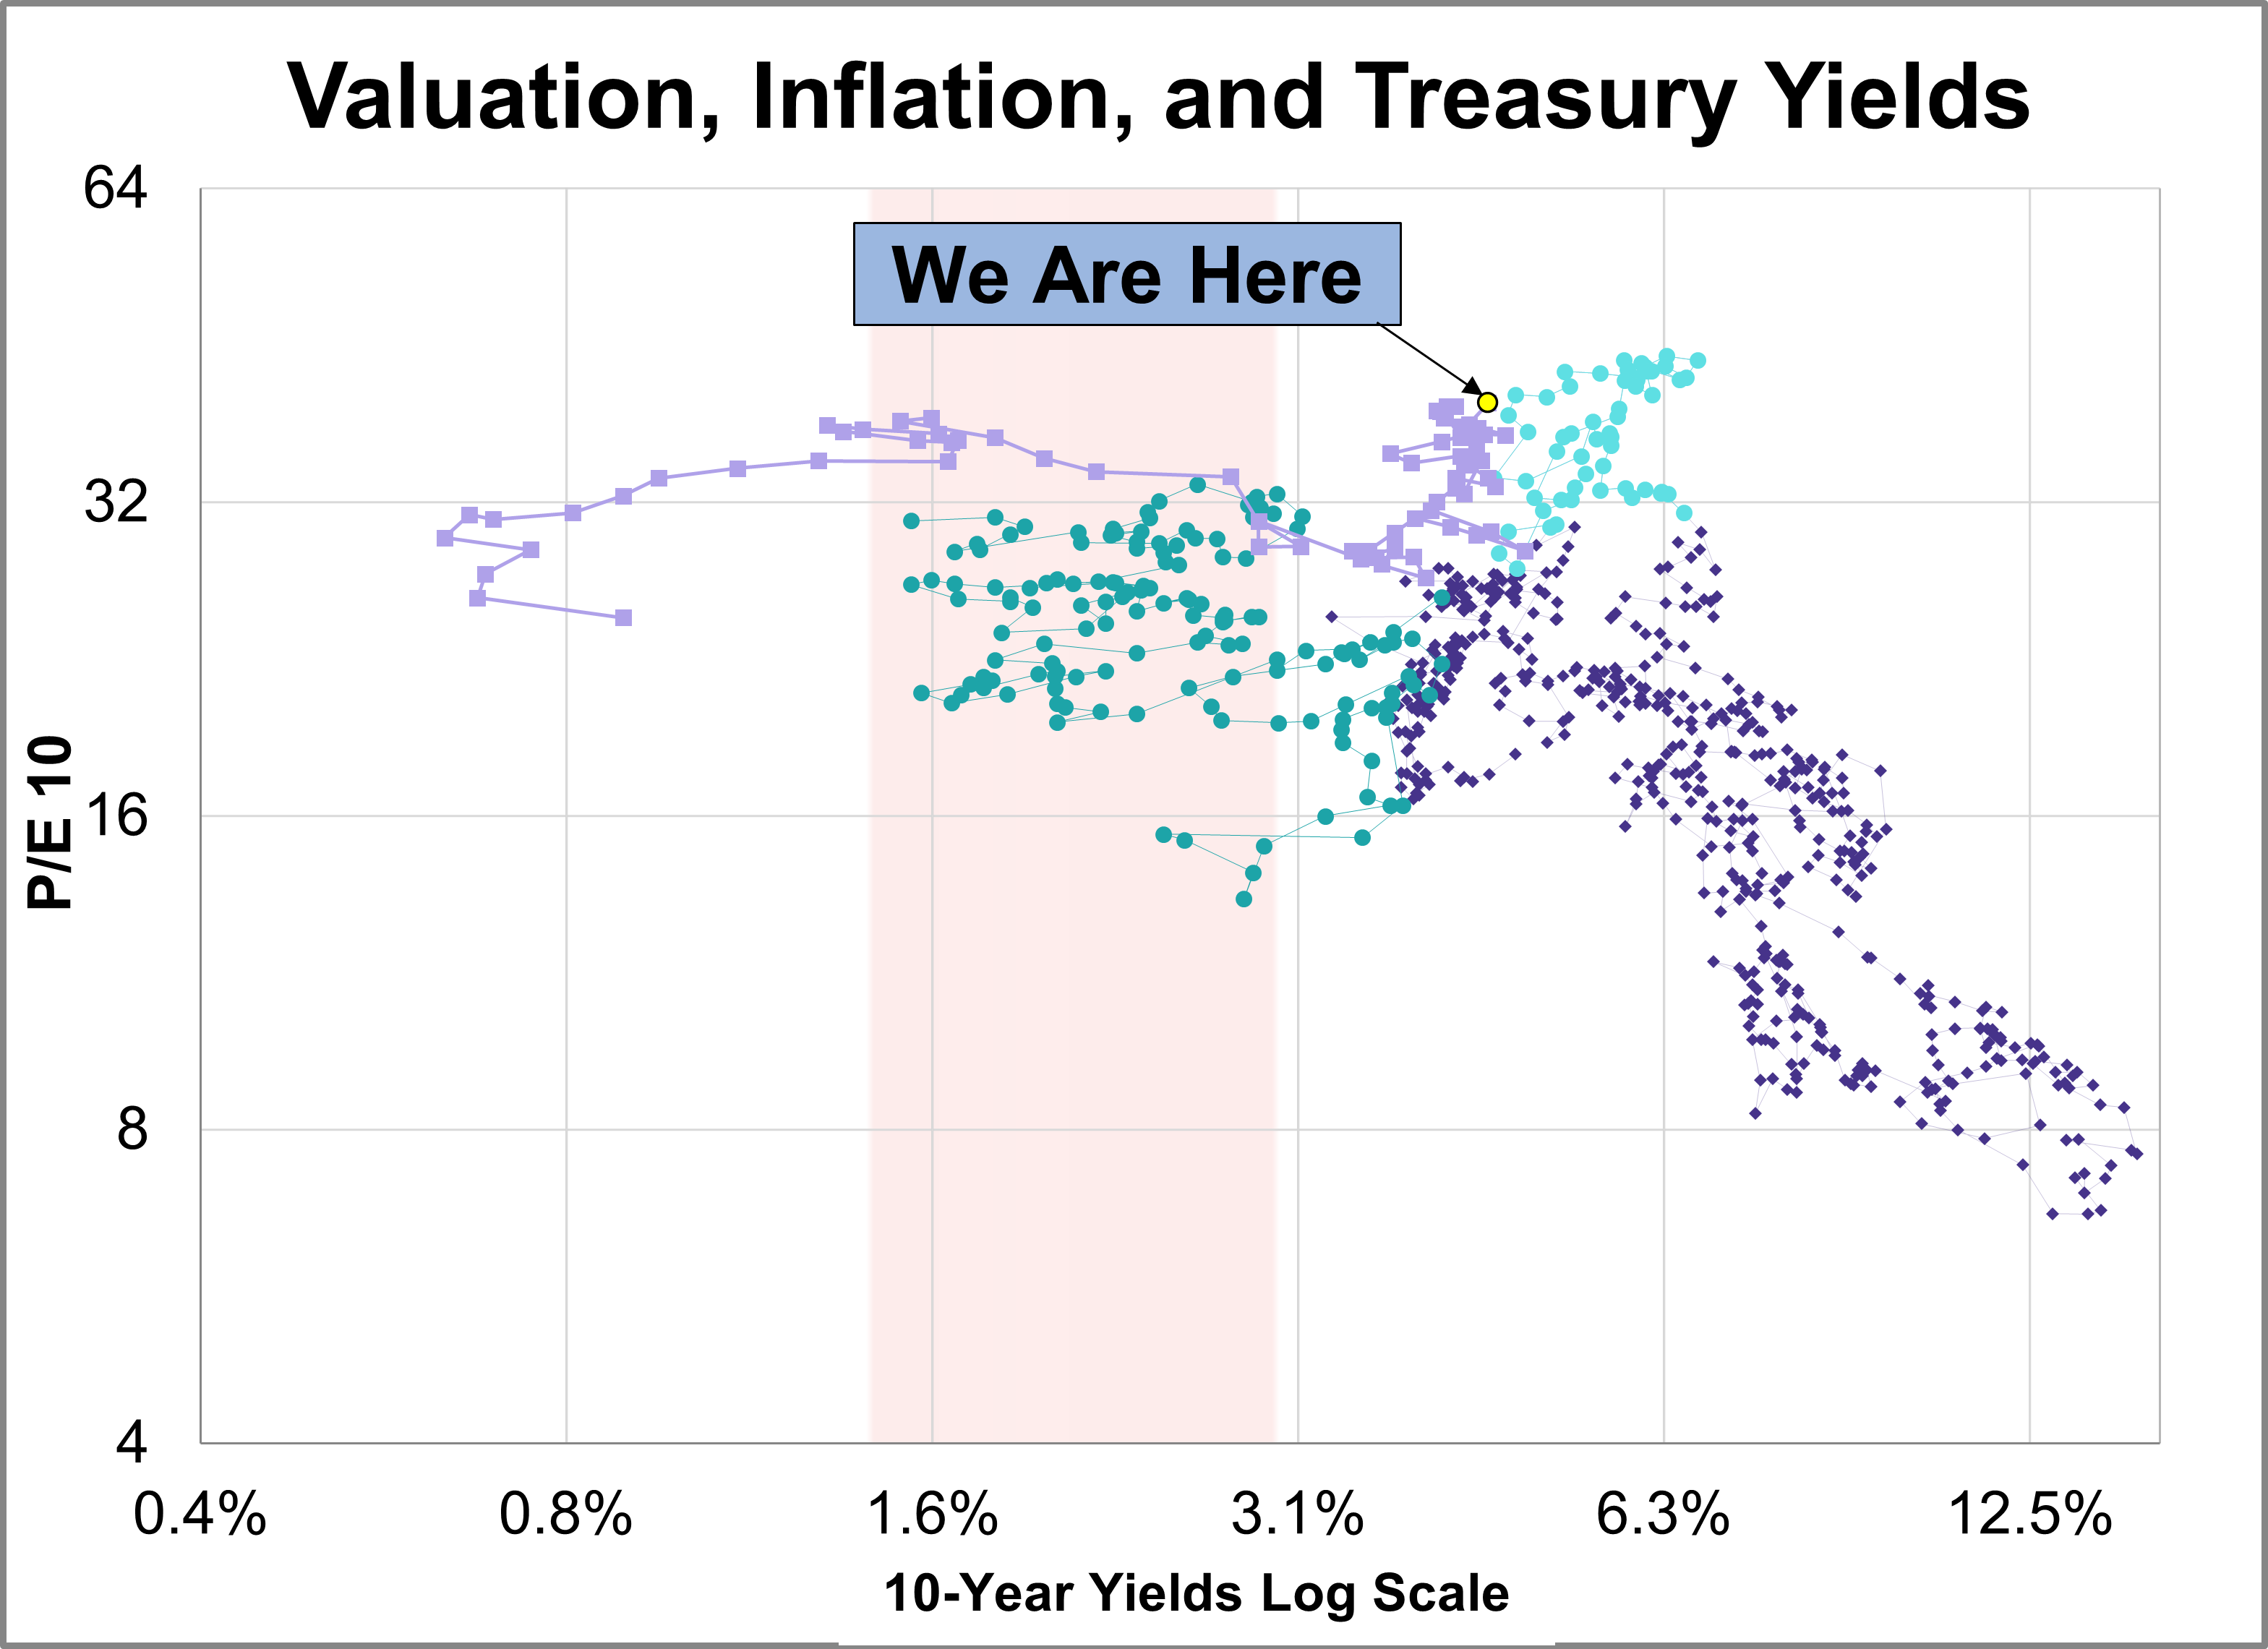
Our monthly market valuation updates have long had the same conclusion: US stock indexes are significantly overvalued, which suggests cautious expectations for investment returns. This analysis focuses on the P/E10 ratio, key indicator of market valuation, and its correlation with inflation and the 10-year Treasury yield.
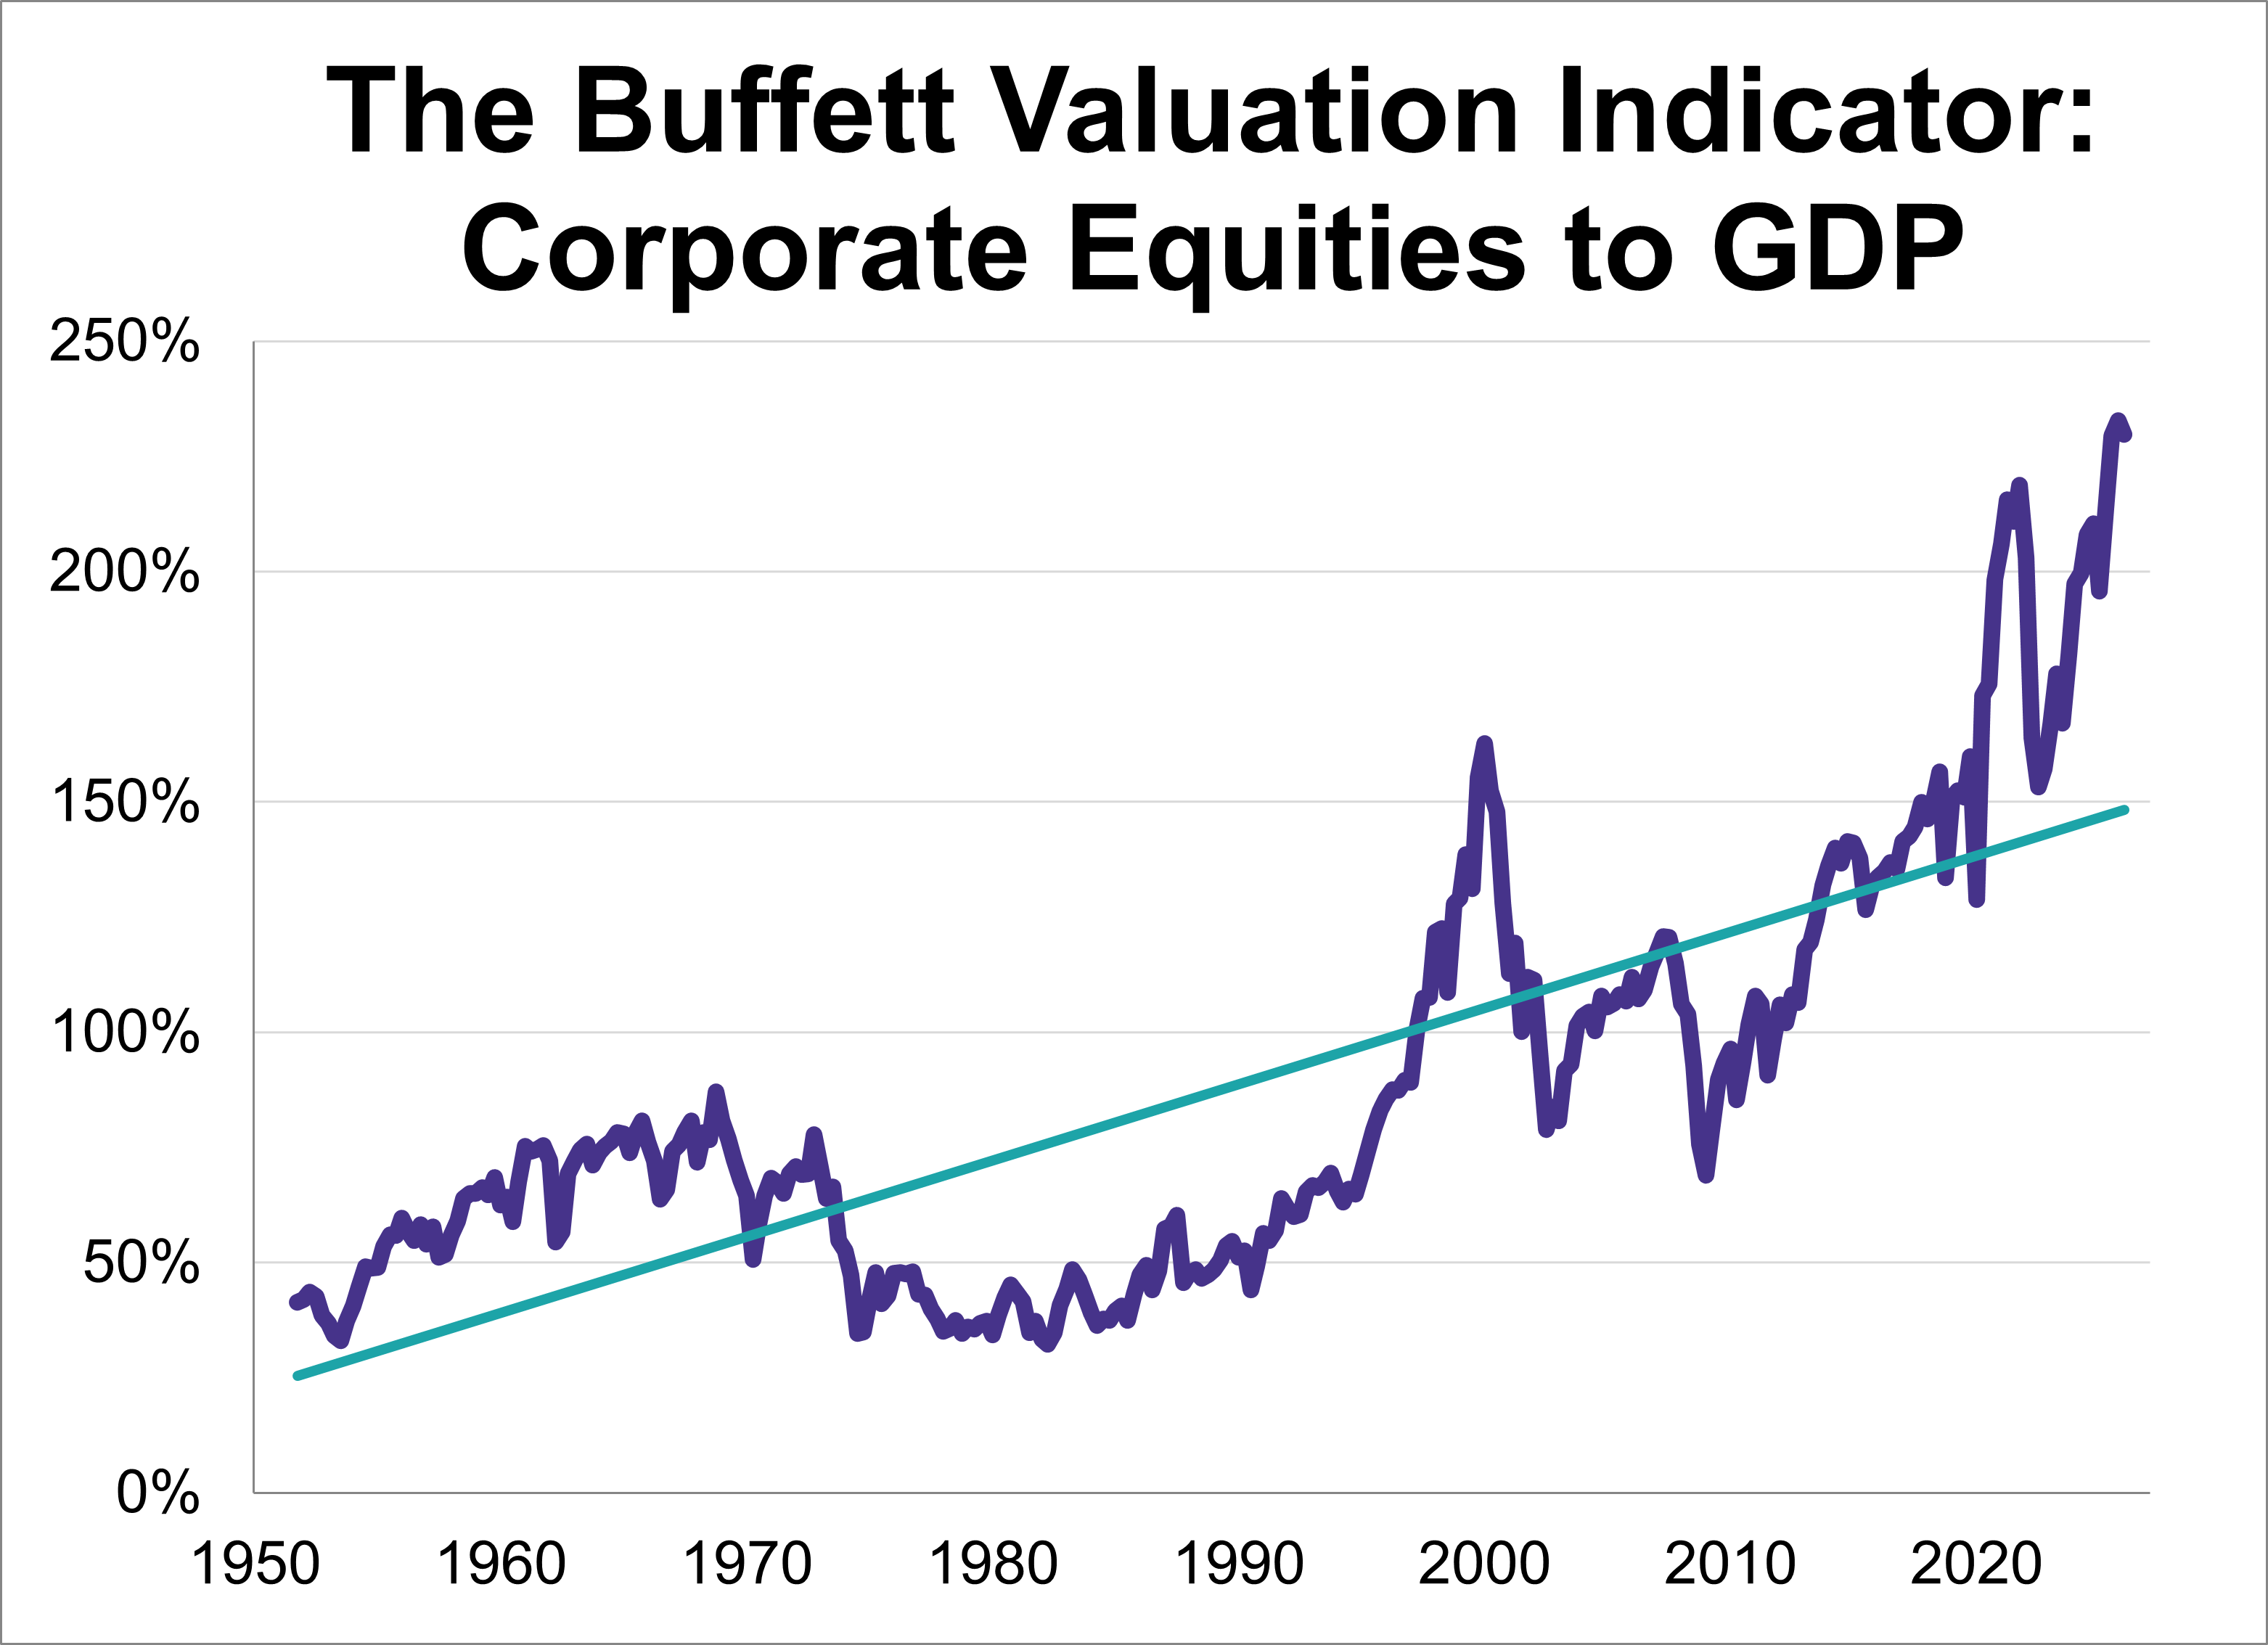
Following the Q1 GDP second estimate, the 'Buffett Indicator'—the ratio of corporate equities to GDP—now stands at 229.7%. This marks the second-highest reading in history, eclipsed only by the previous quarter.
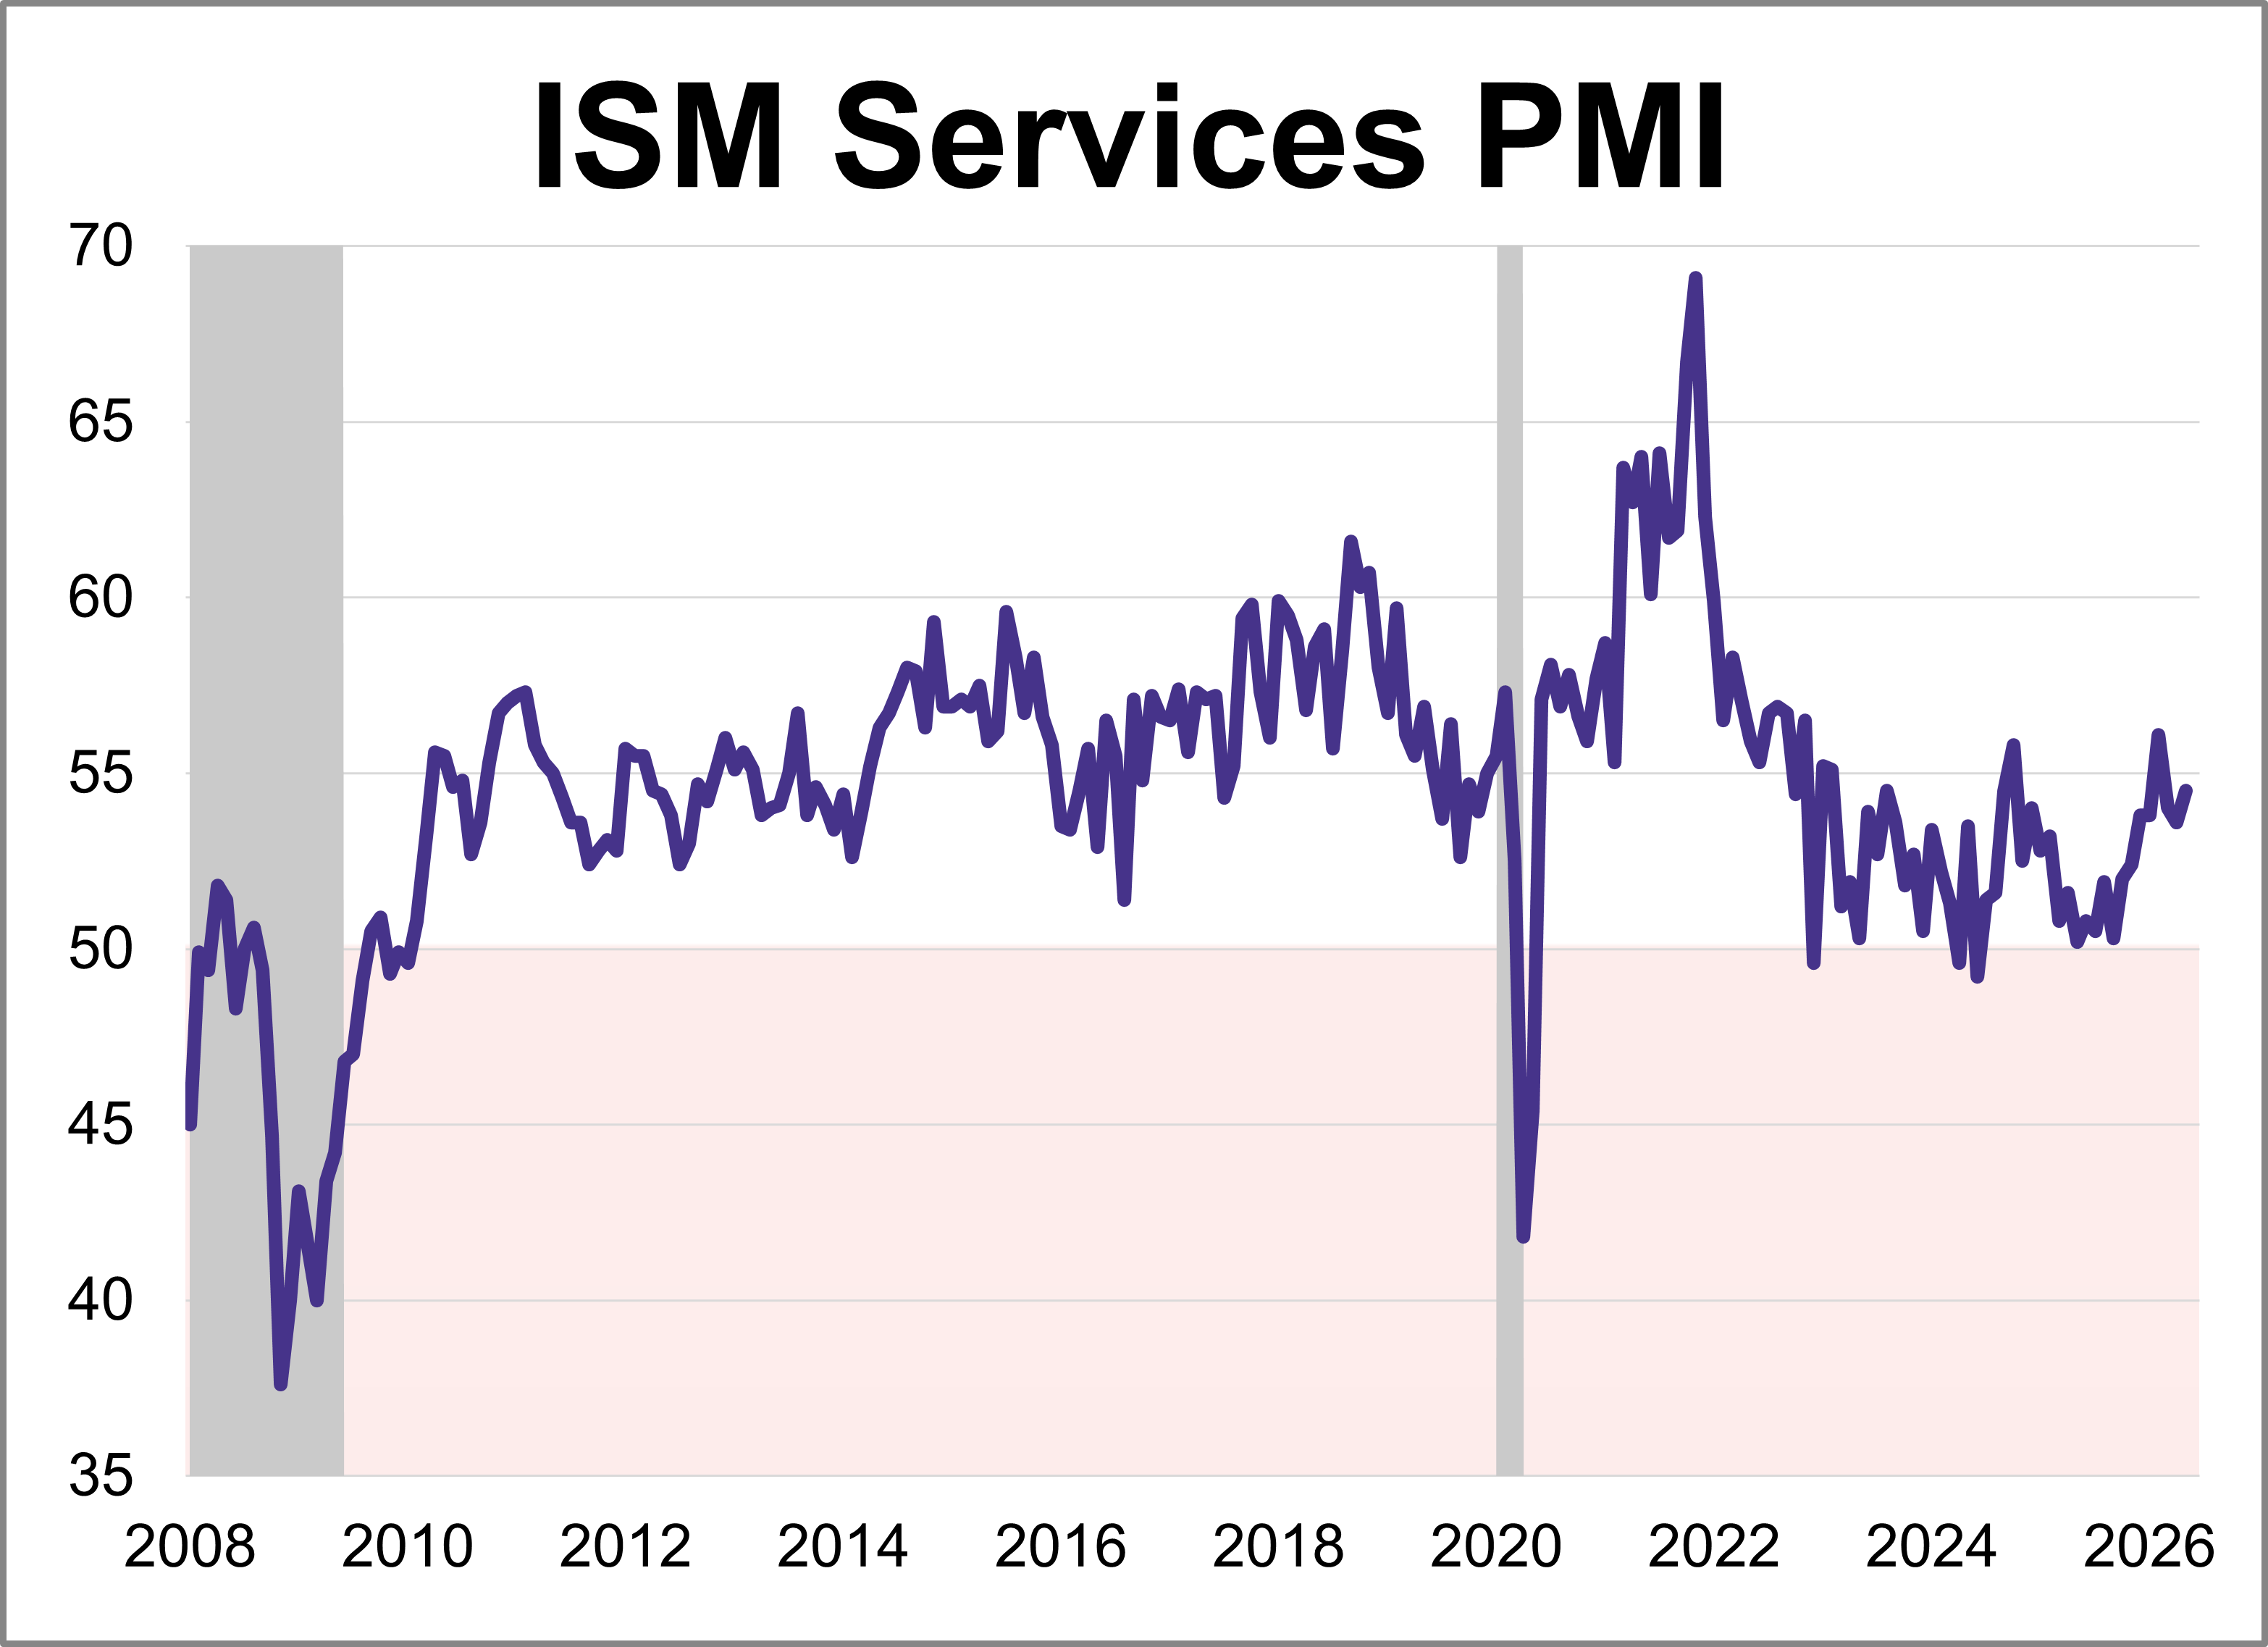
The Institute for Supply Management (ISM) released its May Services Purchasing Managers' Index (PMI), with the headline composite index at 54.5. This was higher than the forecast of 53.7 and keeps the index in expansion territory for a 23rd consecutive month.
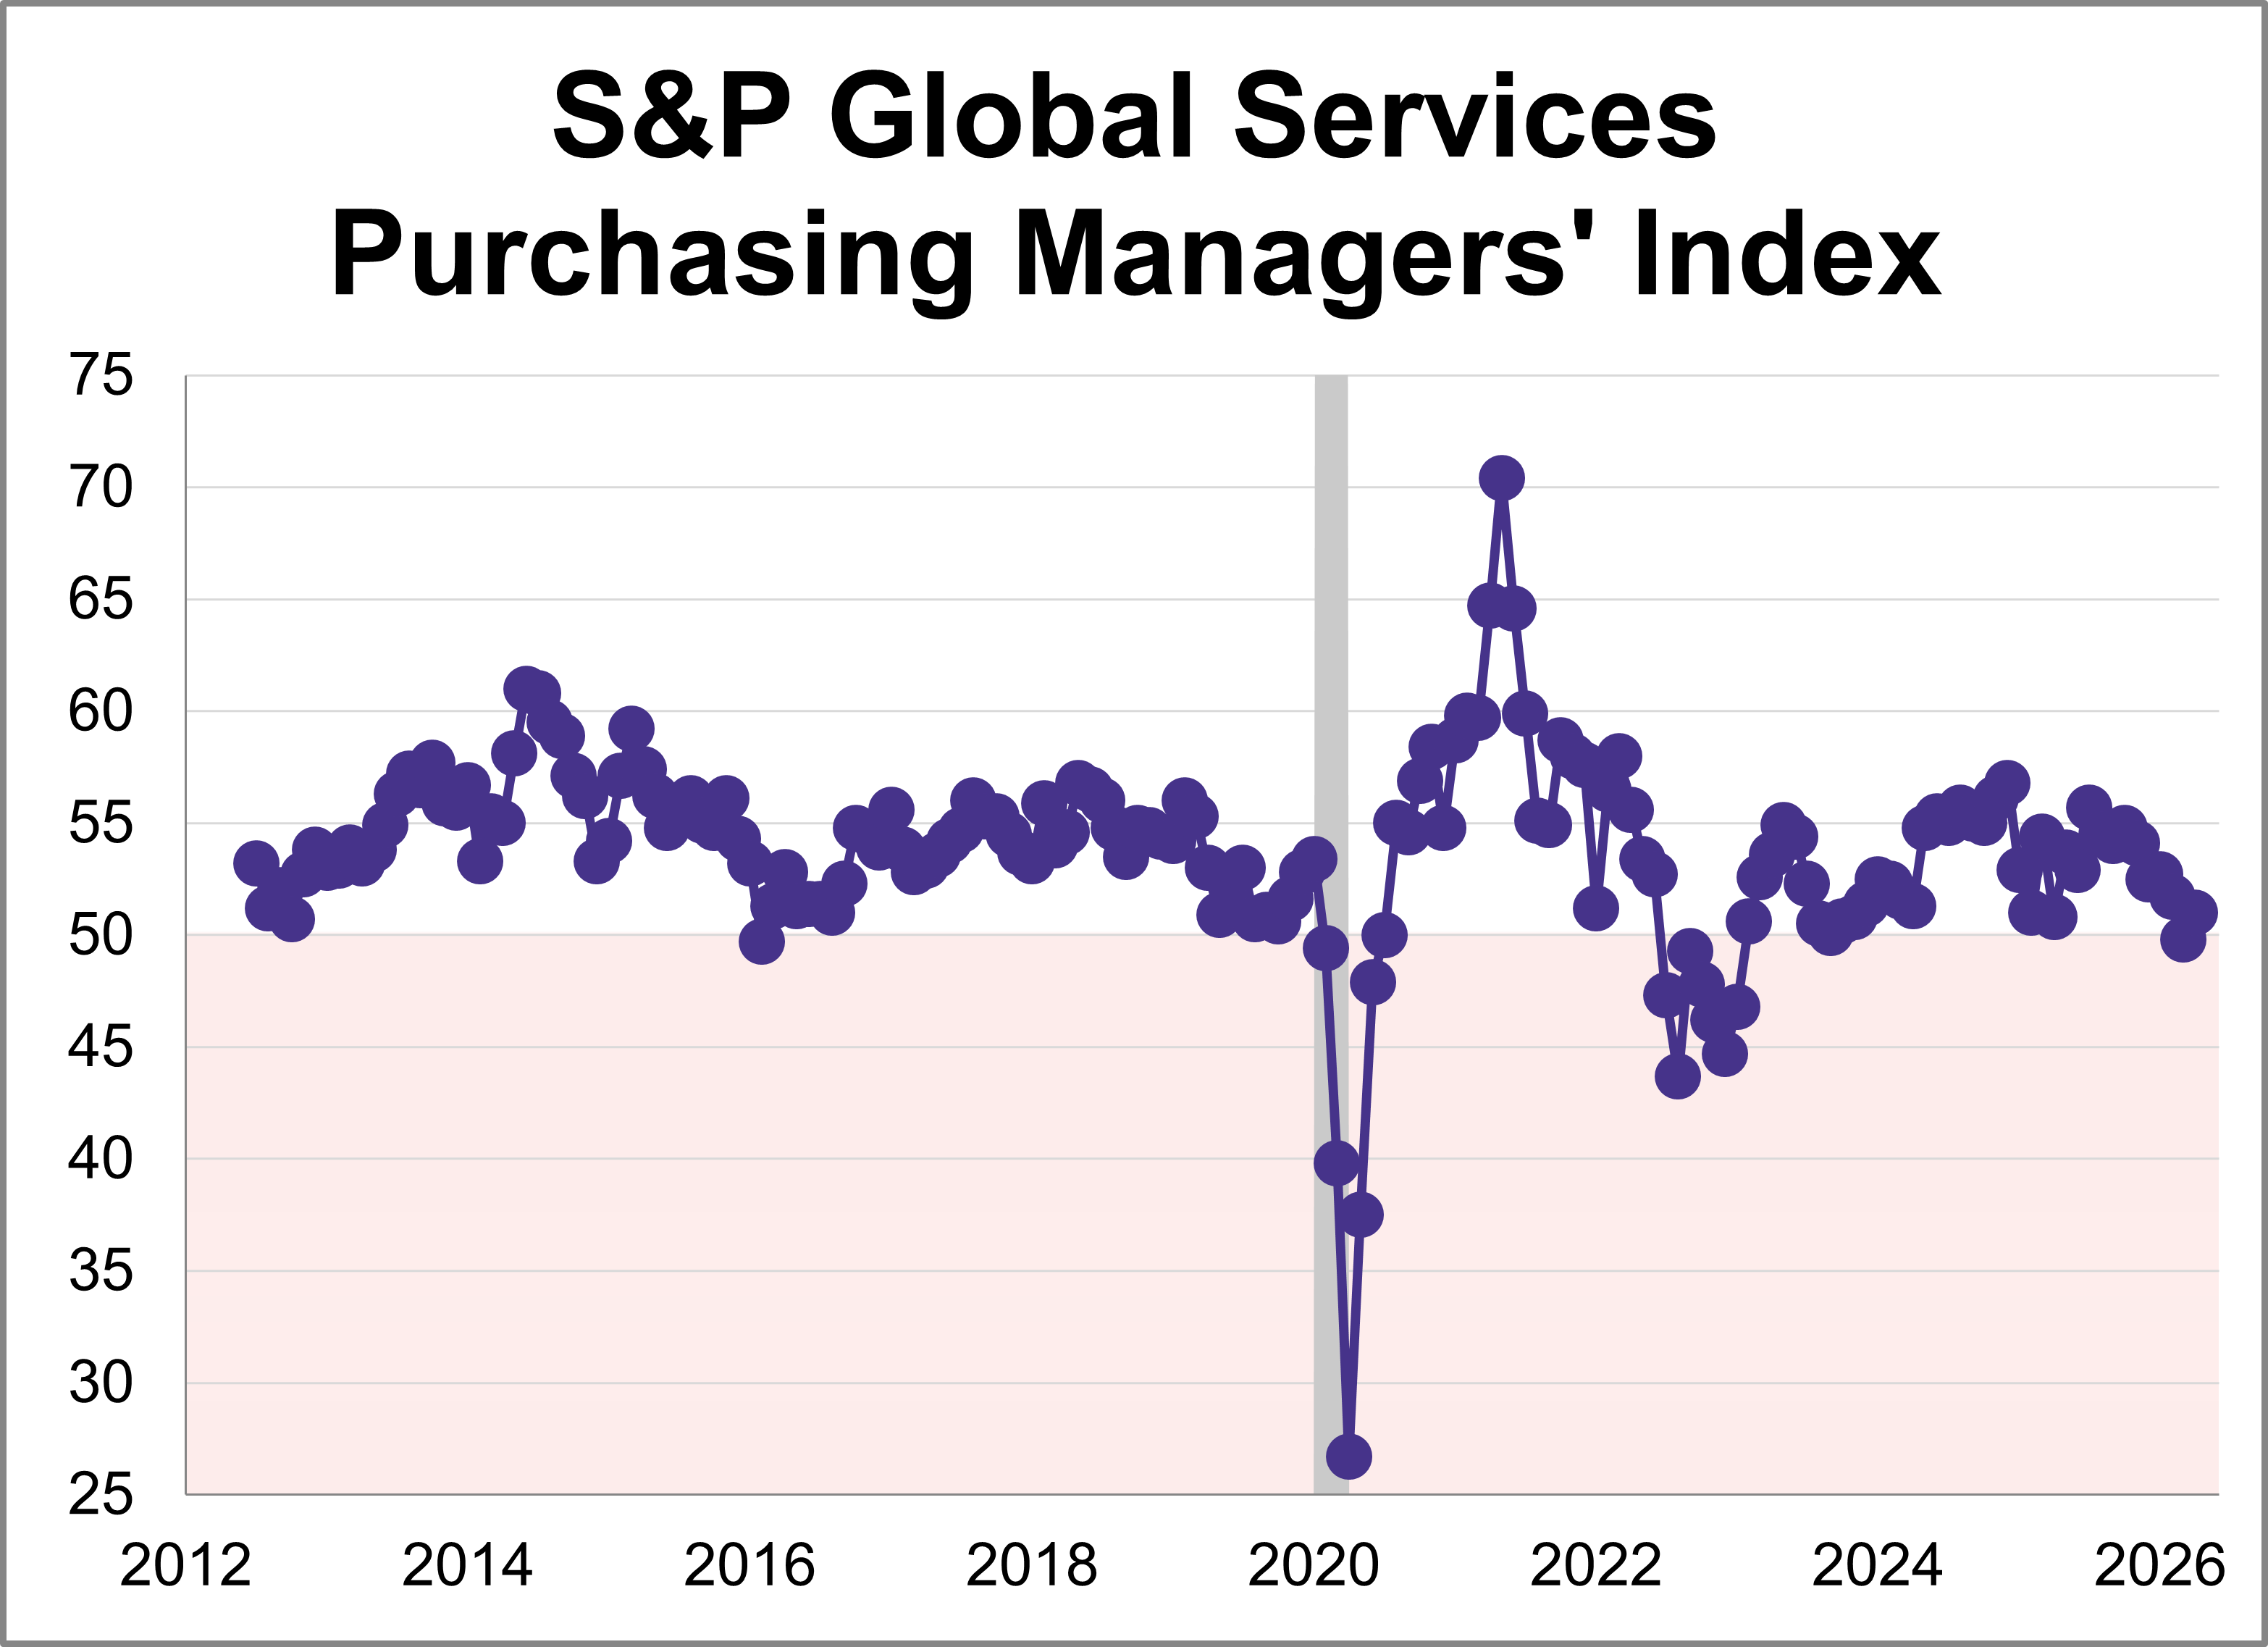
The May U.S. Services Purchasing Managers' Index (PMI) from S&P Global inched down 0.3 points to 50.7, indicating slower expansion in the services sector. The latest reading was lower than the forecast of 50.9 and was among the weakest months of expansion in the past 2.5 years.
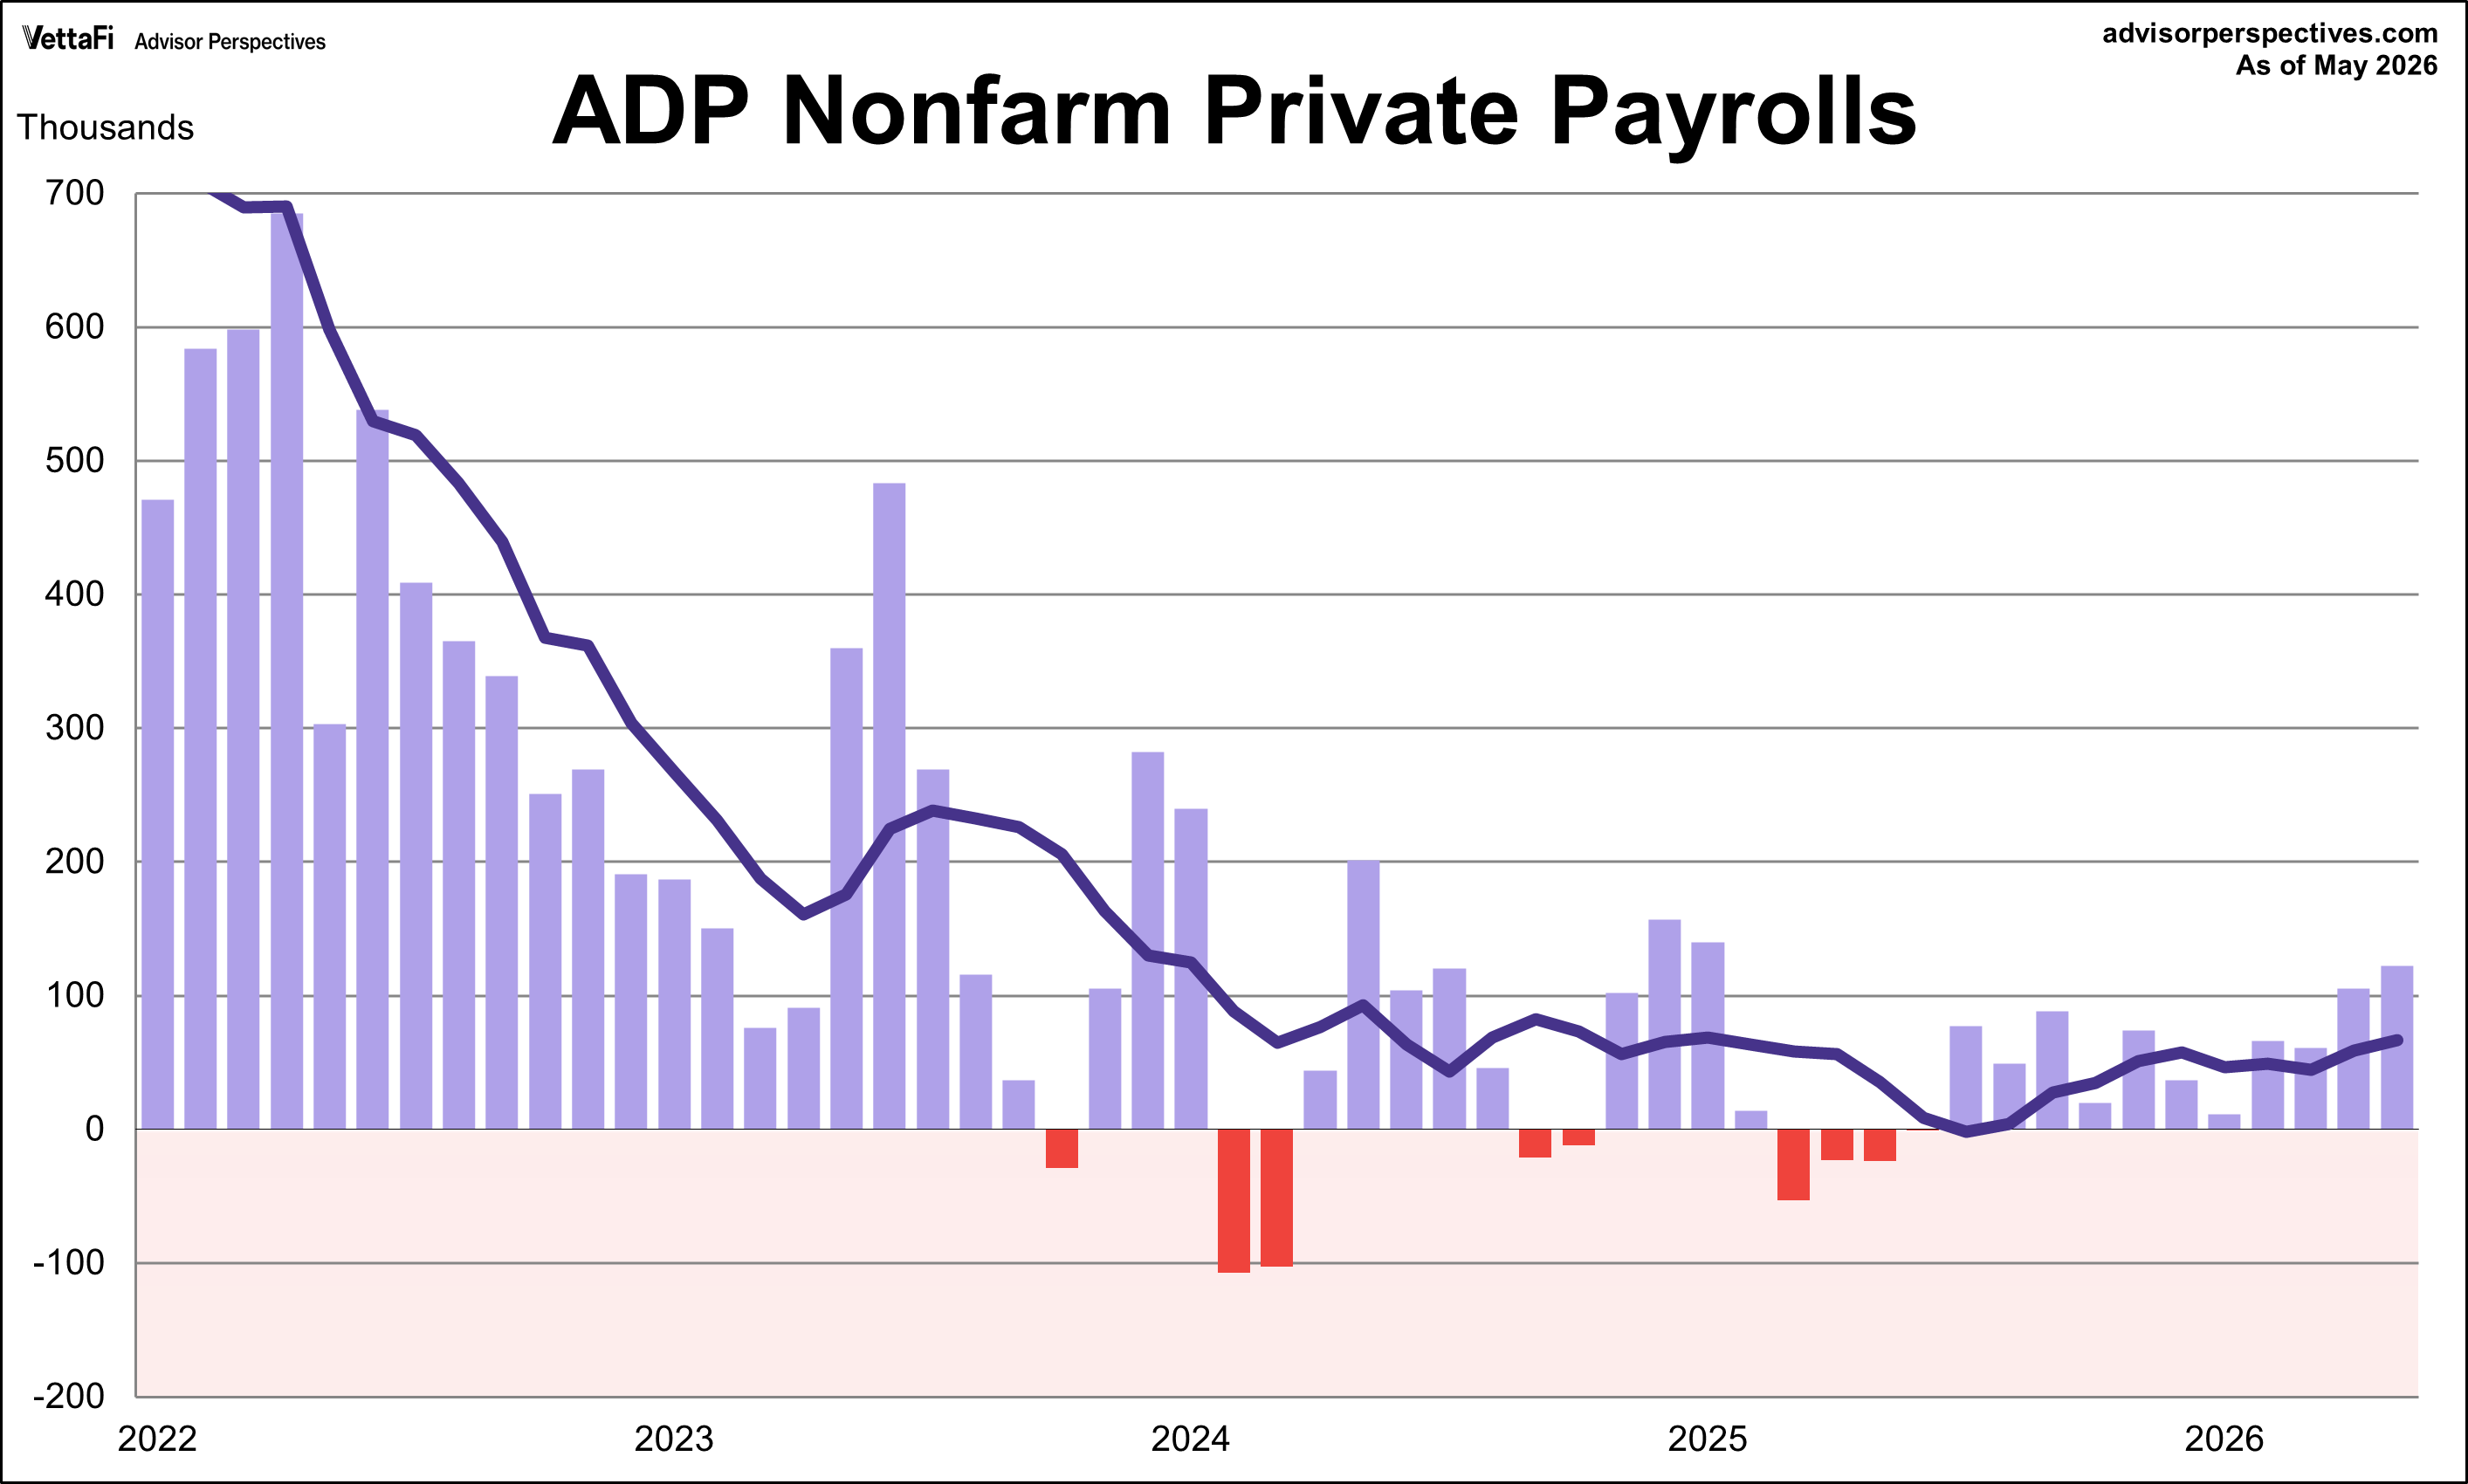
The ADP employment report revealed that 122,000 nonfarm private jobs were added in May, the largest monthly growth since January 2025. The latest figure was just above the projected 118,000 addition.
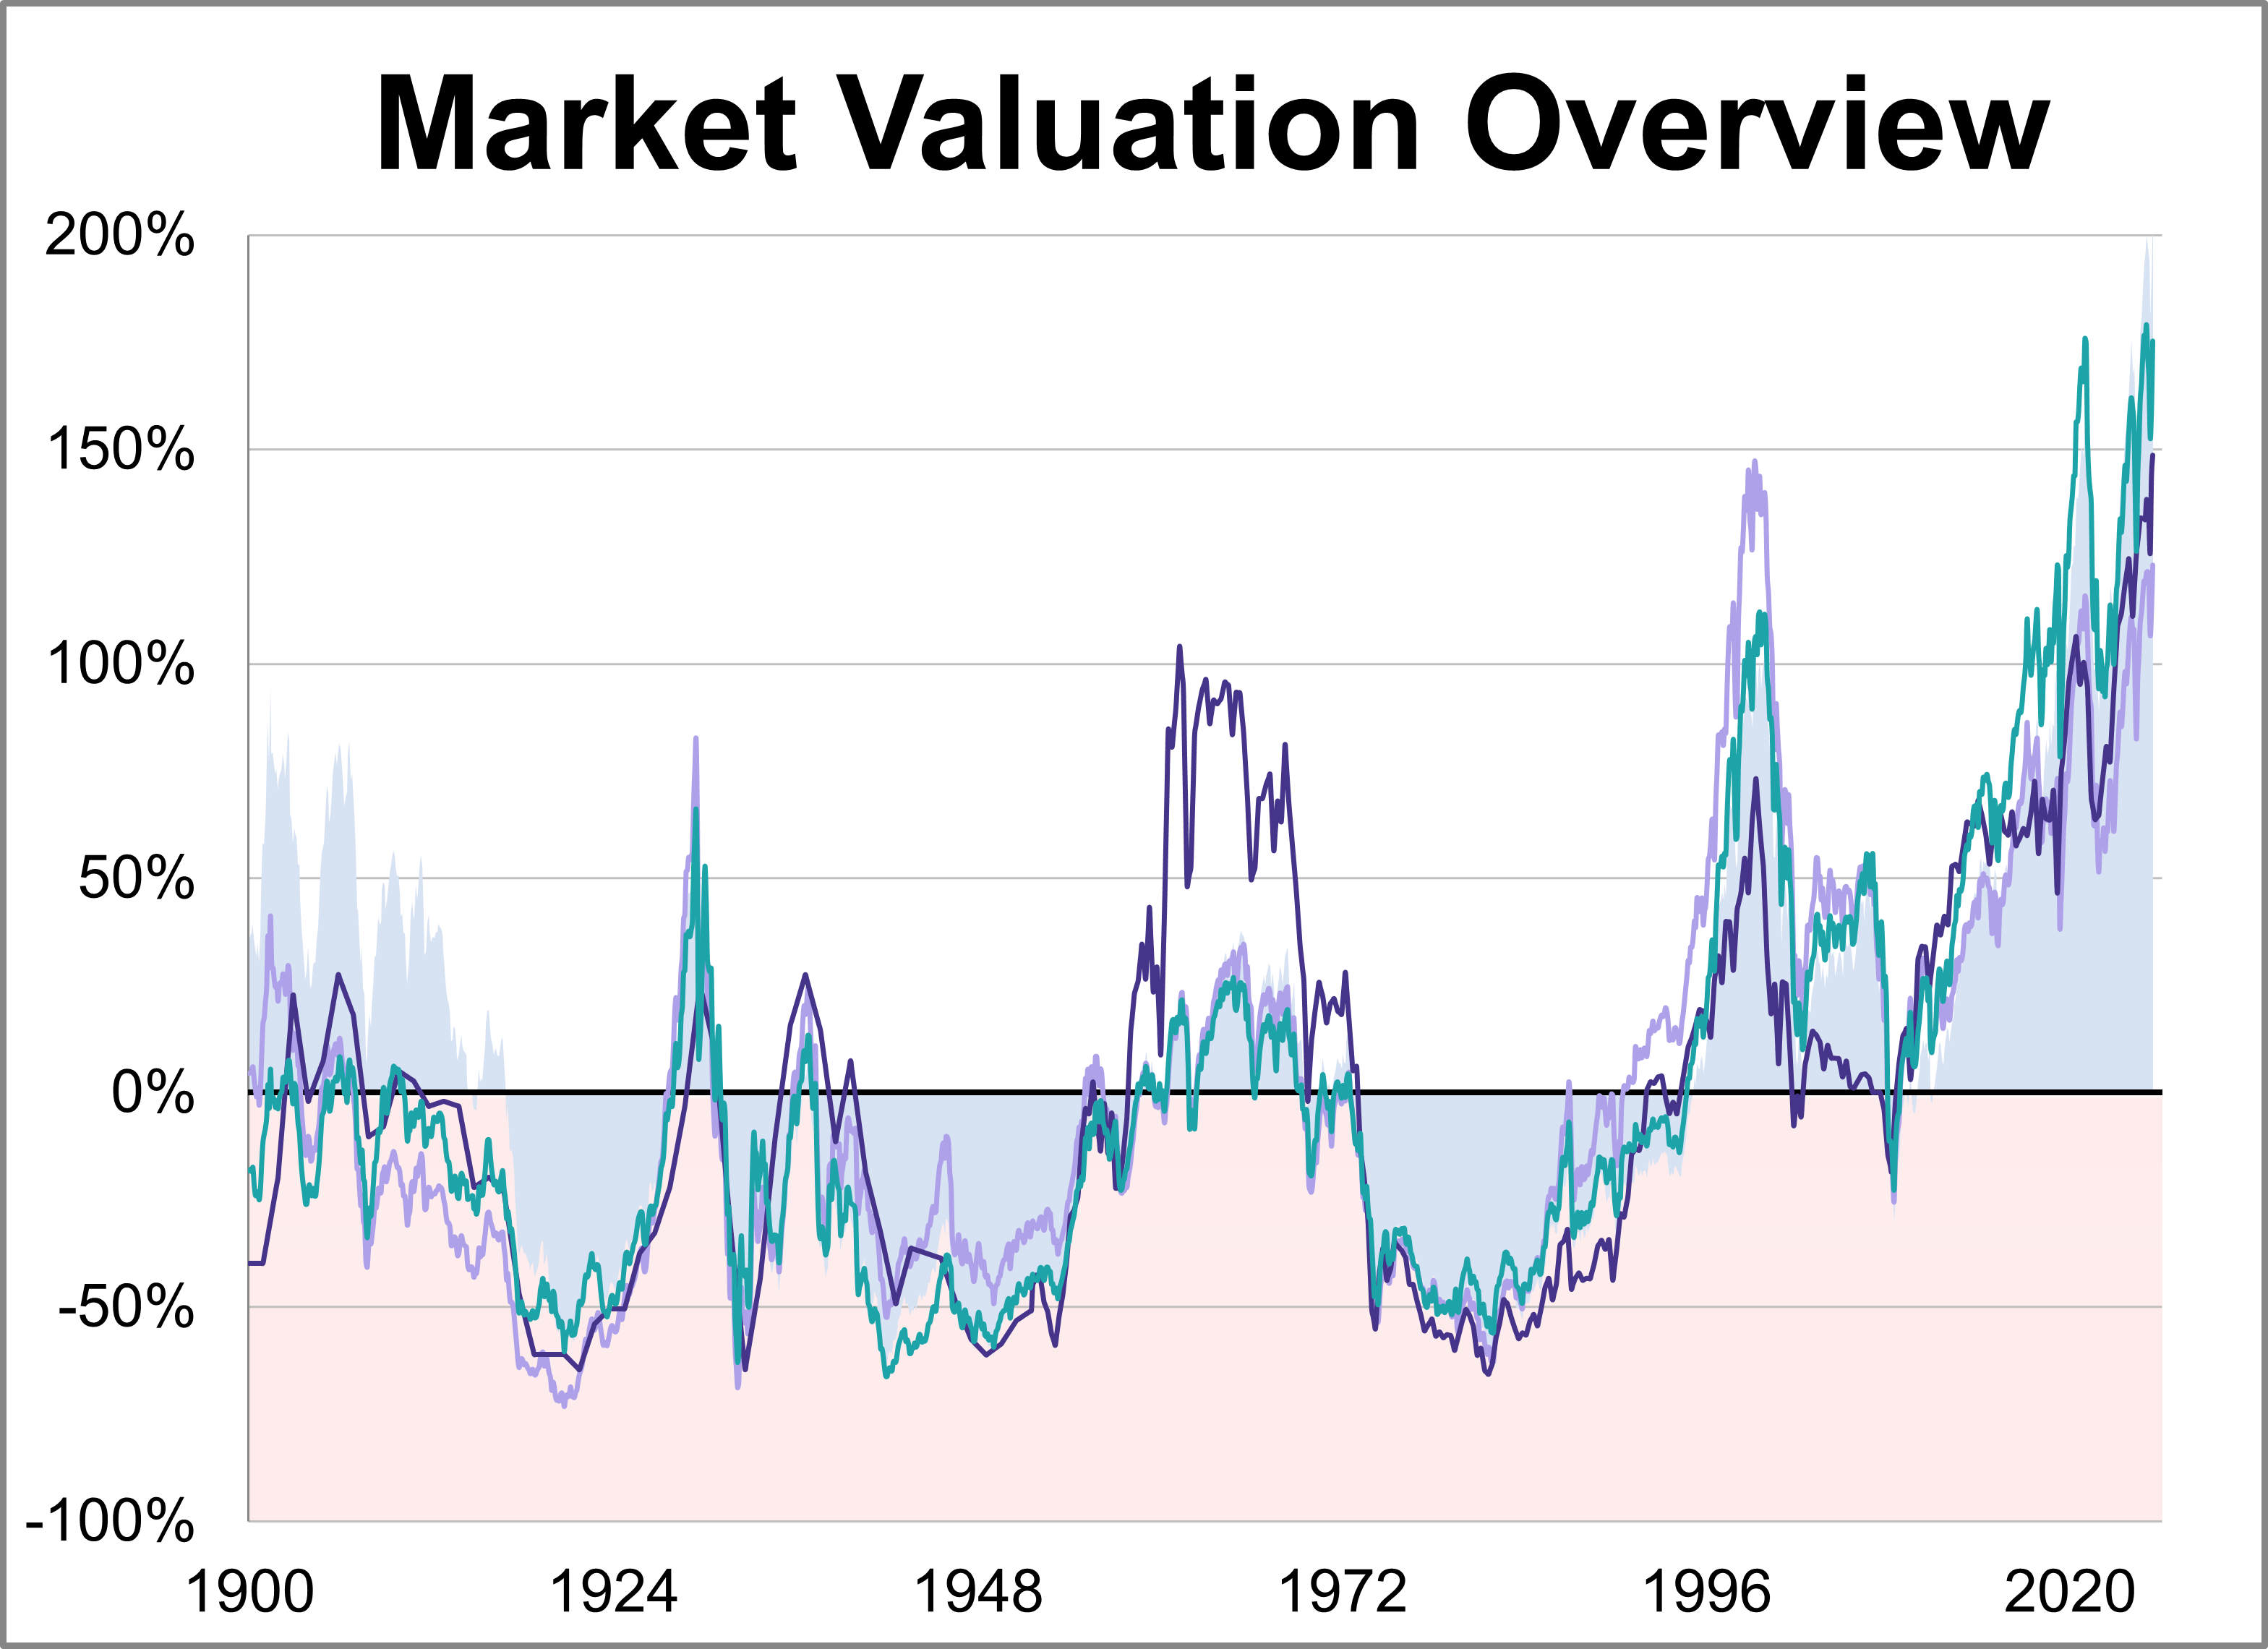
Here is a summary of the four market valuation indicators we update on a monthly basis.
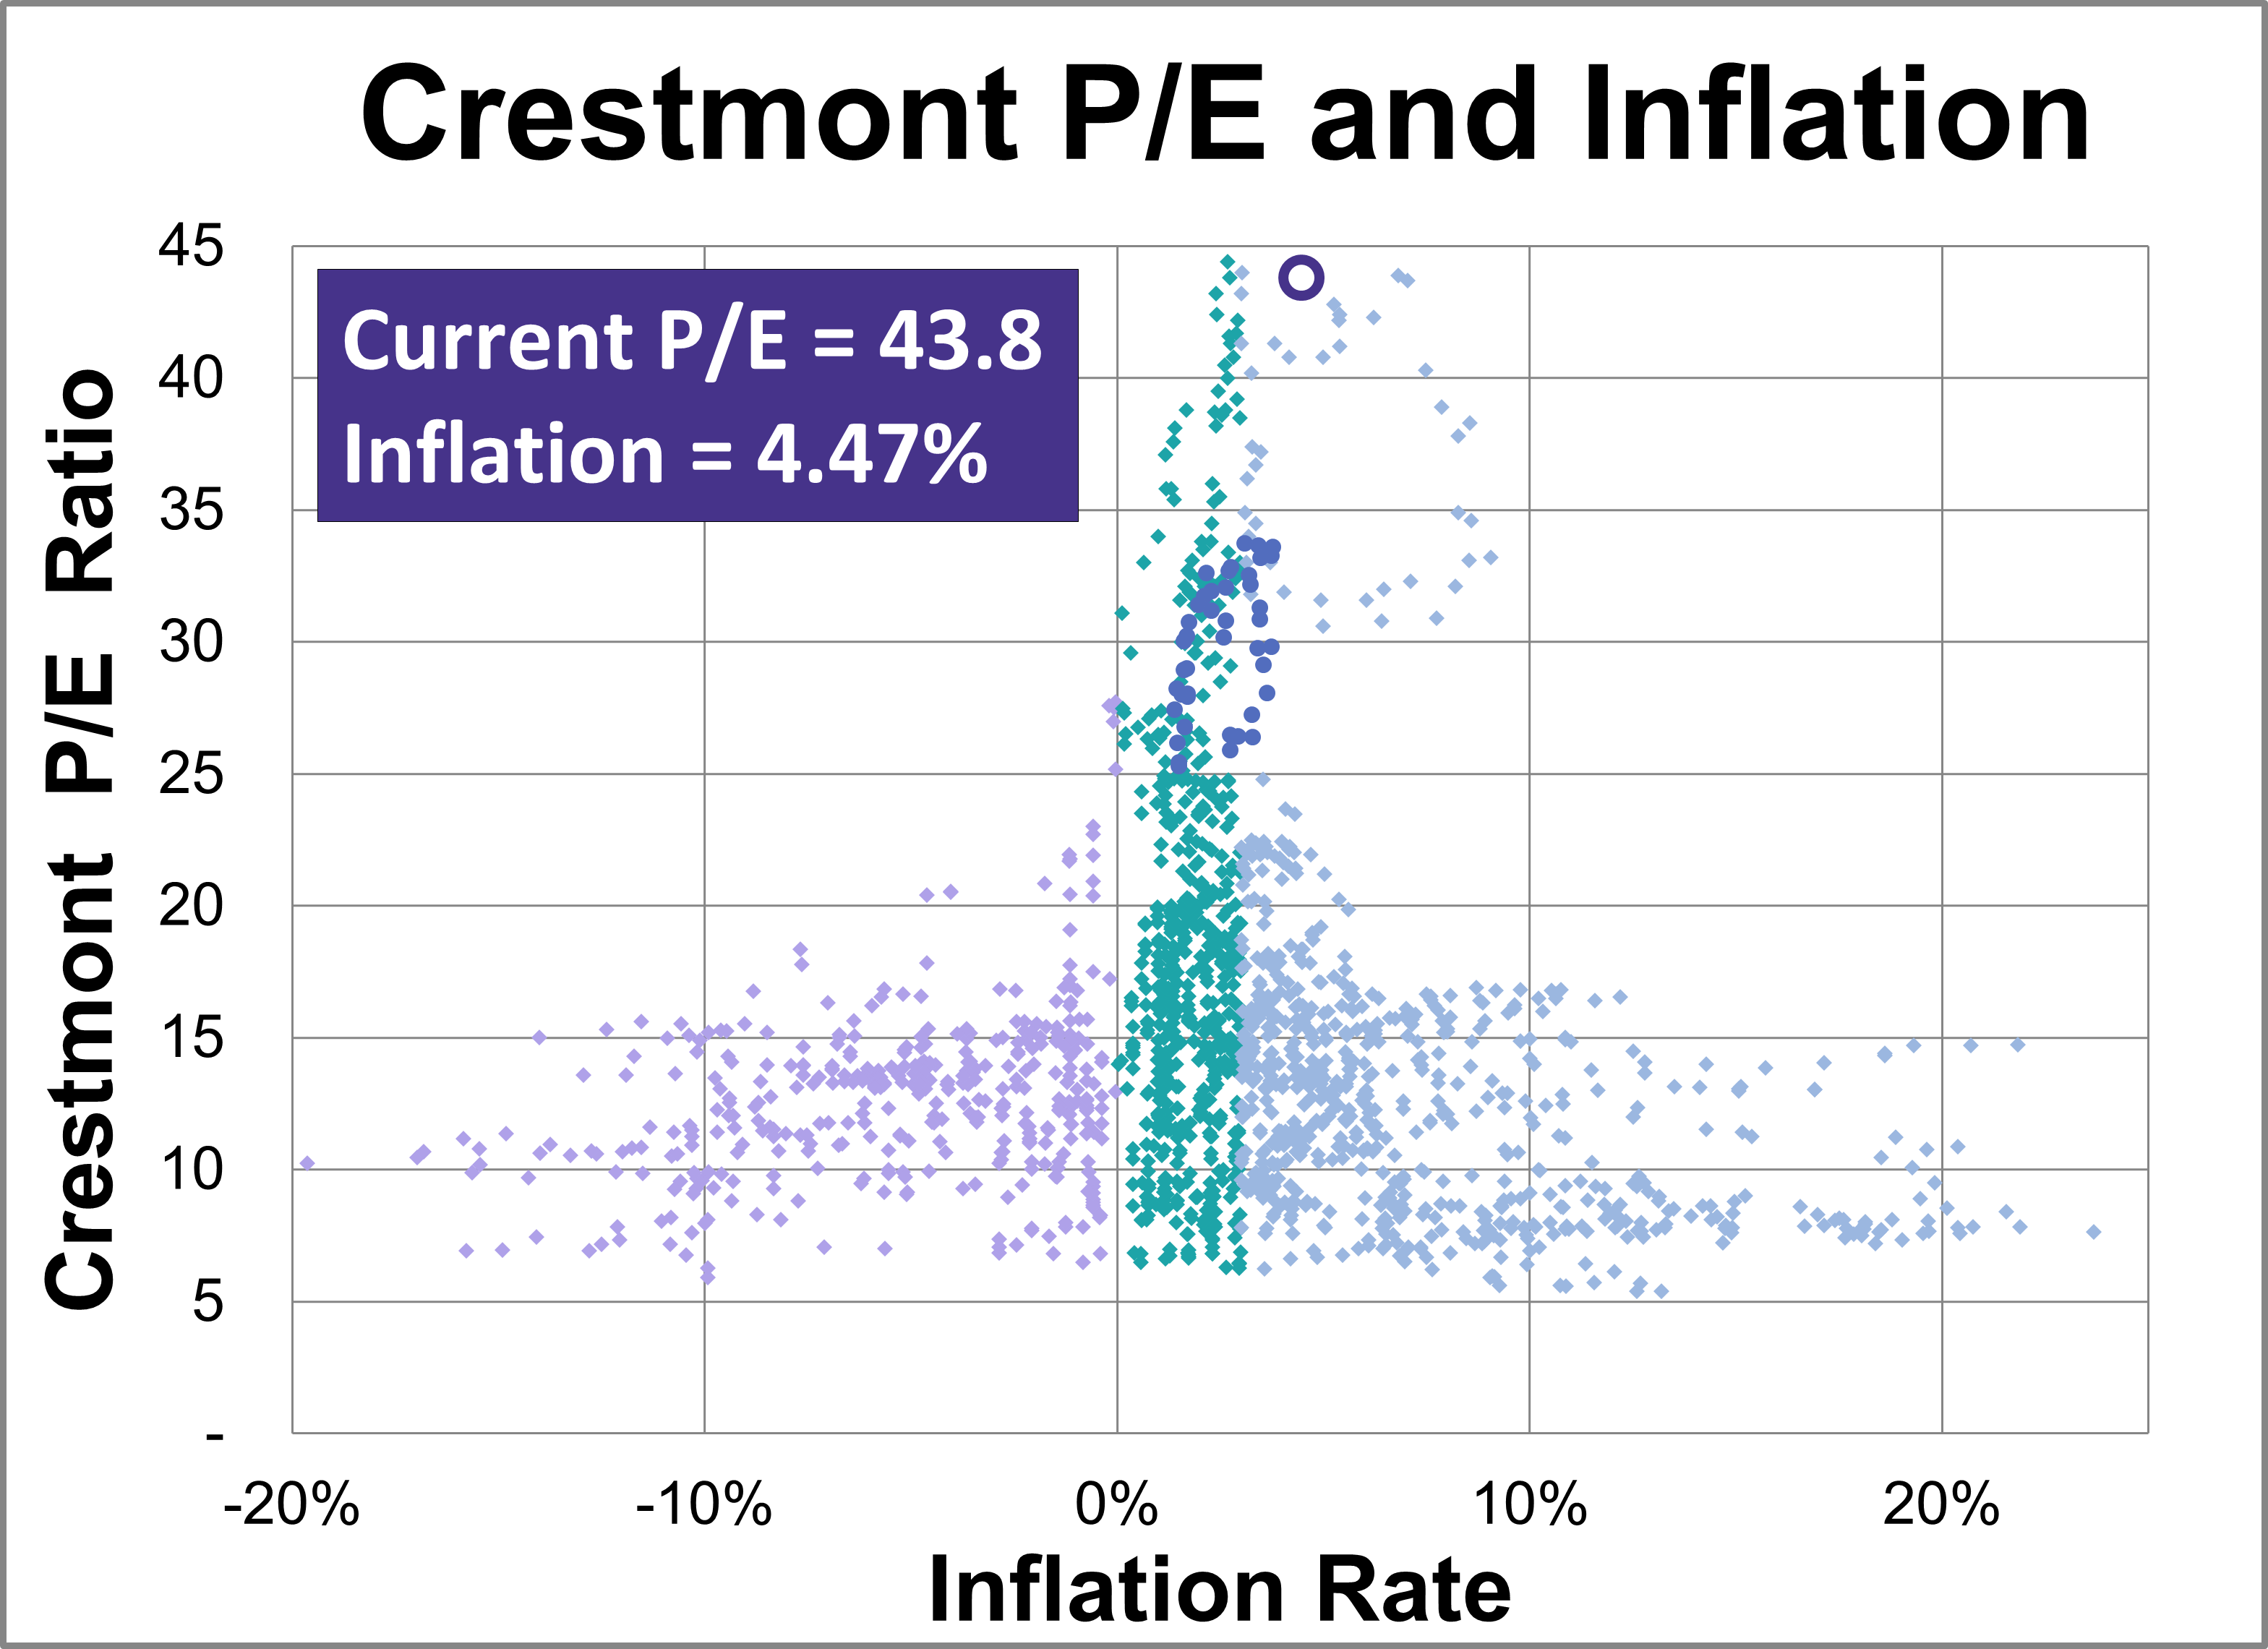
Based on May's S&P 500 average of daily closes, the Crestmont P/E of 43.8 is 185% above its arithmetic mean, 213% above its geometric mean, and is in the 100th percentile of this 14-plus-decade series.
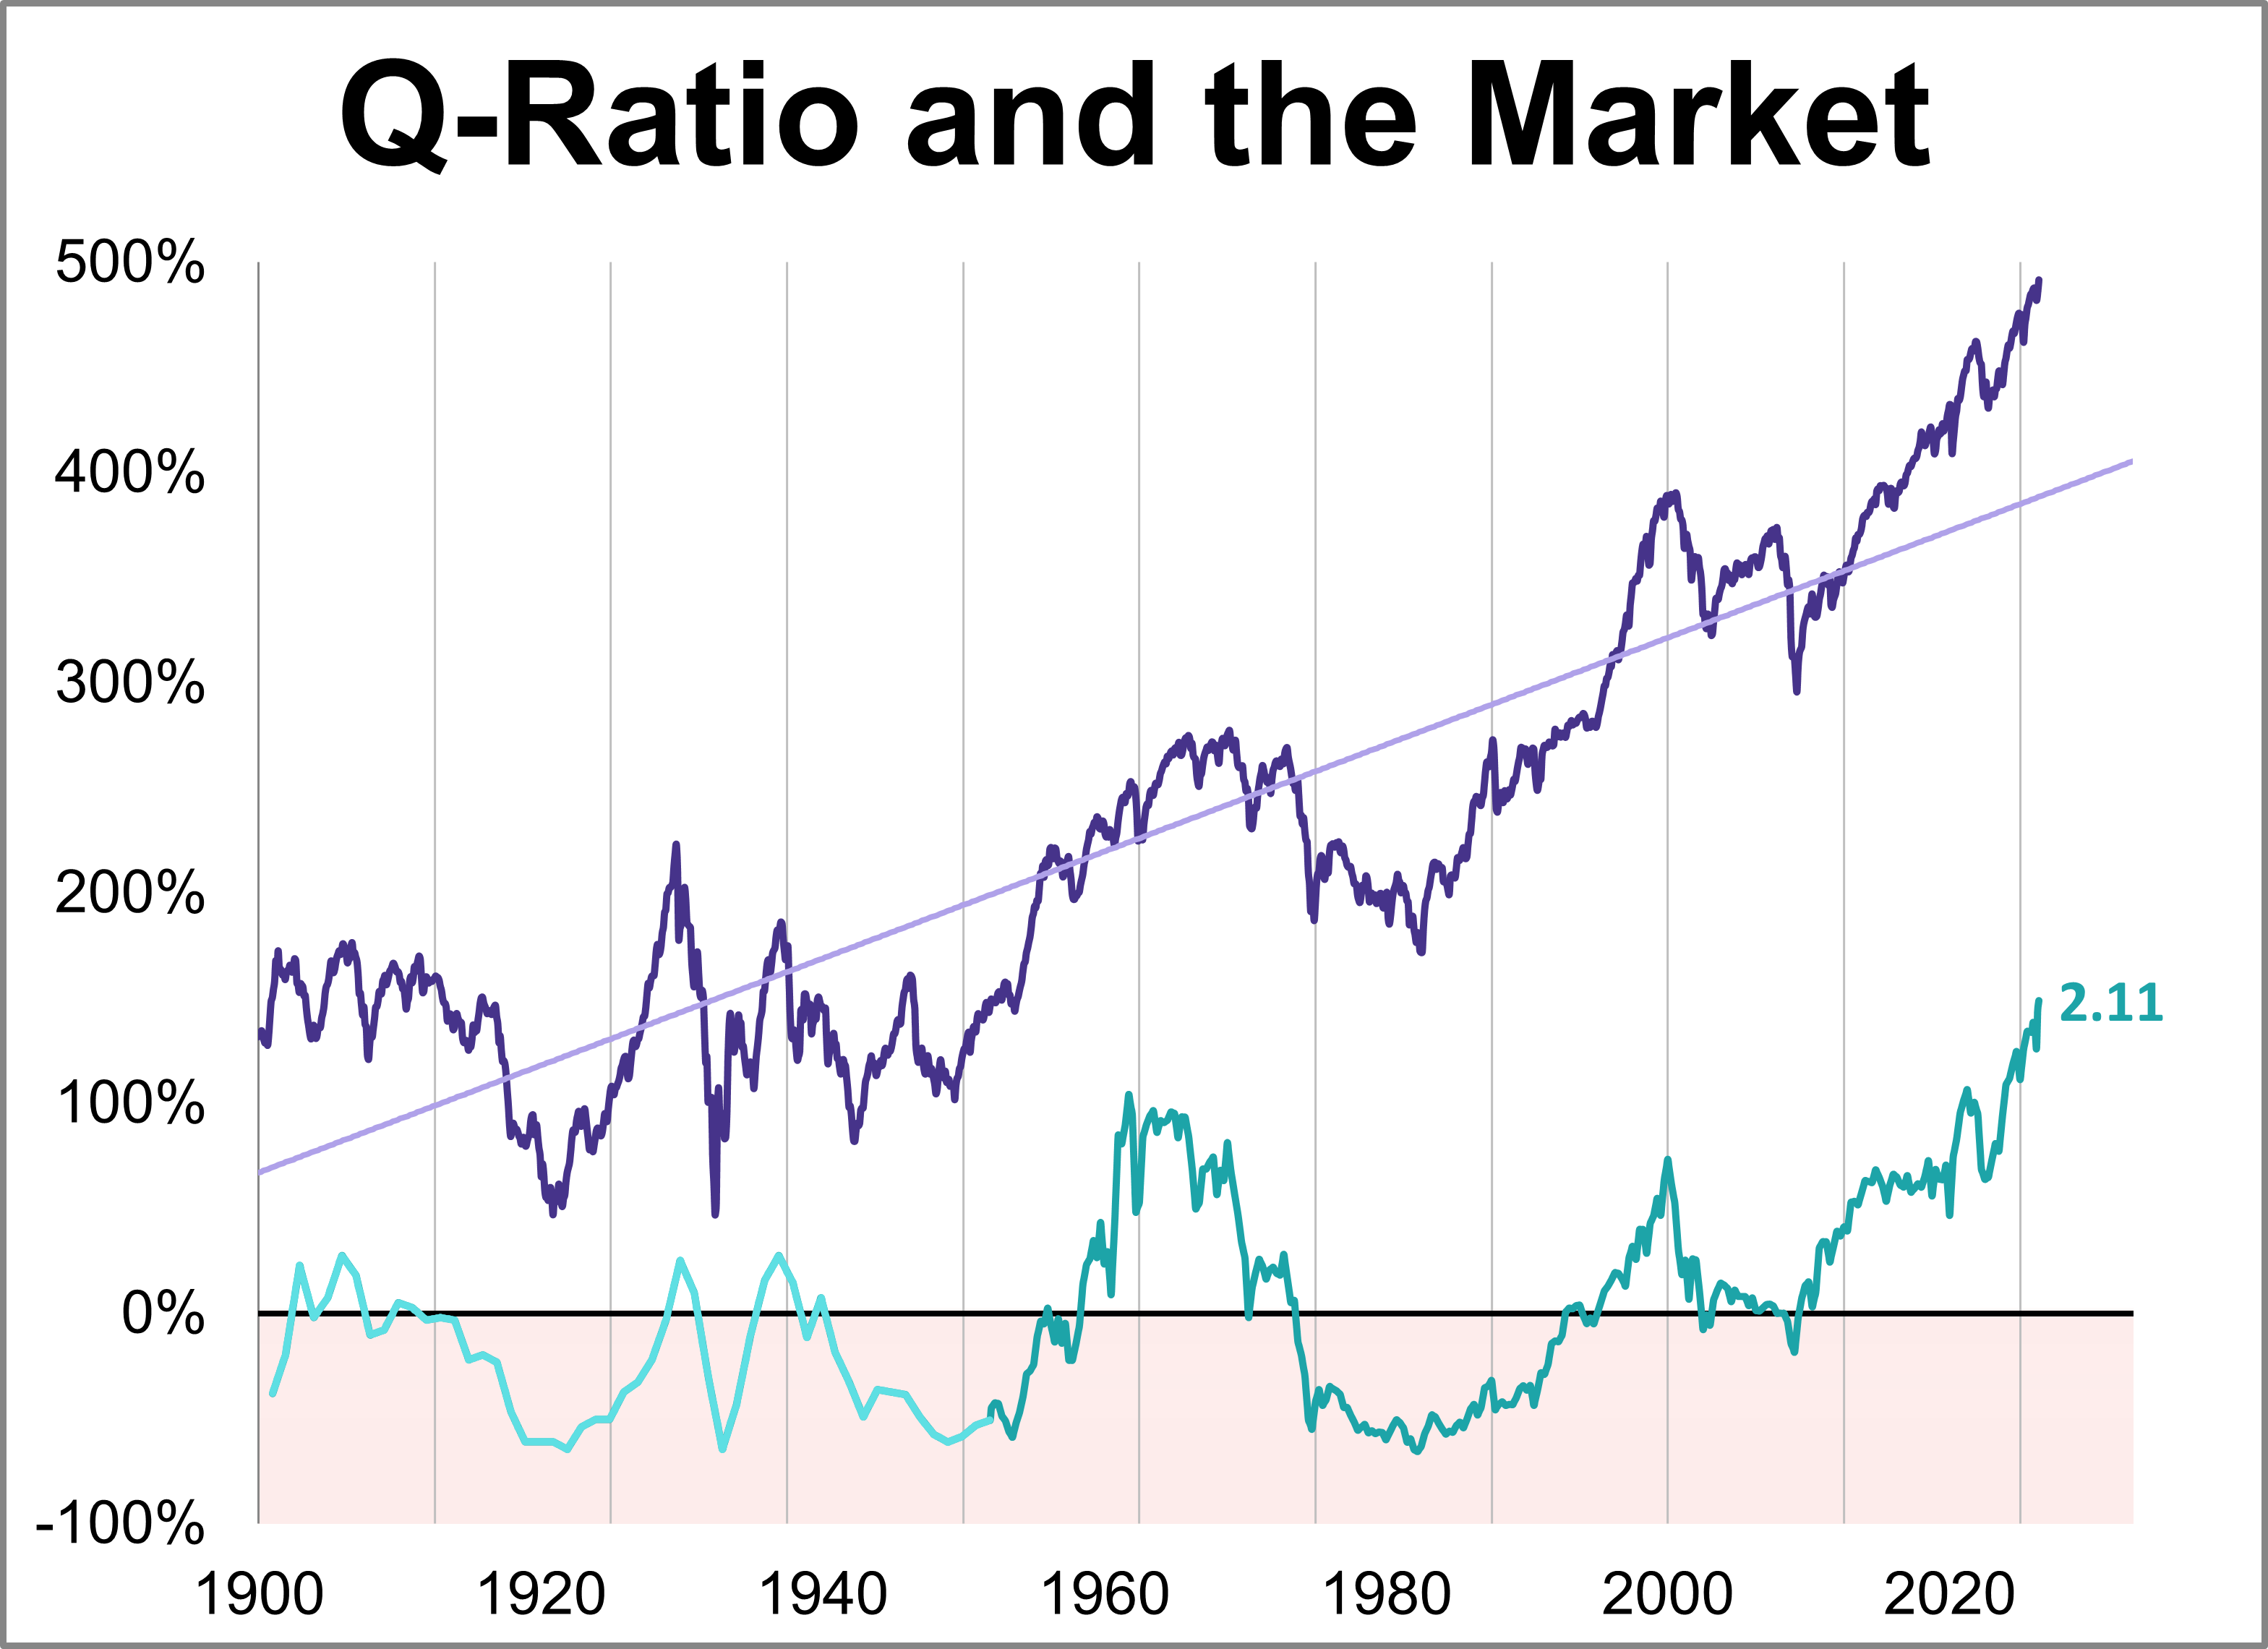
The Q Ratio is the total price of the market divided by the replacement cost of all its companies. As of May 2026, the latest Q-ratio is at 2.11, the highest level in history.
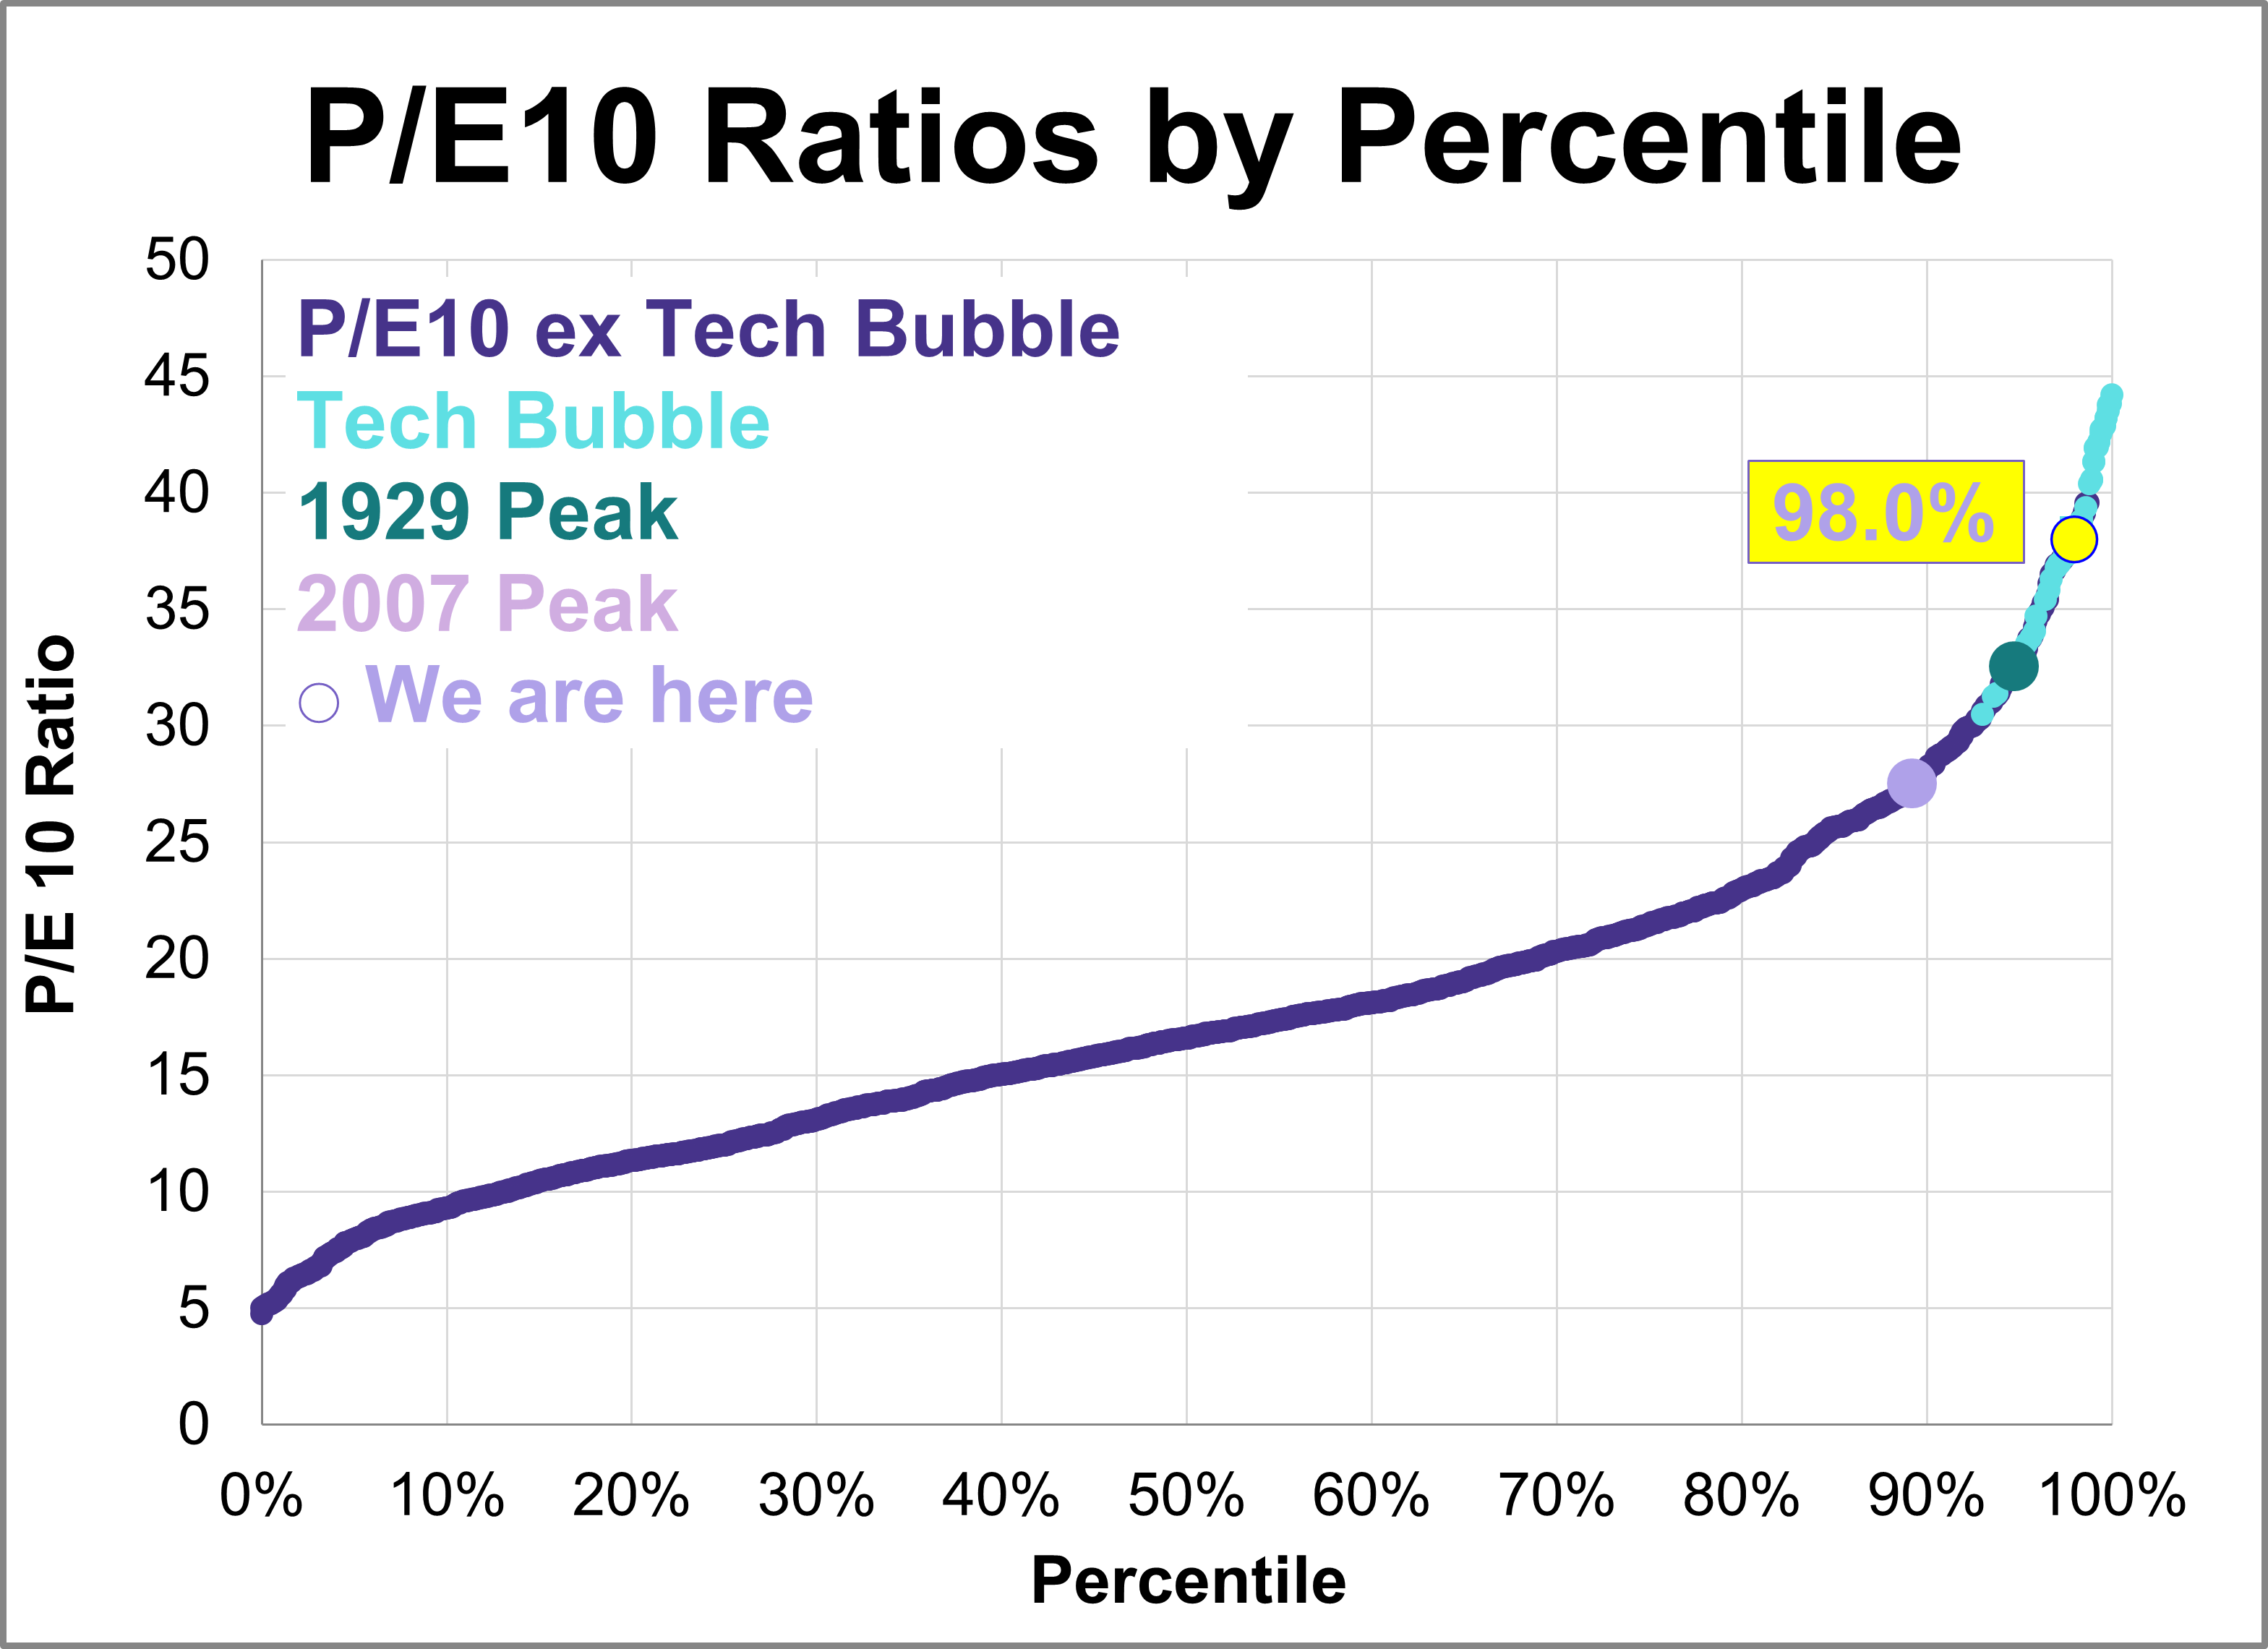
Here is the latest update of a popular market valuation method, Price-to-Earnings (P/E) ratio, using the most recent Standard & Poor's "as reported" earnings and earnings estimates, and the index monthly average of daily closes for the past month. The latest trailing twelve months (TTM) P/E ratio is 25.9 and the latest P/E10 ratio is 39.9, the highest level since 2000.
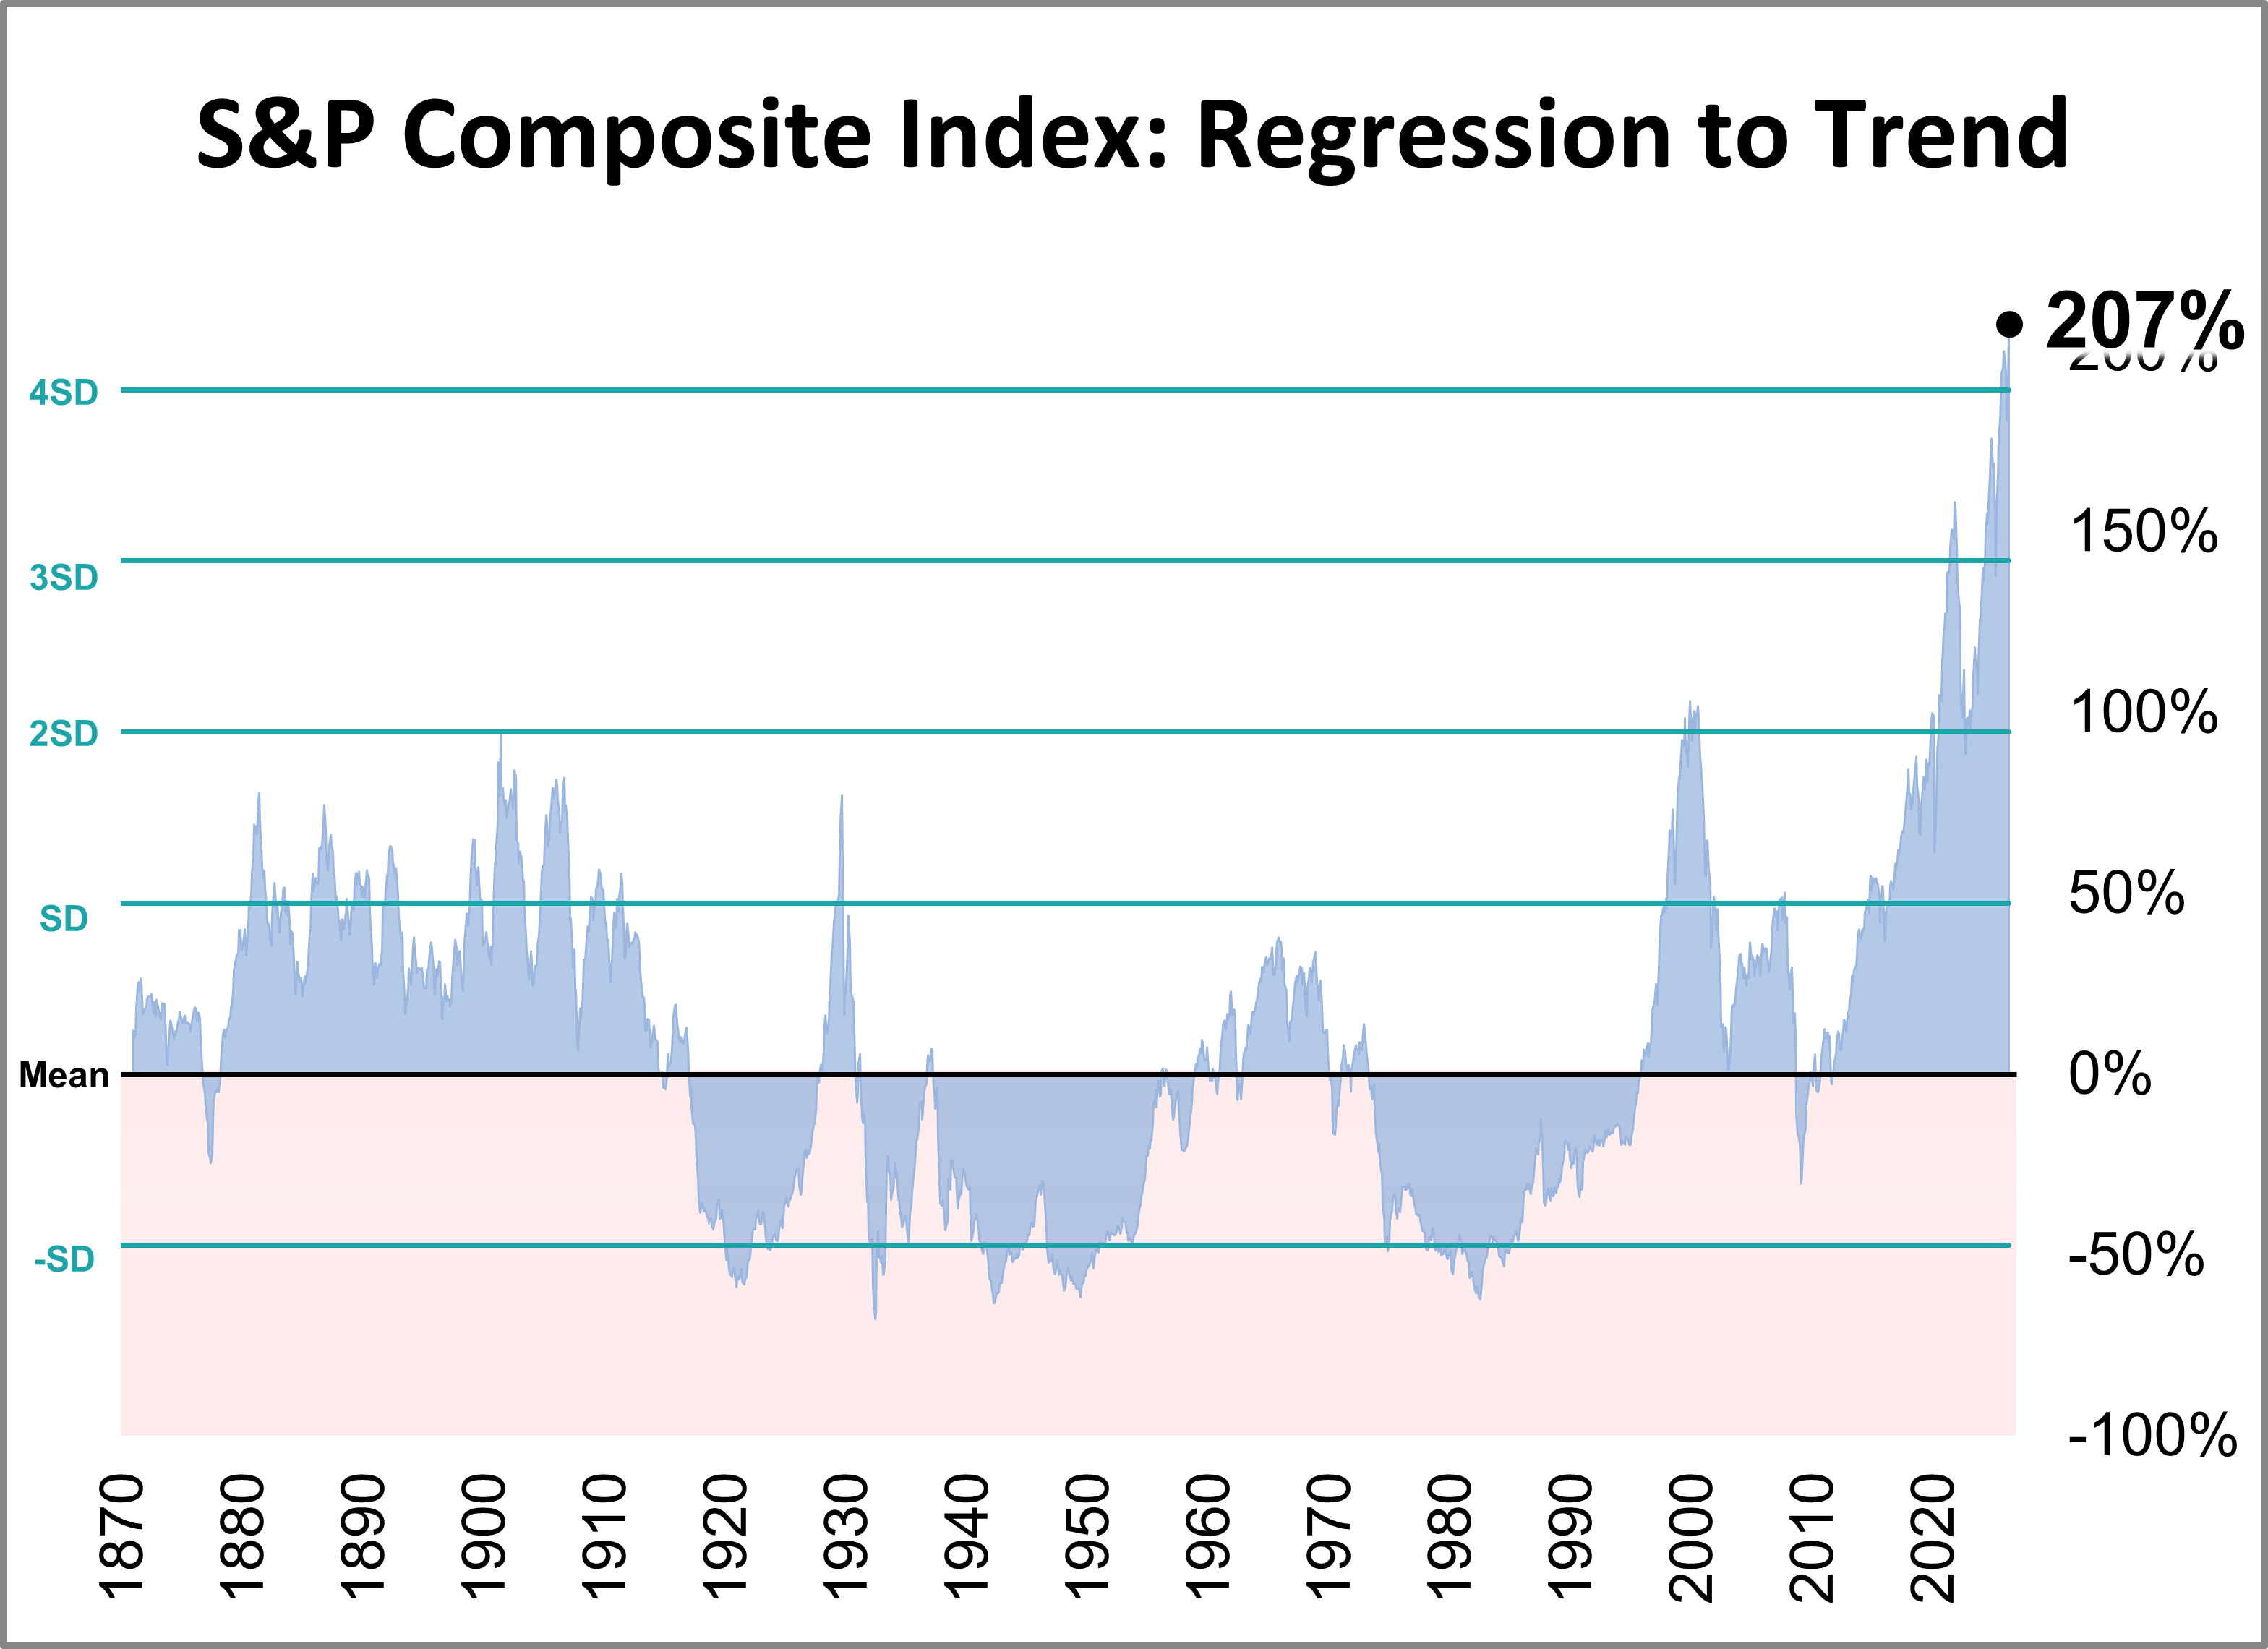
The inflation-adjusted S&P Composite Index was 207% above its long-term trend at the end of May.
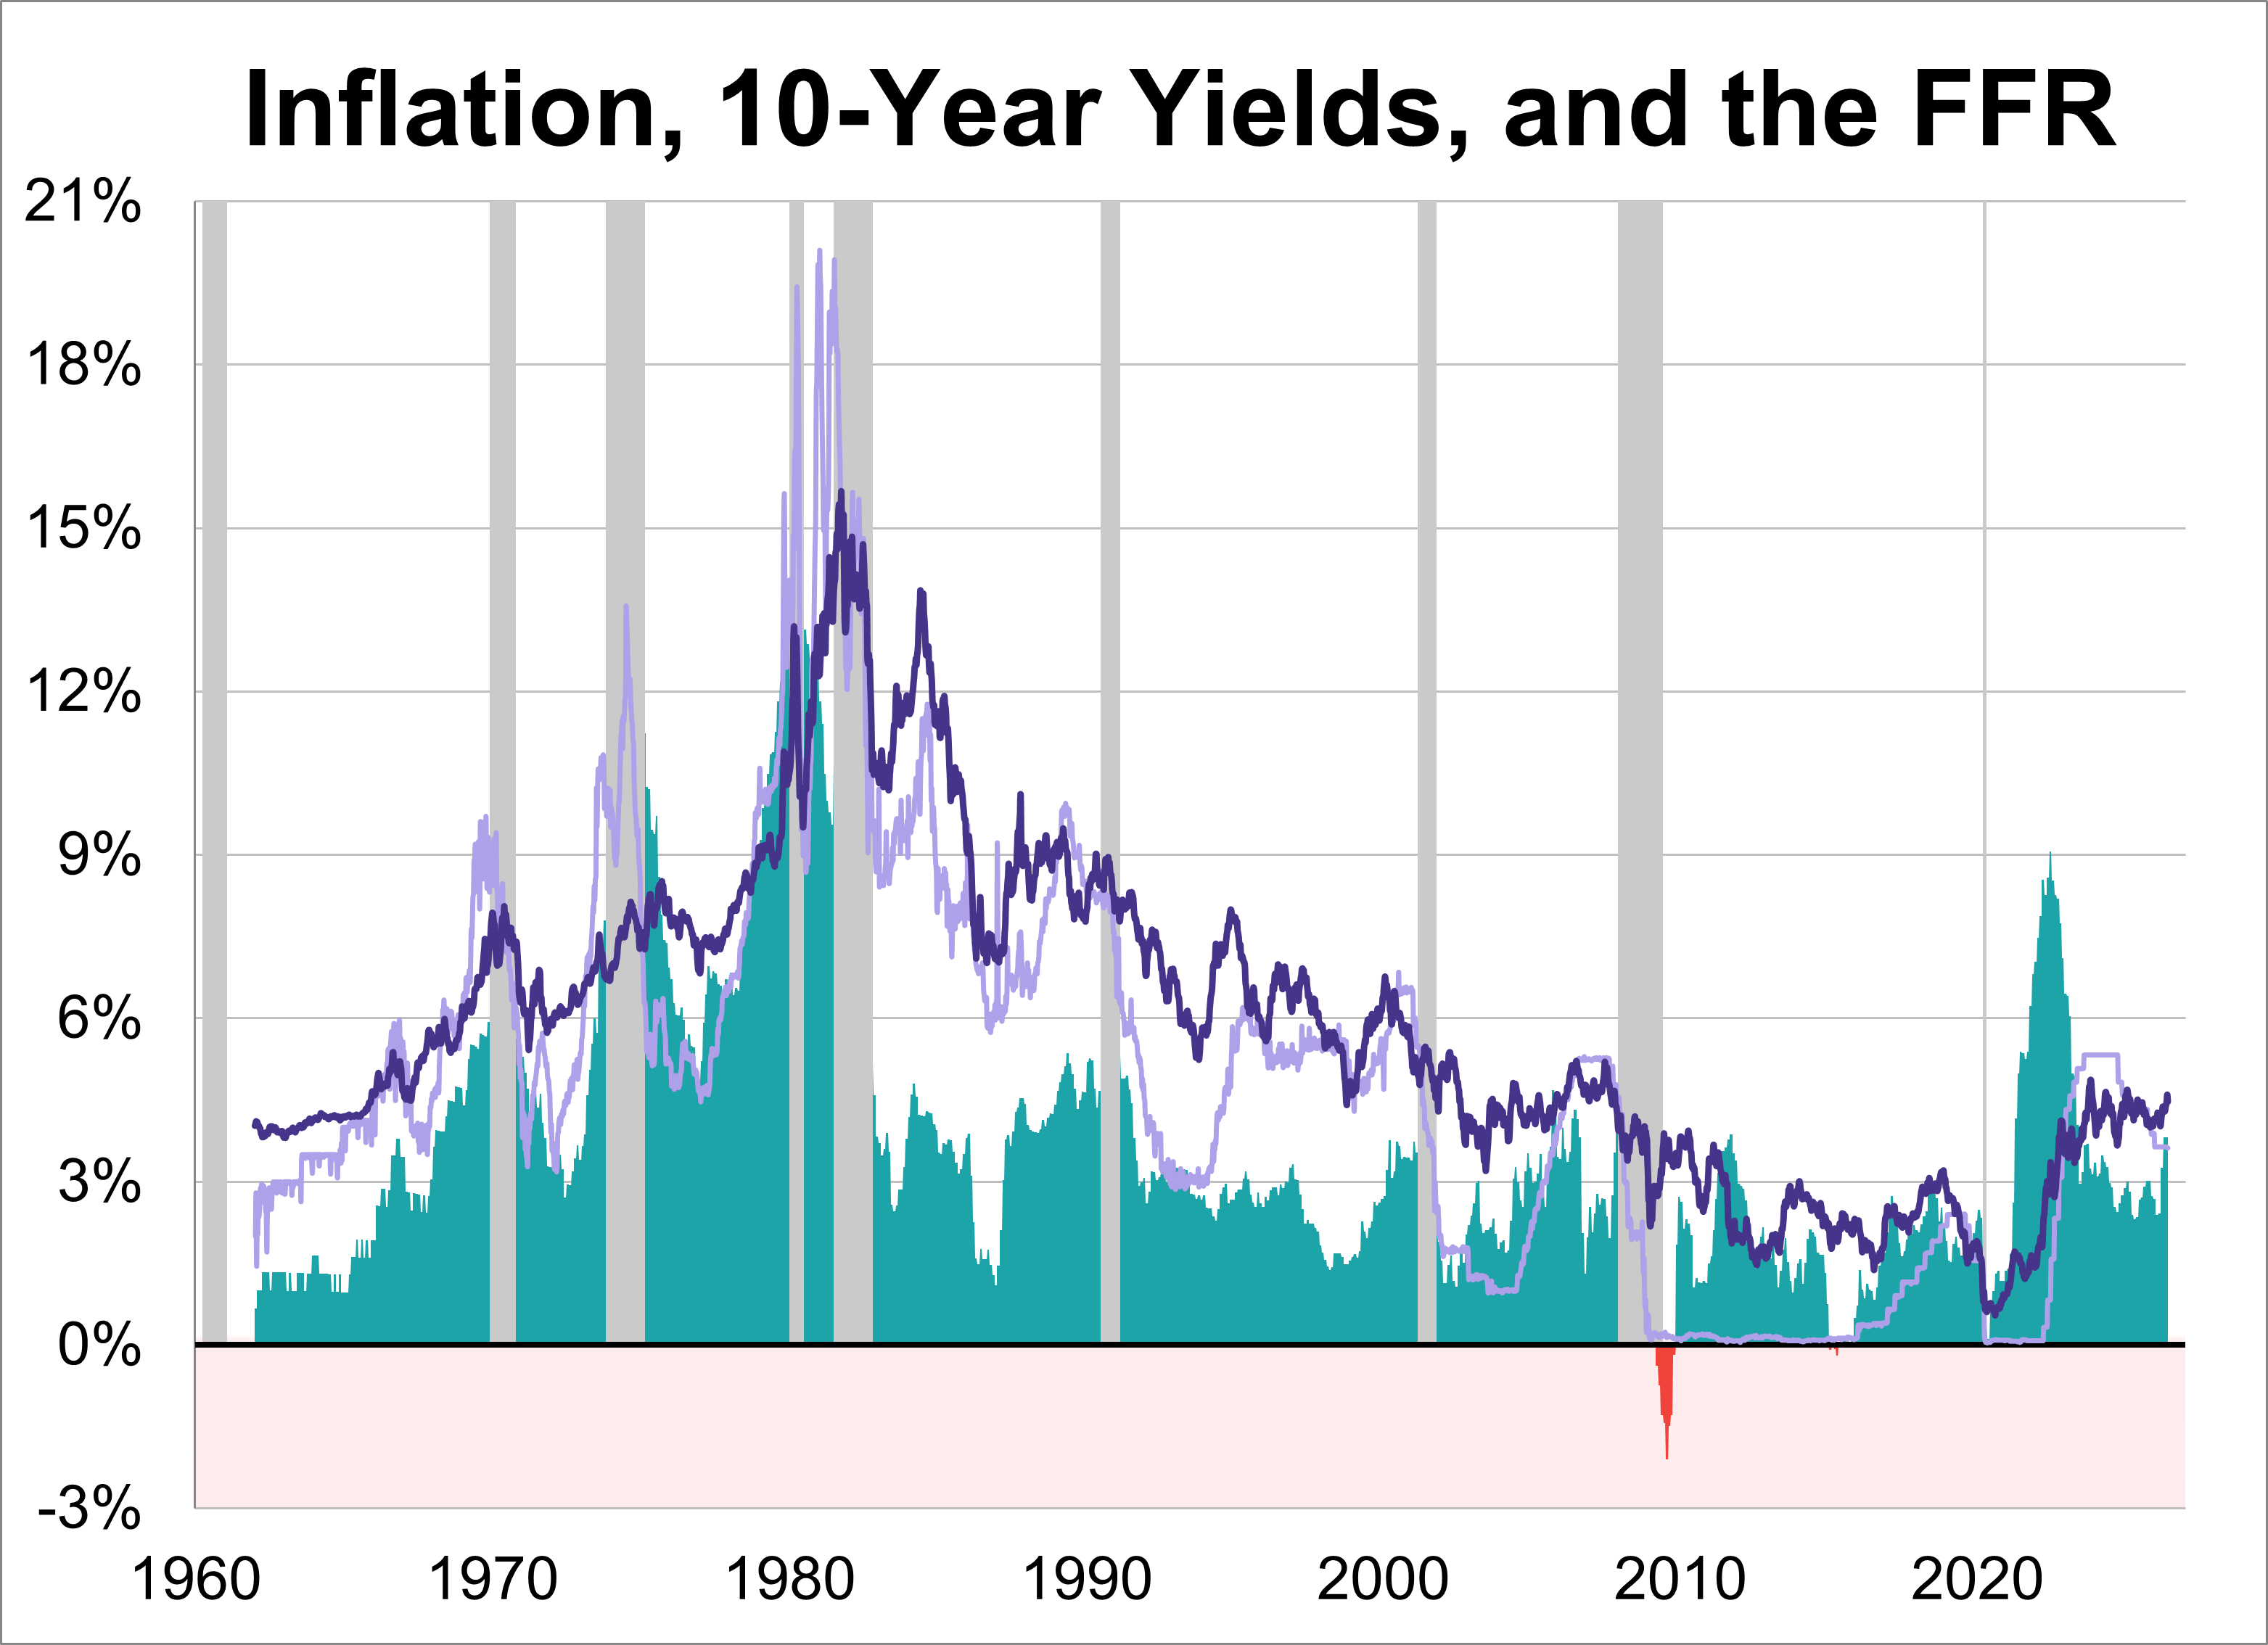
The 10-year Treasury yield has experienced dramatic fluctuations, ranging from a peak of 15.68% in October 1981, during the height of the Volcker era, to a historic low of 0.55% in August 2020, amidst the economic uncertainty of the pandemic. At the end of May 2026, the weekly average stood at 4.47%.
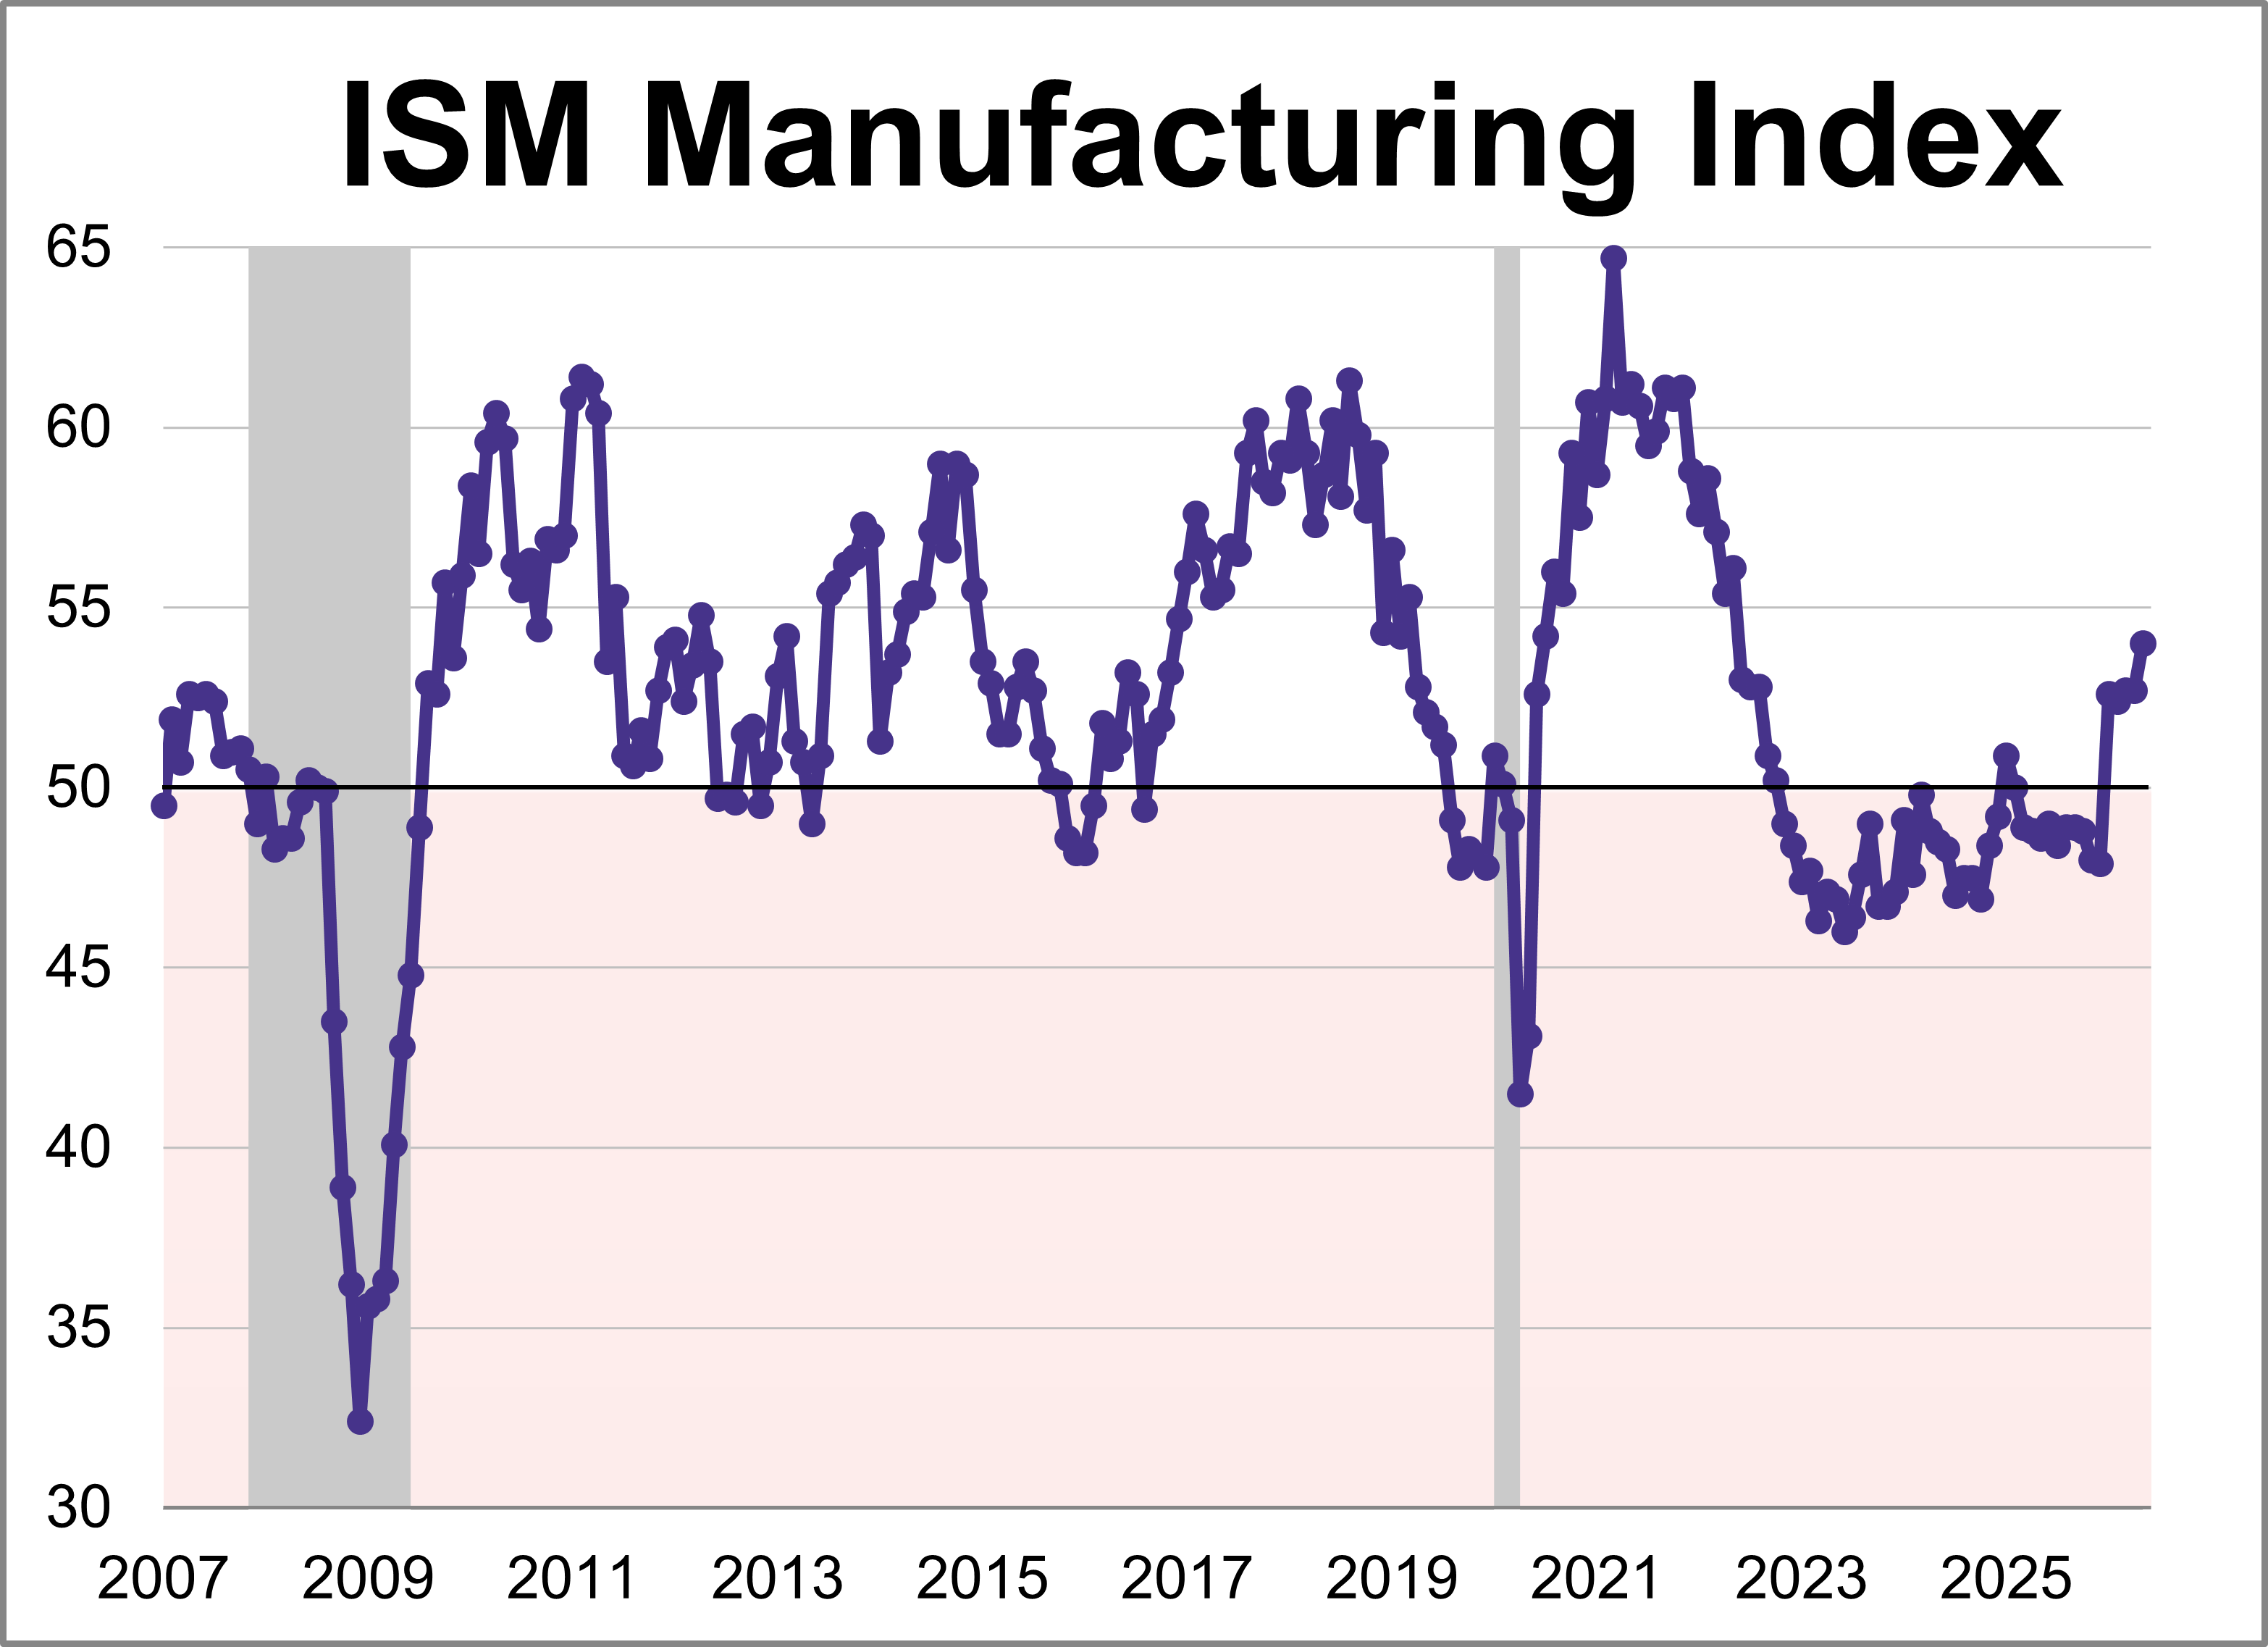
The Institute for Supply Management (ISM) manufacturing purchasing managers index (PMI) came in at 54.0 in May, marking the fastest expansion for the index since May 2022. The latest reading was higher than the 53.3 forecast and is the index's fifth straight month in expansion territory.
Closed-end funds may not be a hot topic right now, but they offer a highly compelling means to solve today's macroeconomic woes.
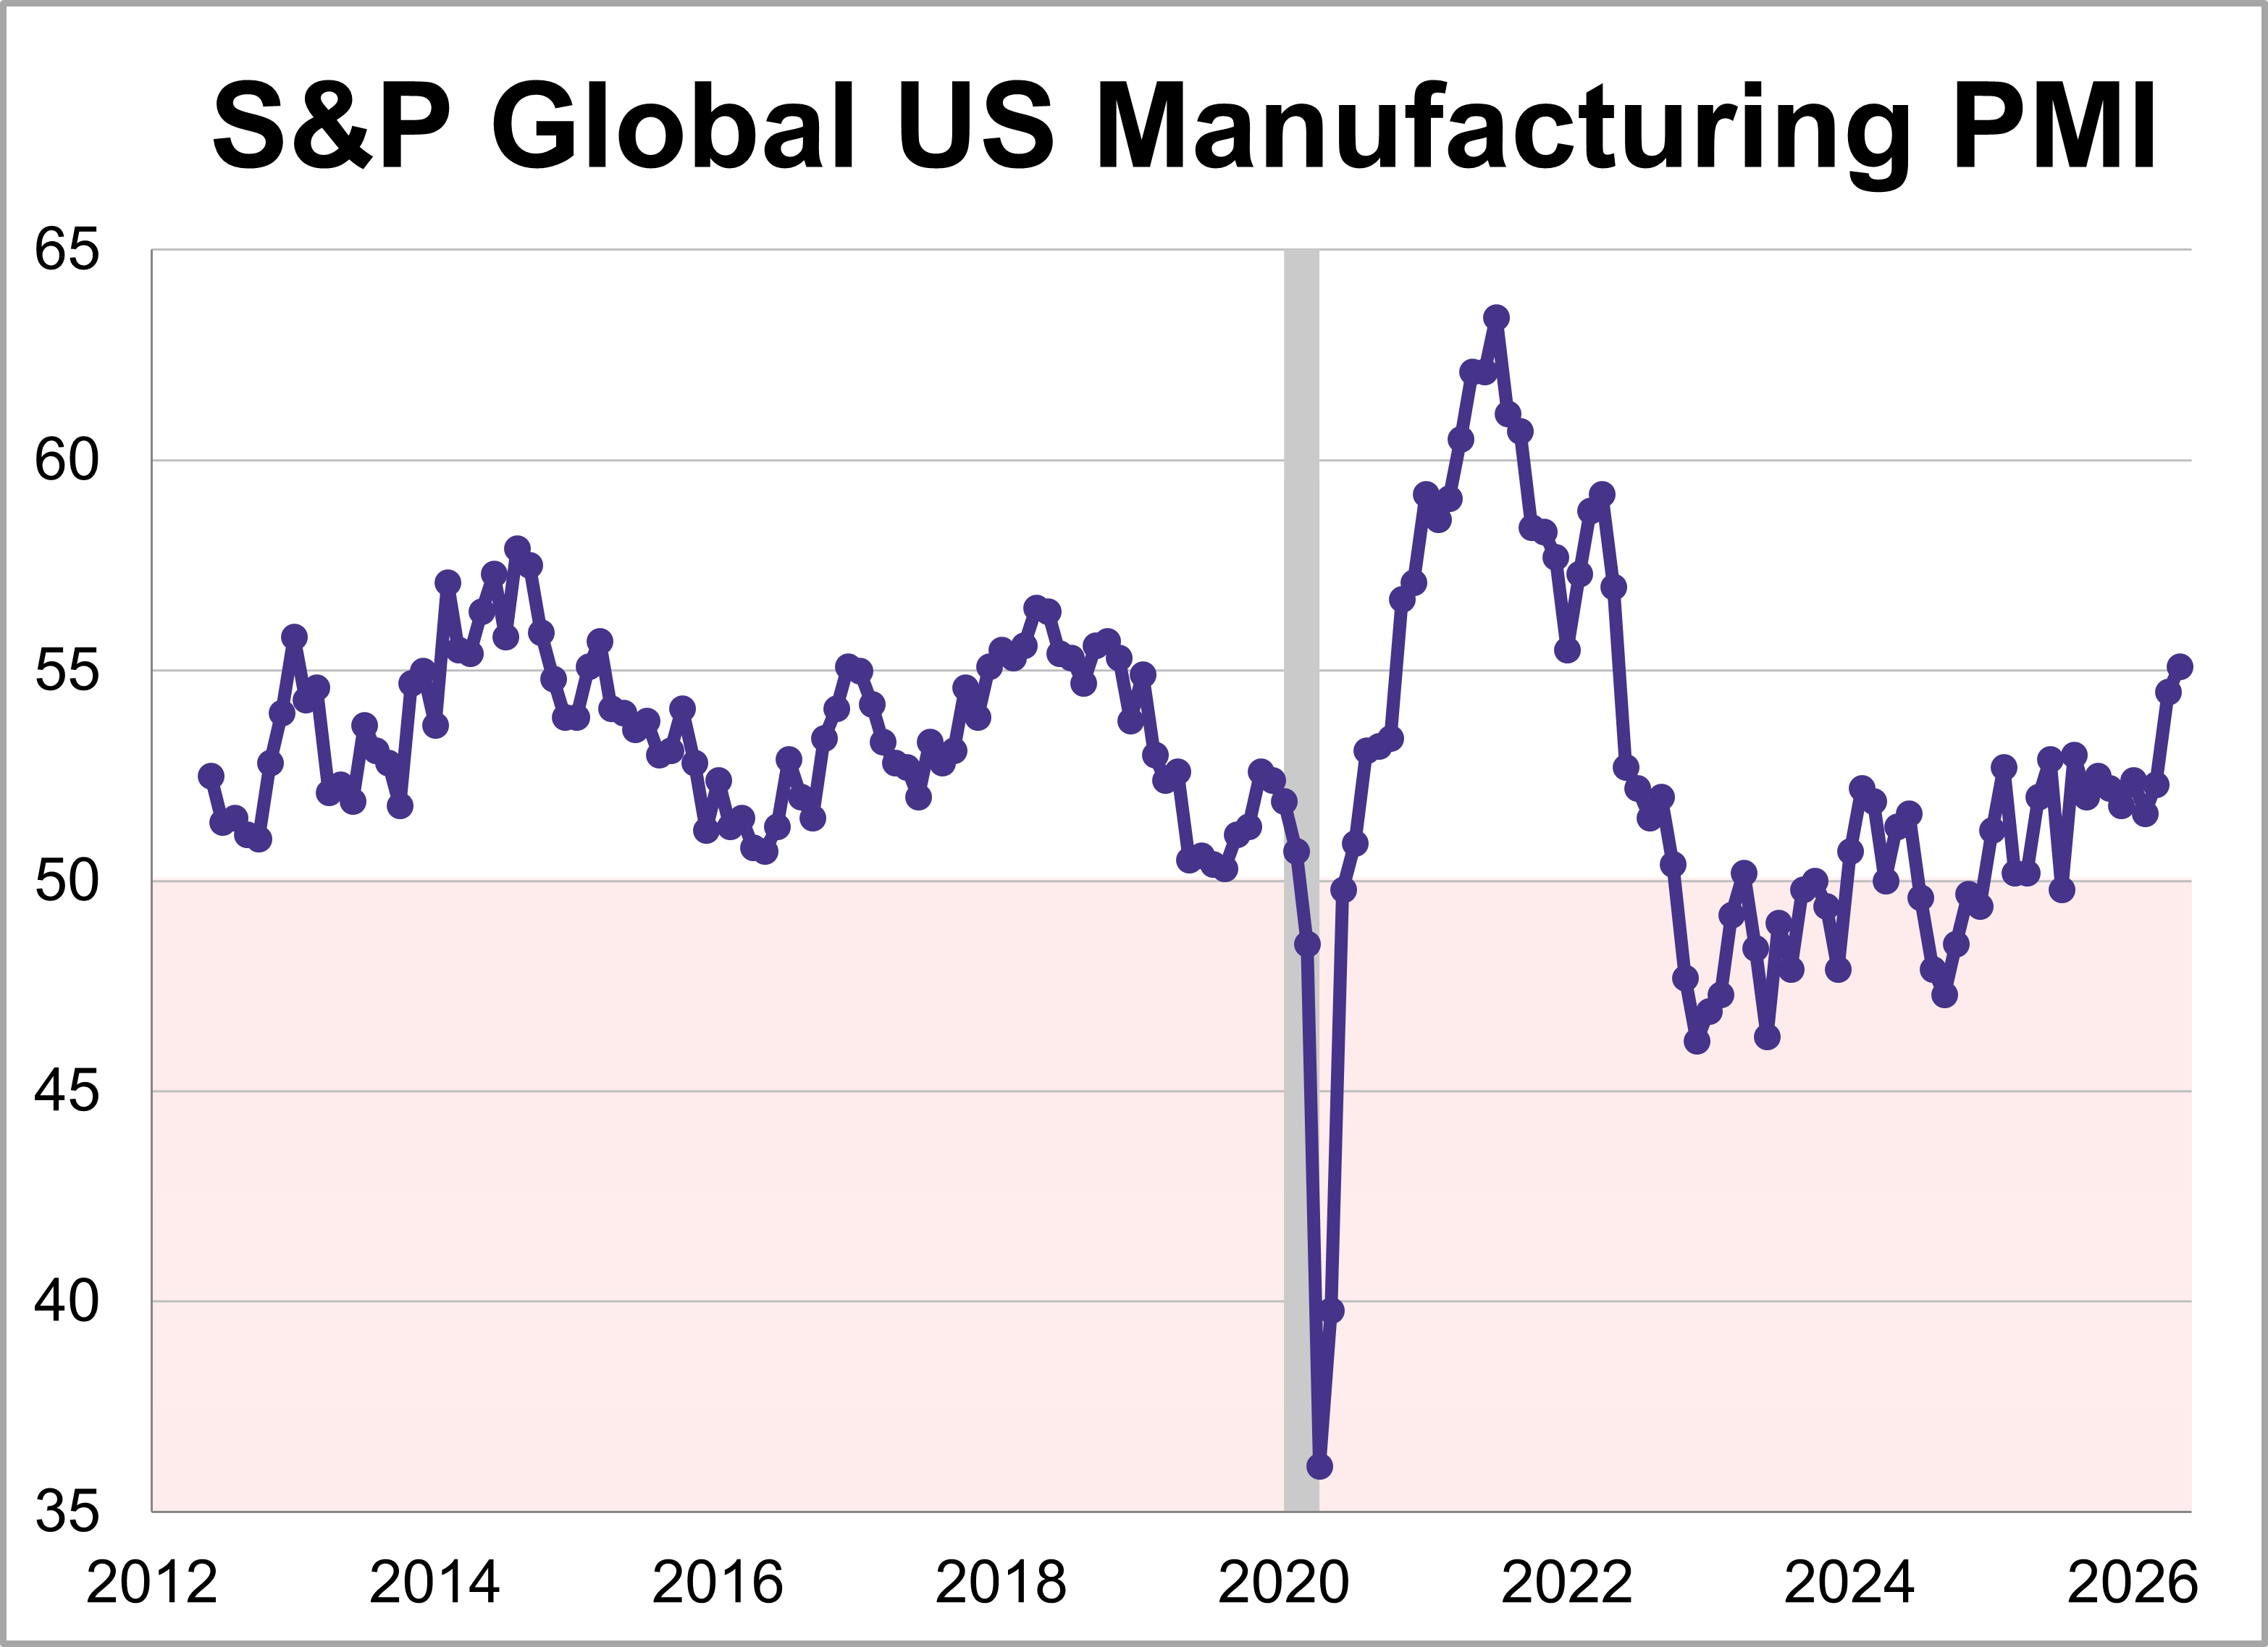
U.S. manufacturing hit its highest level in four years, as the S&P Global PMI climbed 0.6 points to 55.1 in May. For a second straight month, the expansion was largely driven by defensive stockpiling as companies continue bracing for supply disruptions and price hikes linked to conflict in the Middle East.
Last week’s data tracked a shifting economic trajectory over the last several months. While the latest reading on first-quarter GDP confirms the economy started the year with steady growth, subsequent inflation metrics moved higher and ultimately weighed on consumer confidence.
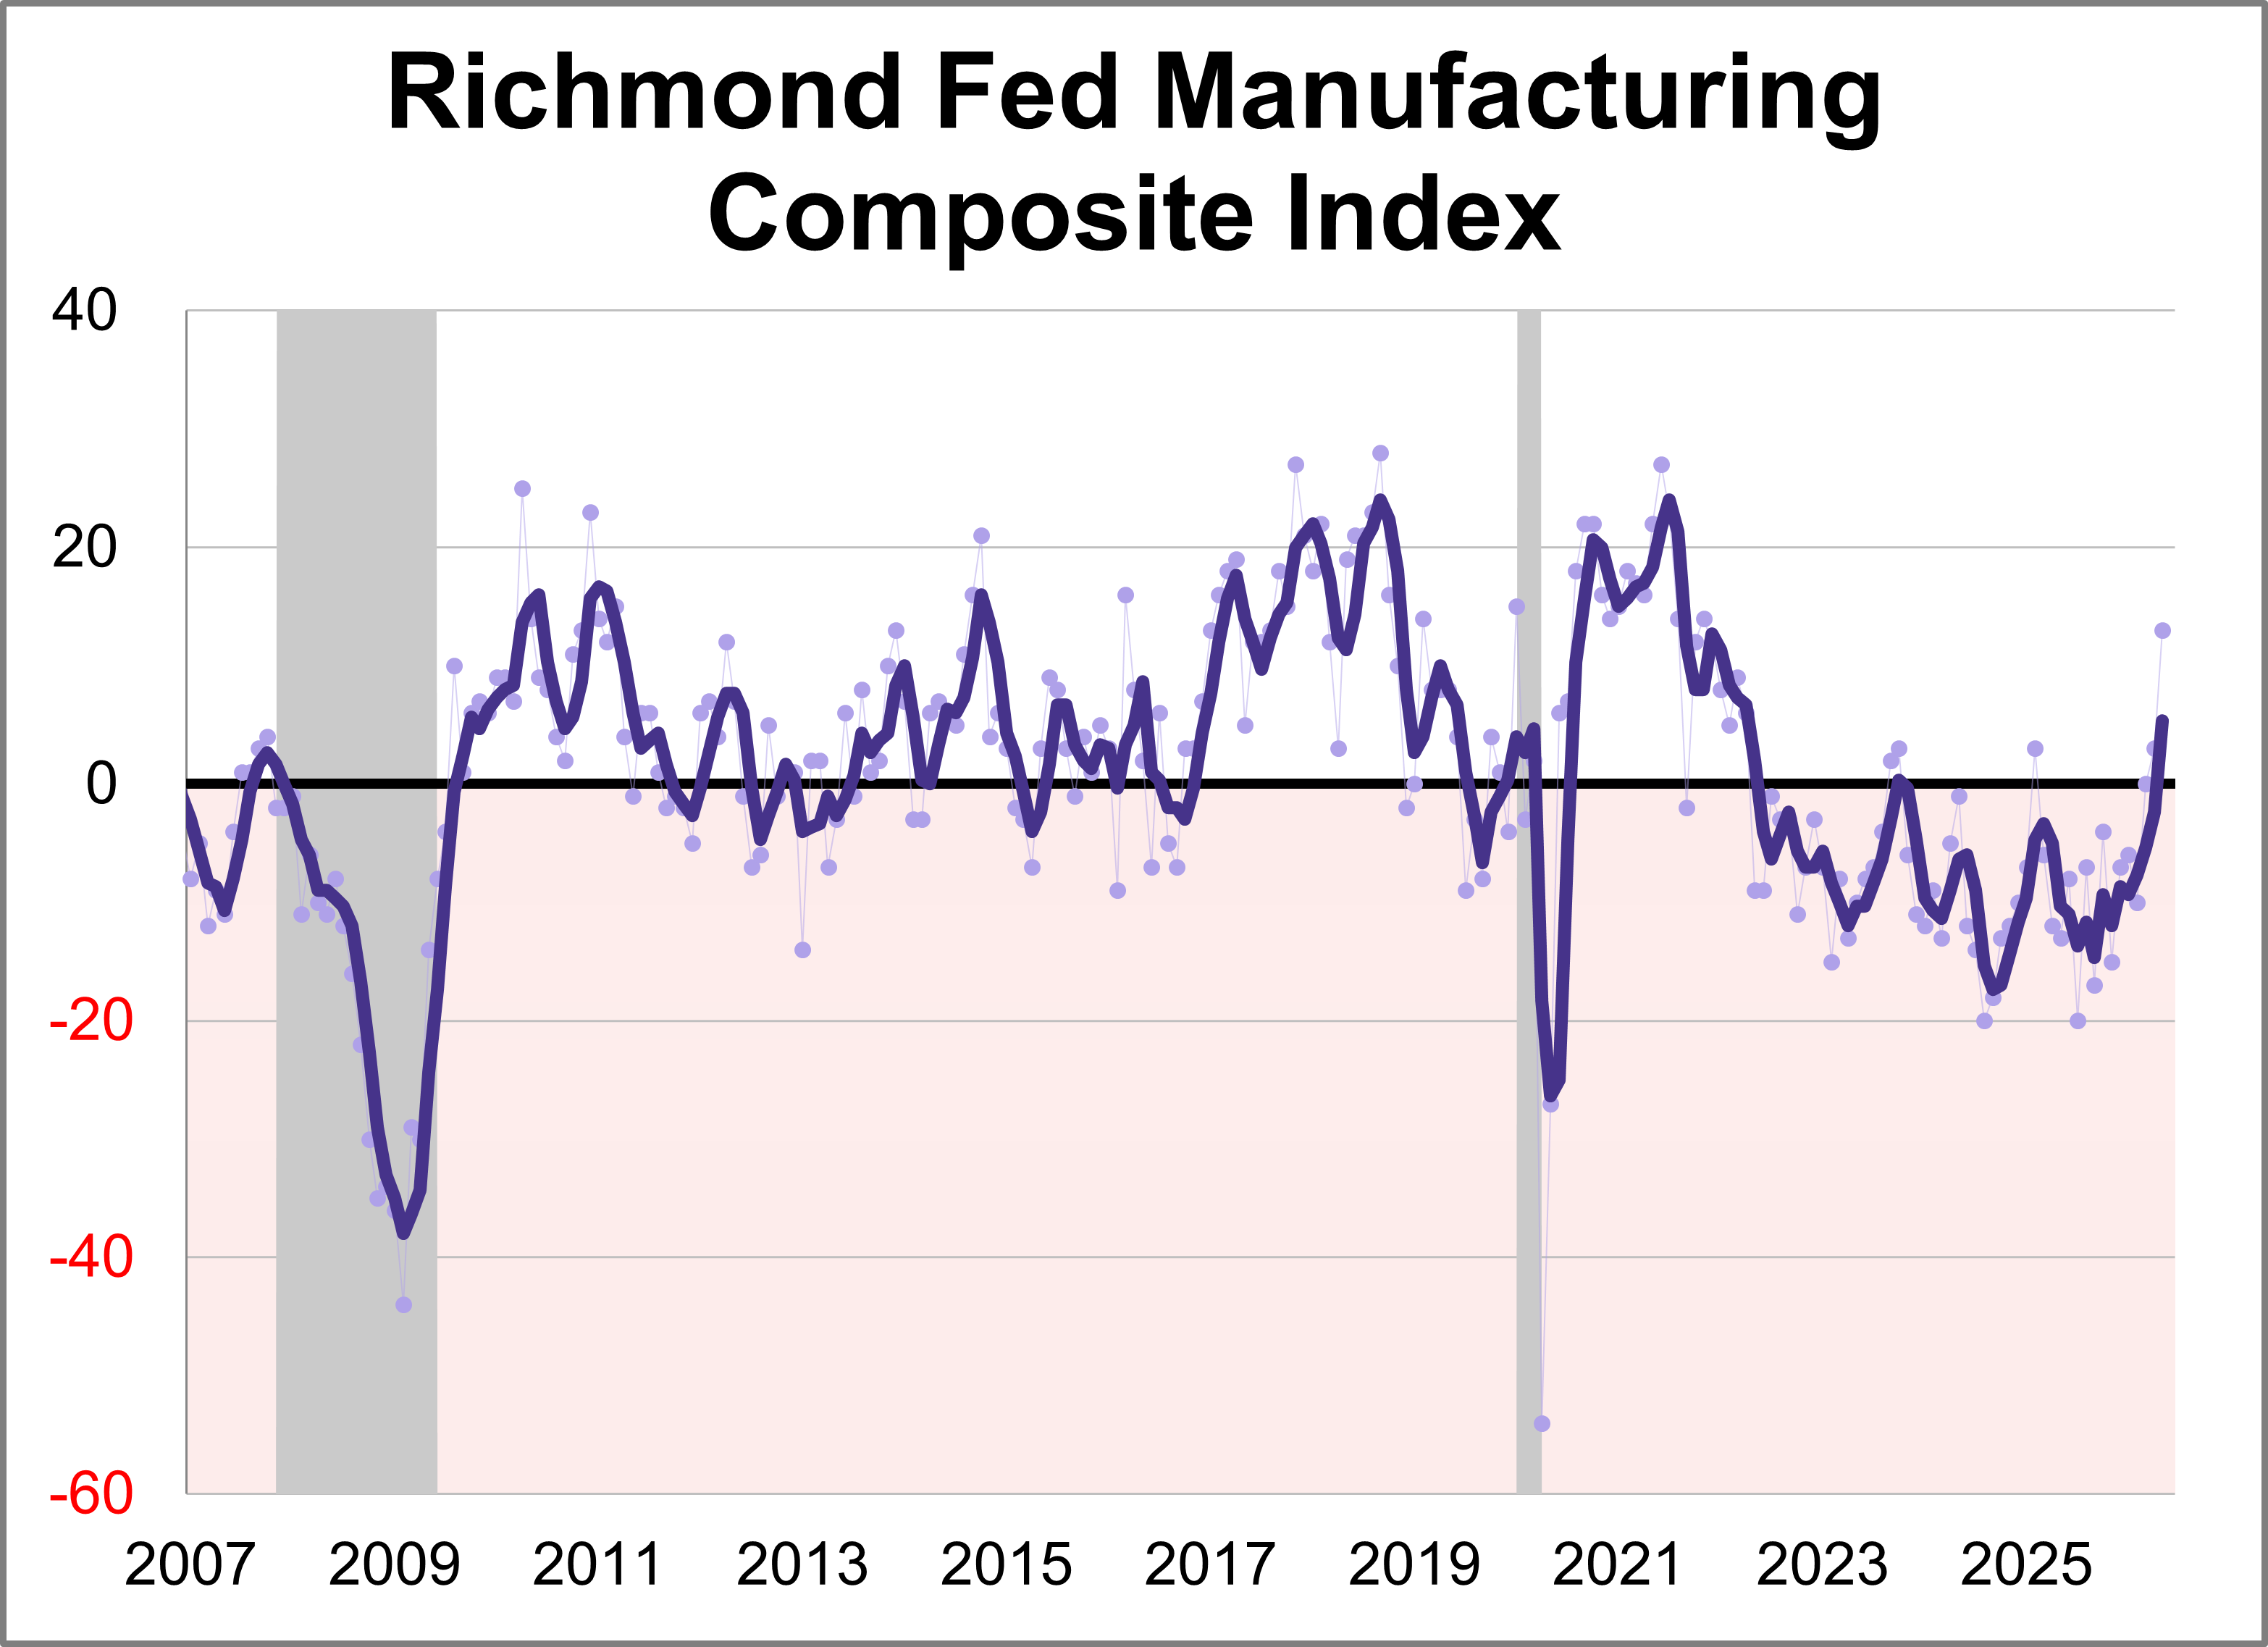
Fifth district manufacturing activity increased in May according to the most recent survey from the Federal Reserve Bank of Richmond. The composite manufacturing index rose ten points points to 13, marking the highest level in nearly five years. This month's reading was above the forecast of 4.
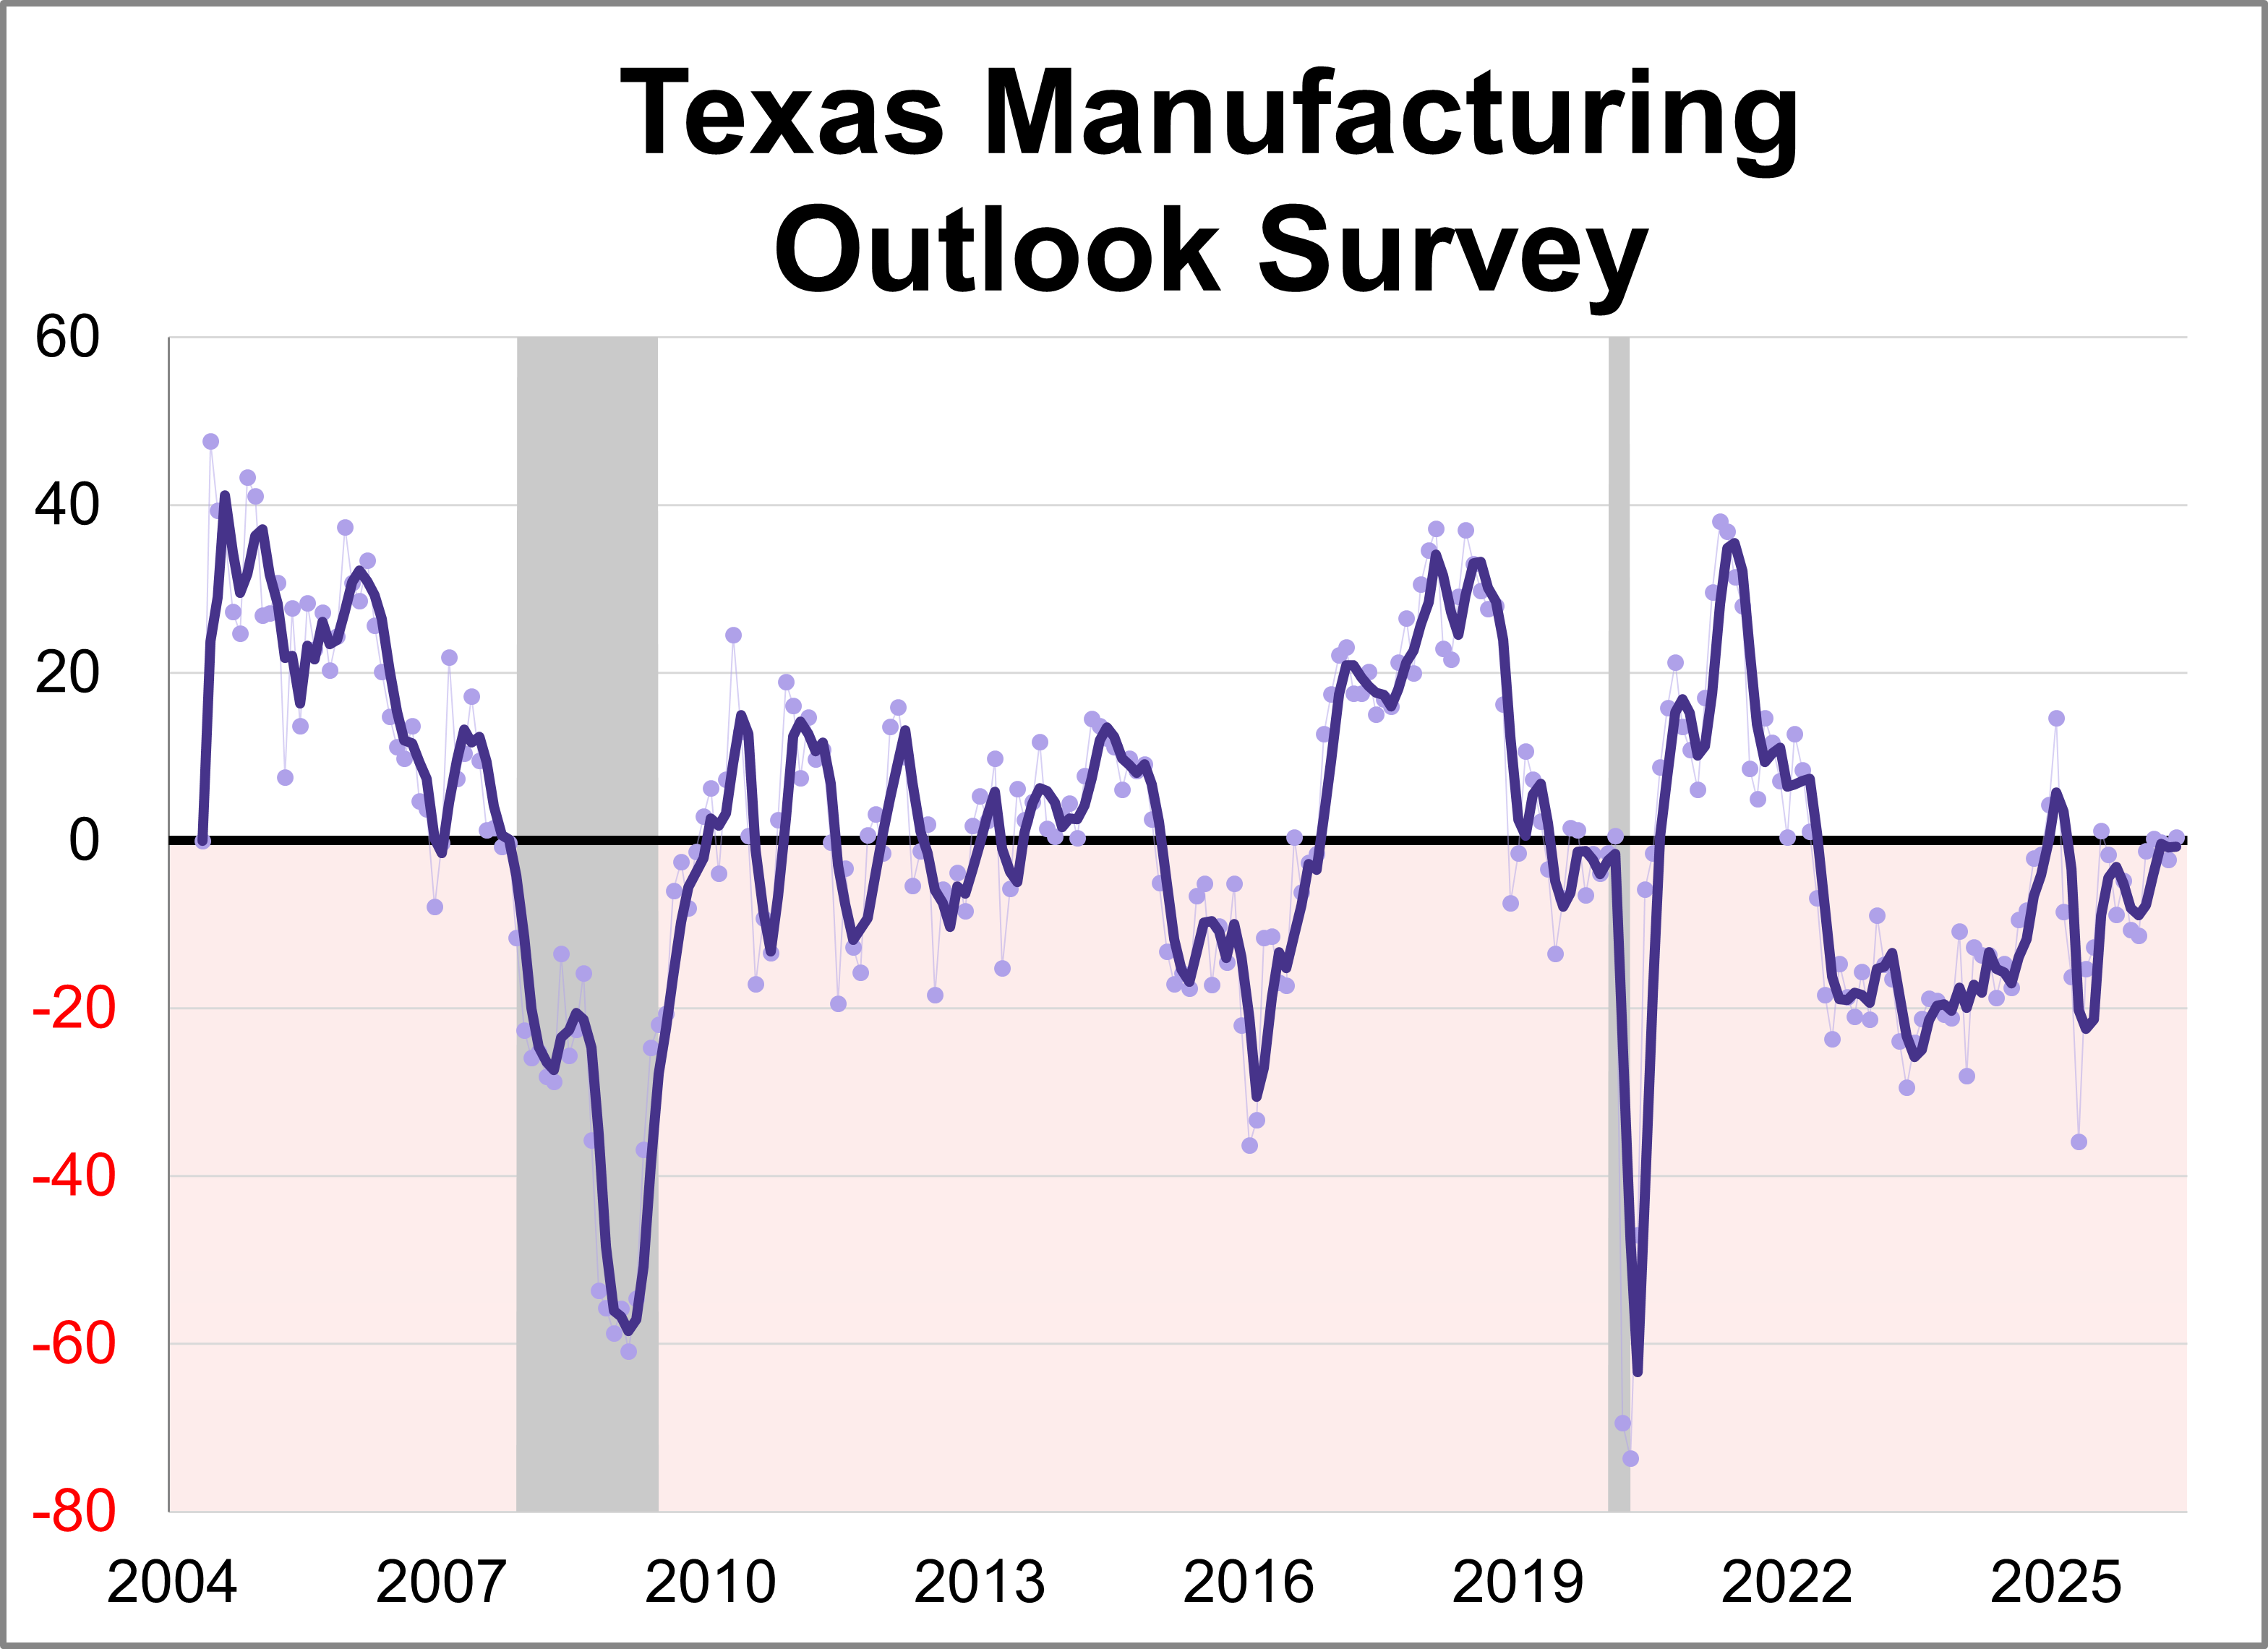
The Dallas Fed released its Texas Manufacturing Outlook Survey (TMOS) for May. The general business activity index rose 2.7 points to 0.4, indicating slower growth of manufacturing activity and stable business conditions perceptions.
Home prices fell for the first time in eight months in March according to the S&P Cotality Case-Shiller index, as the housing slowdown intensifies. On a seasonally adjusted basis, the national index dropped 0.2% month-over-month and was up 0.7% year-over-year, the slowest pace since June 2023.
There is currently a stark contrast between everyday consumer confidence and financial market behavior. On one hand, persistent inflation and elevated living costs have driven consumer sentiment to historic lows. On the other hand, financial market participants are exhibiting aggressive risk appetite, with margin debt surging to an all-time high record on the heels of major equity market gains.
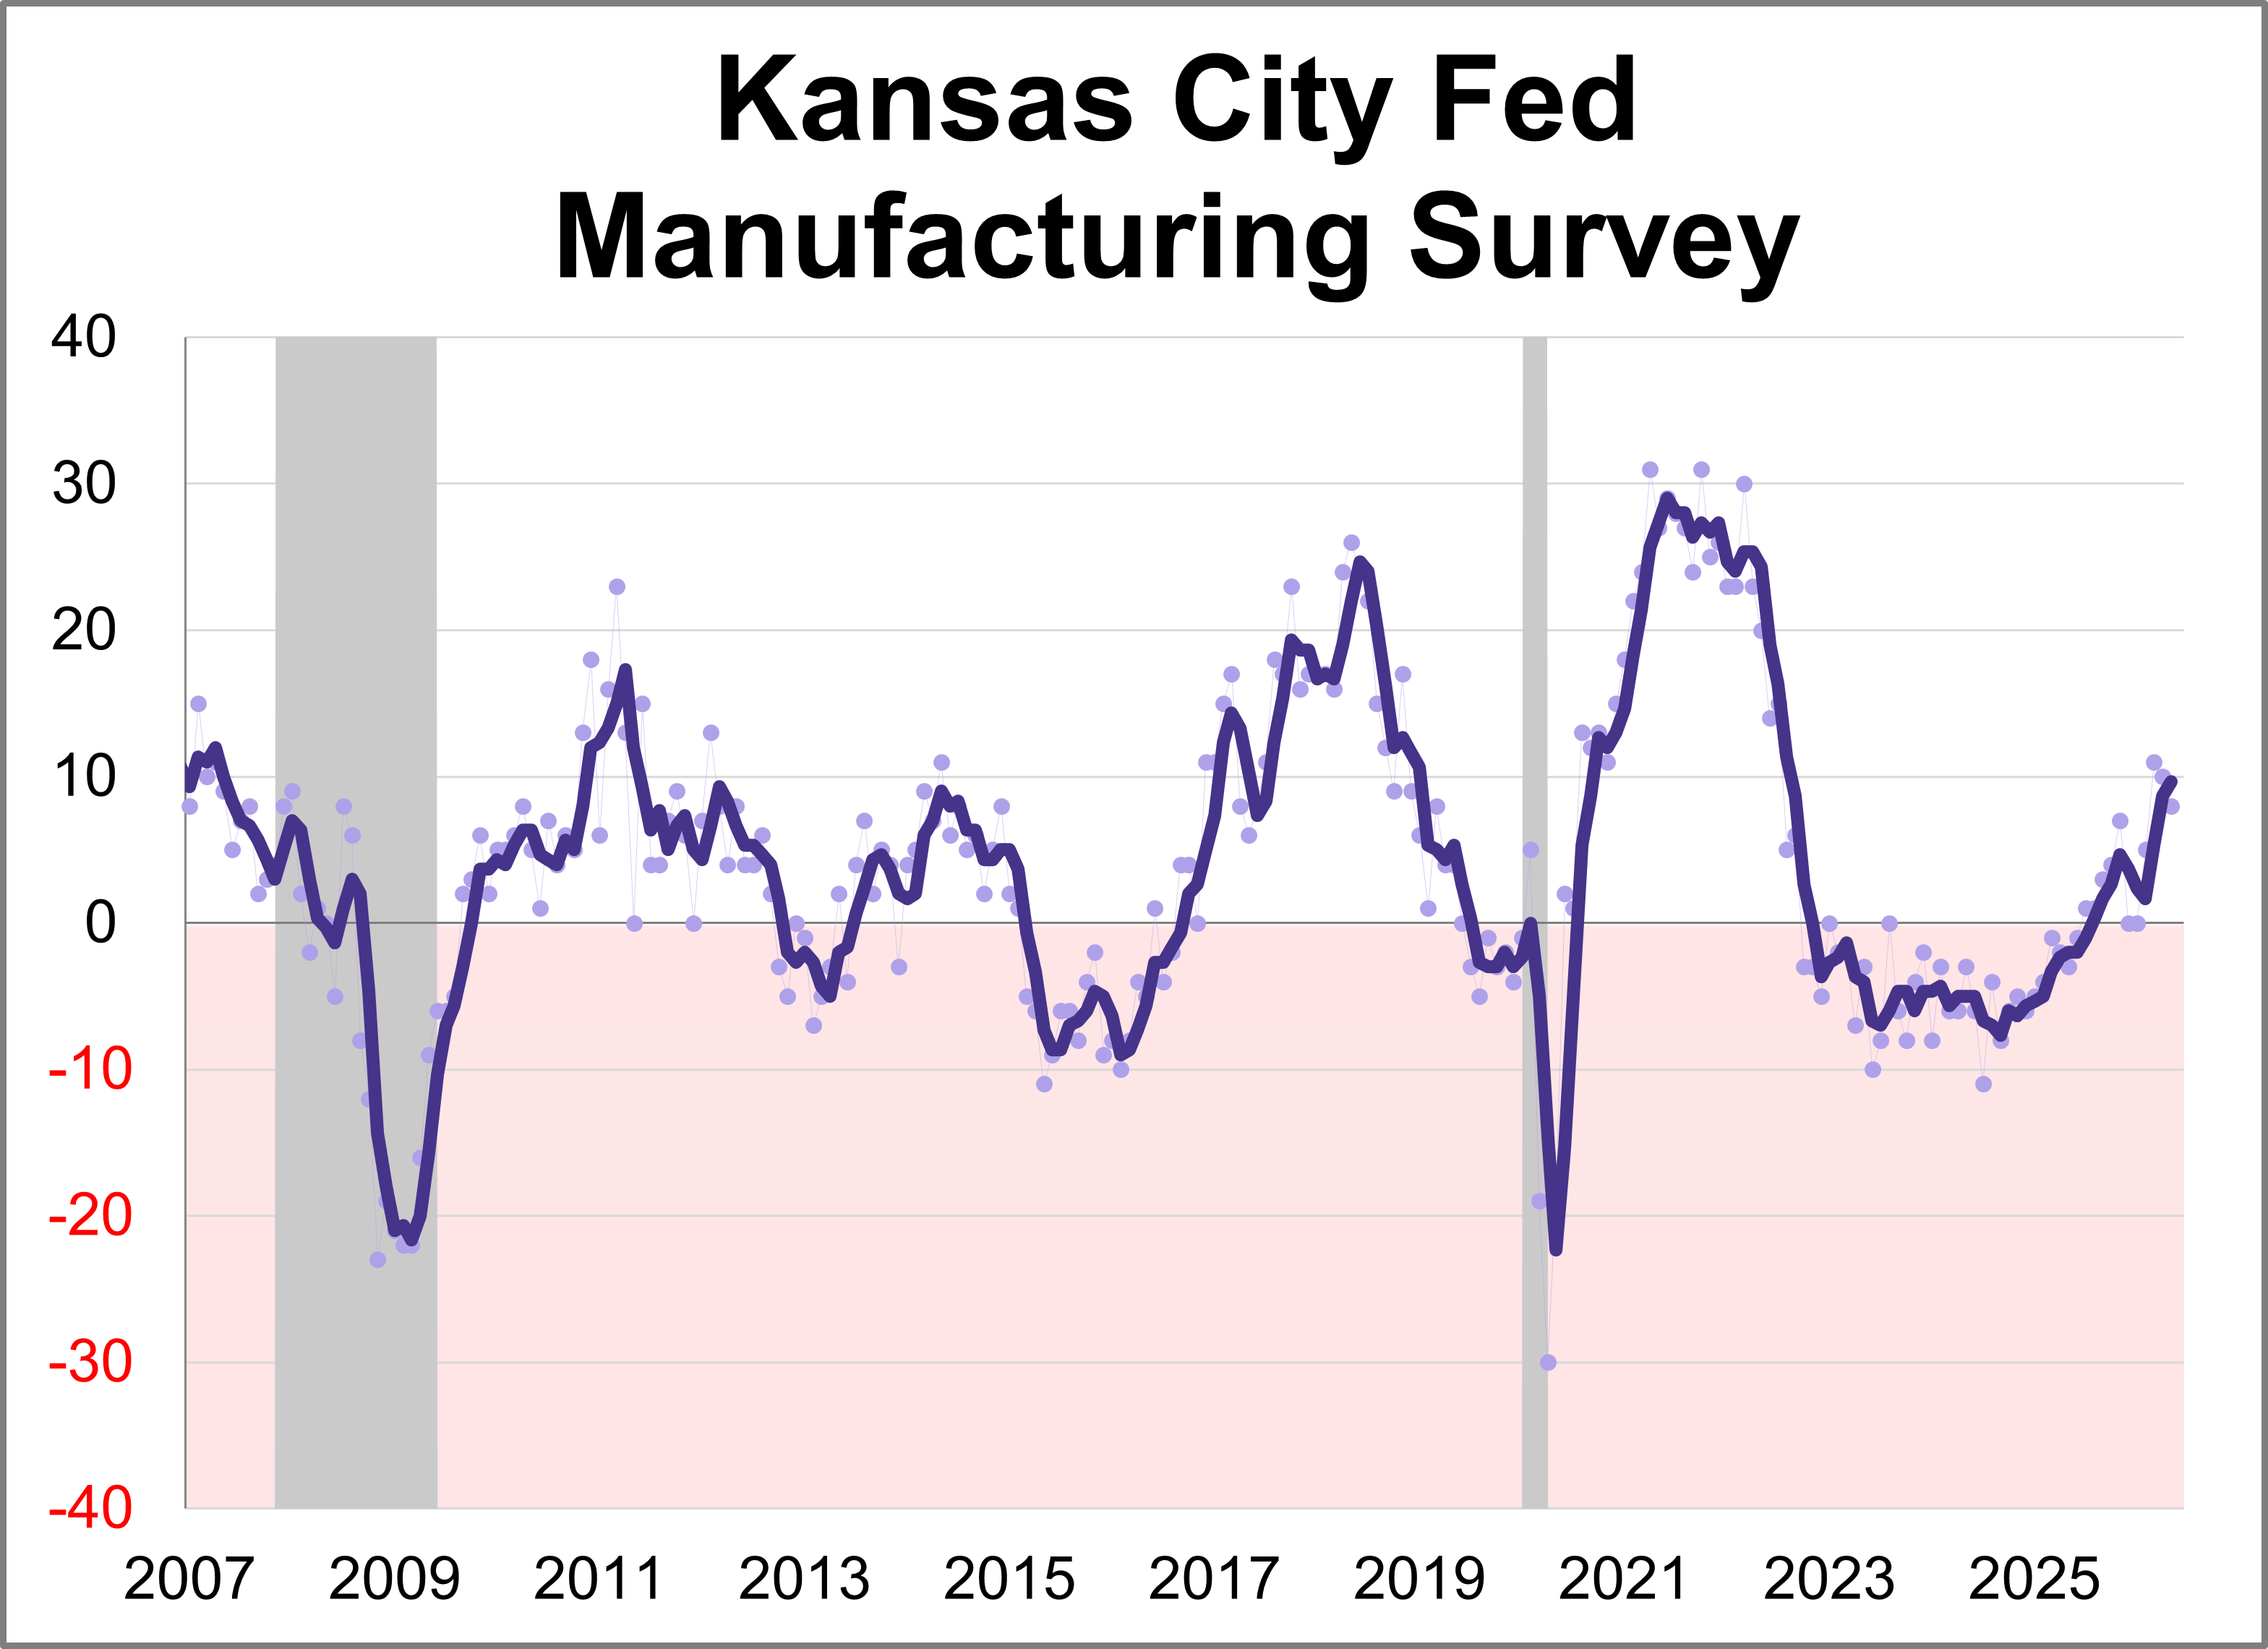
The Kansas City Fed Manufacturing Survey revealed regional activity continued to increase in May. The composite index came in at 8 this month, down slightly from 10 in April but still indicating continued expansion.
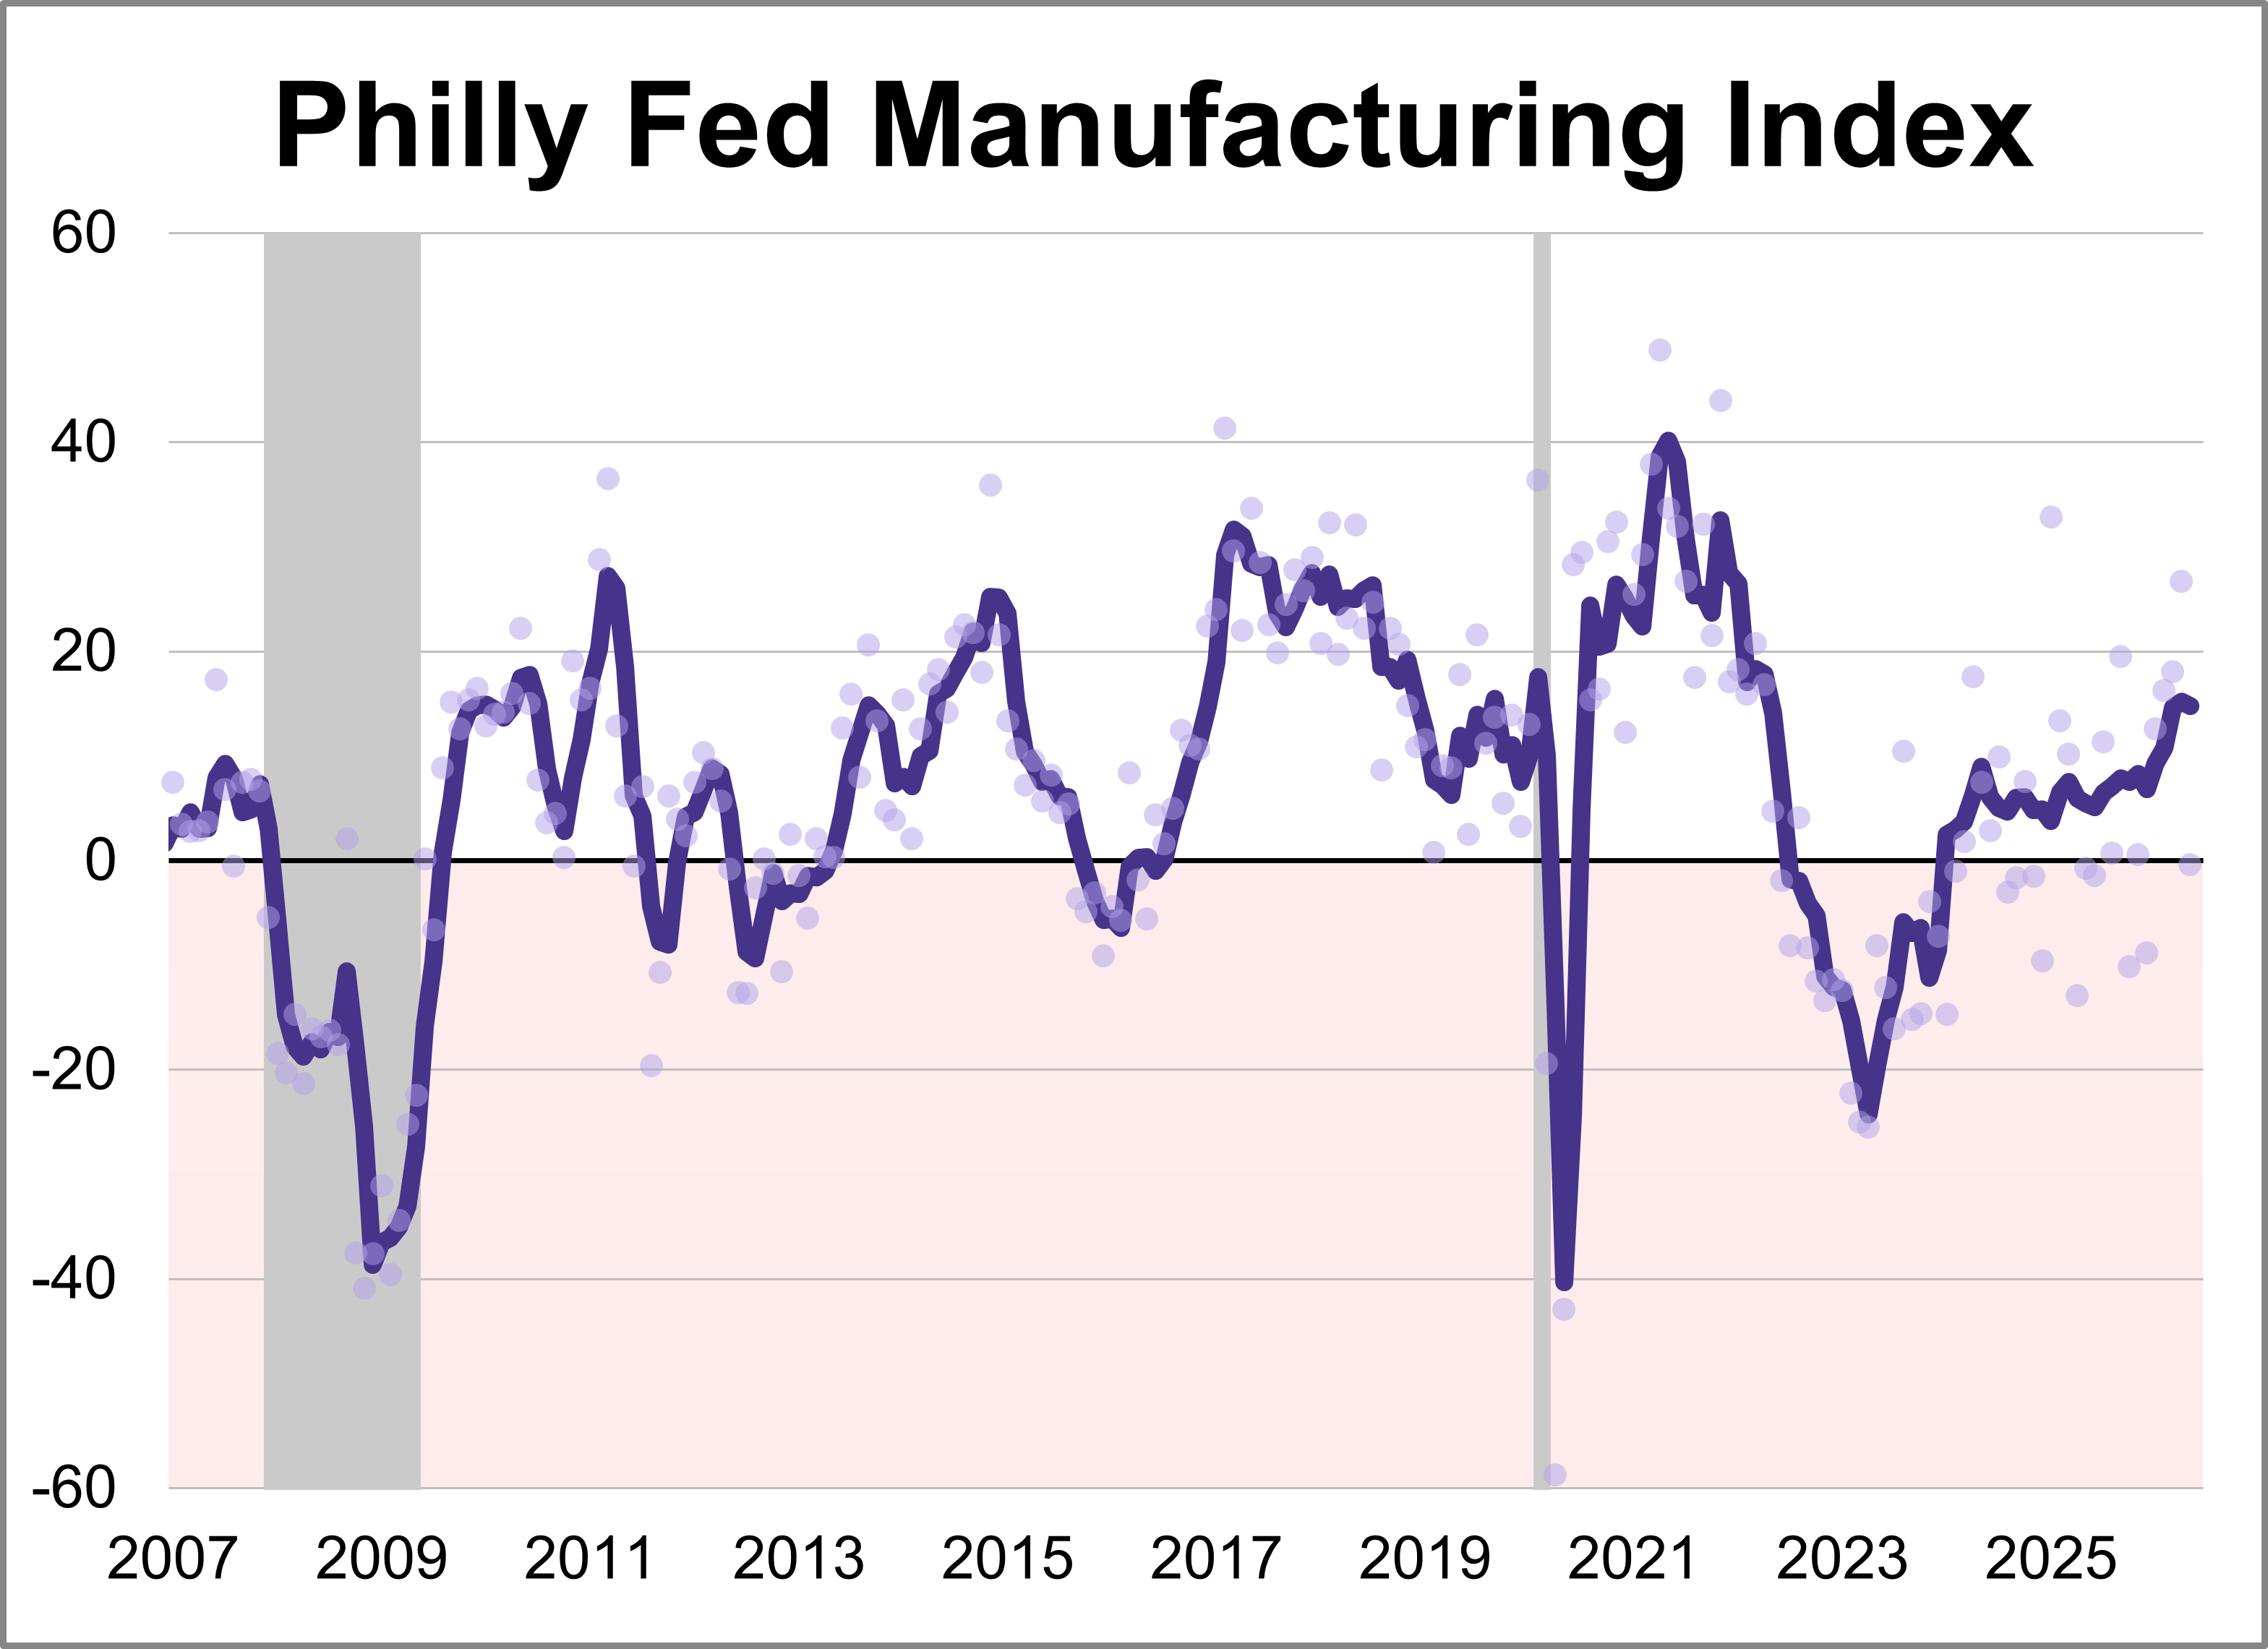
The latest Philadelphia Fed manufacturing index showed activity weakened in May, with the index sinking 27.1 points to -0.4. The latest reading marked the lowest level for the index this year and was worse than the forecast of 17.6.
As inflation lingers and market dynamics shift, advisors are rethinking the 60/40 portfolio with managed futures and options income ETFs.
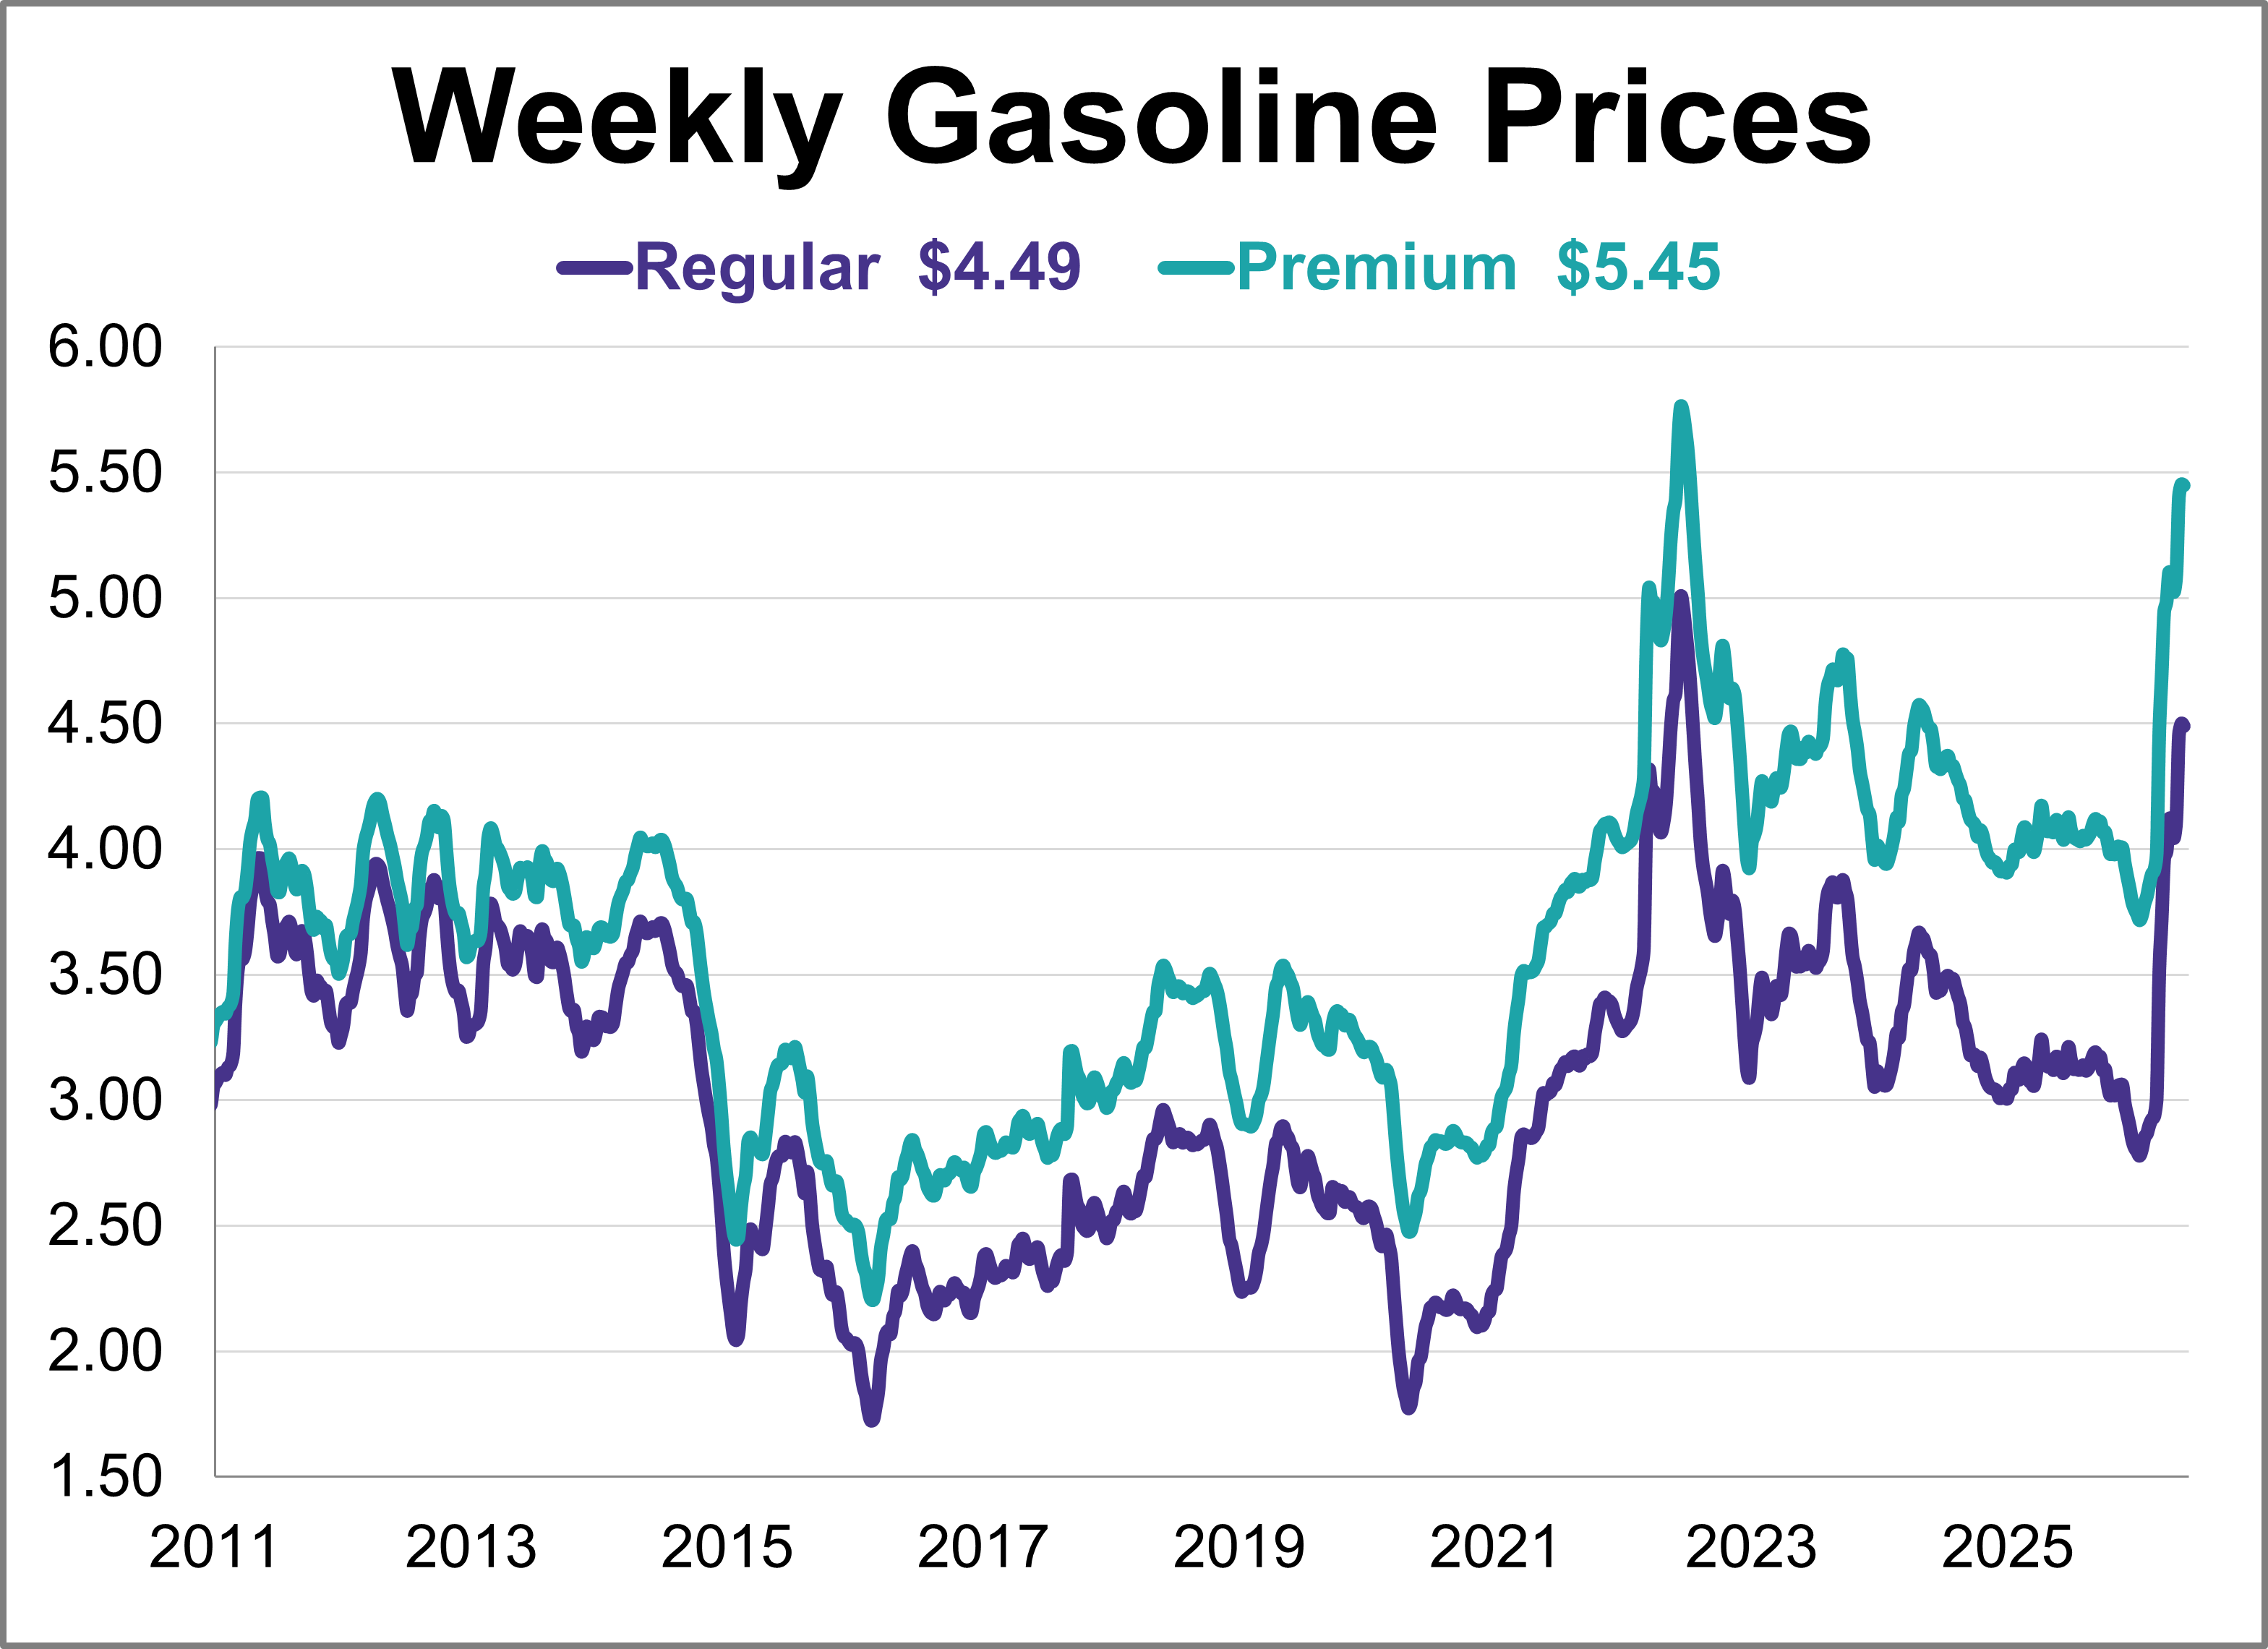
Gas prices were relatively flat this week, remaining at their highest level in nearly four years. As of May 18th, weekly prices were down 1 cent for regular and were unchanged for premium.
The U.S. economic landscape in April was defined by a significant rebound in inflation across both consumer and wholesale sectors, complicating the path for future monetary policy.
Explore how Women in ETFs & CFAOC experts believe AI will supplement, not replace, financial professionals.
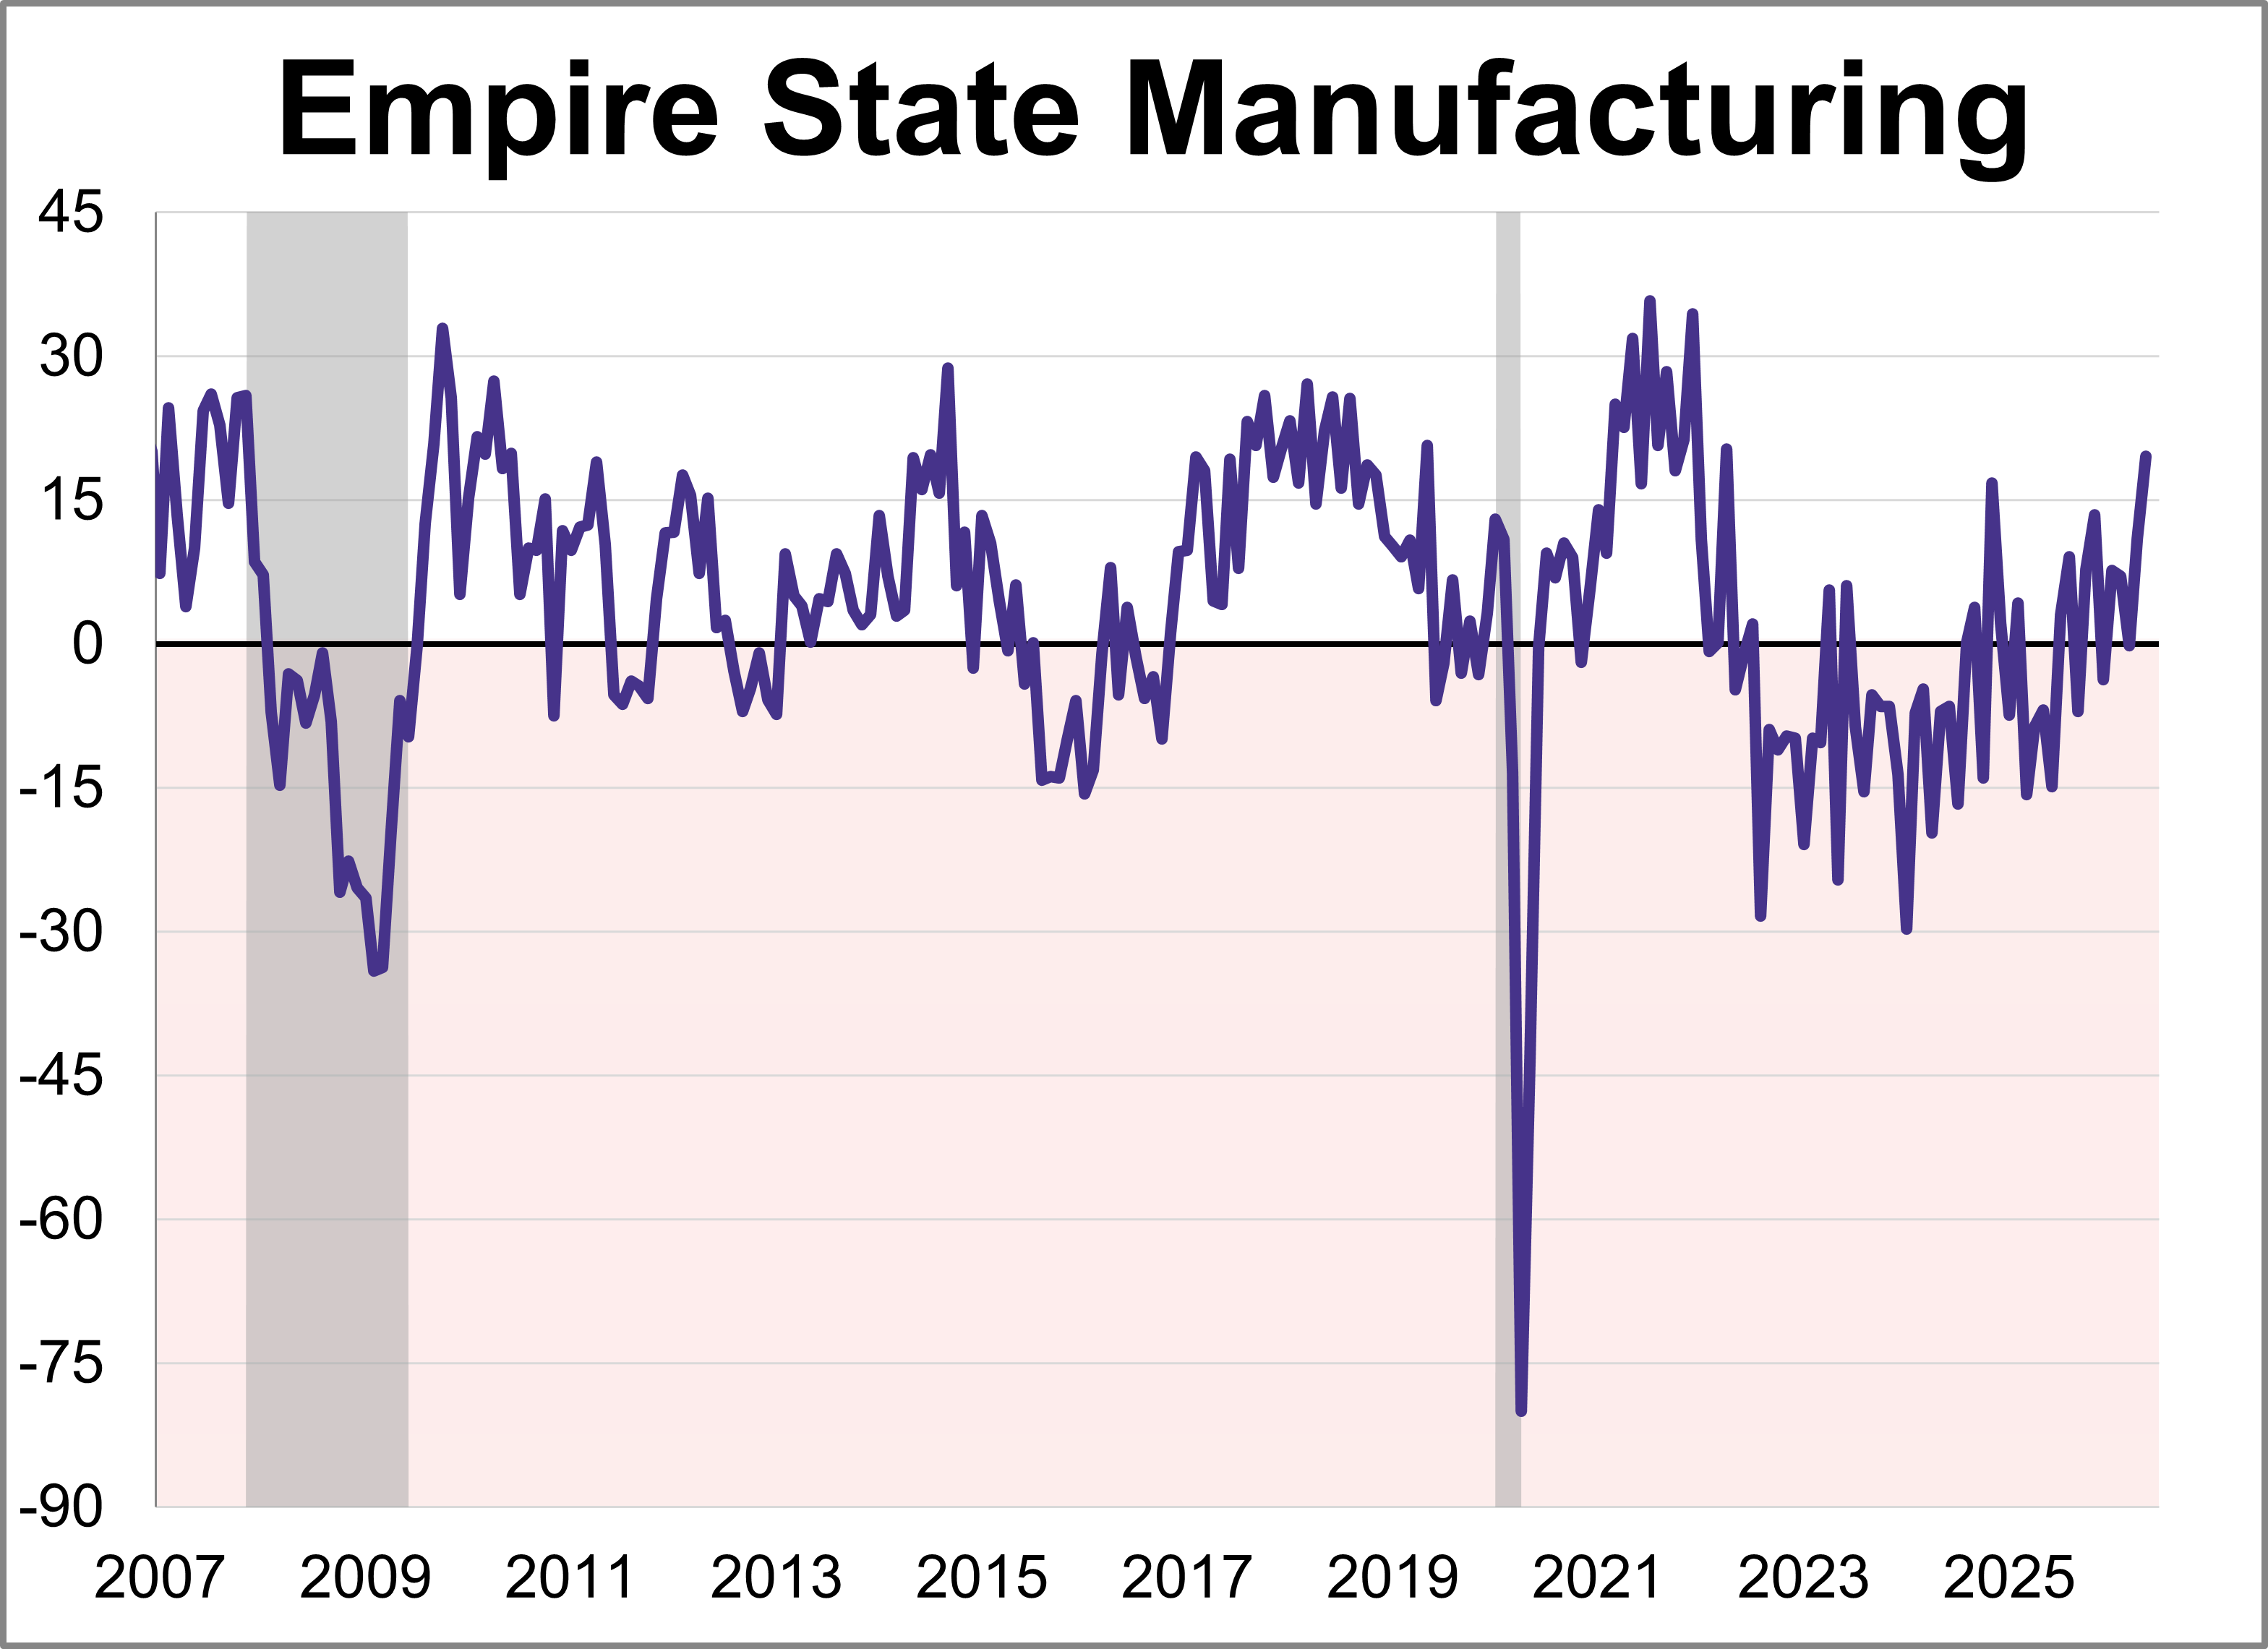
Manufacturing activity grew strongly in New York State, according to the Empire State Manufacturing May survey. The diffusion index for General Business Conditions rose 8.6 points to 19.6, its highest level in over four years.
Investors and advisors often seek private equity, but they are frequently thwarted by liquidity and other issues.
Addressing common 529 Savings Plan concerns and how recent legislative updates have broadened the 529 scope.
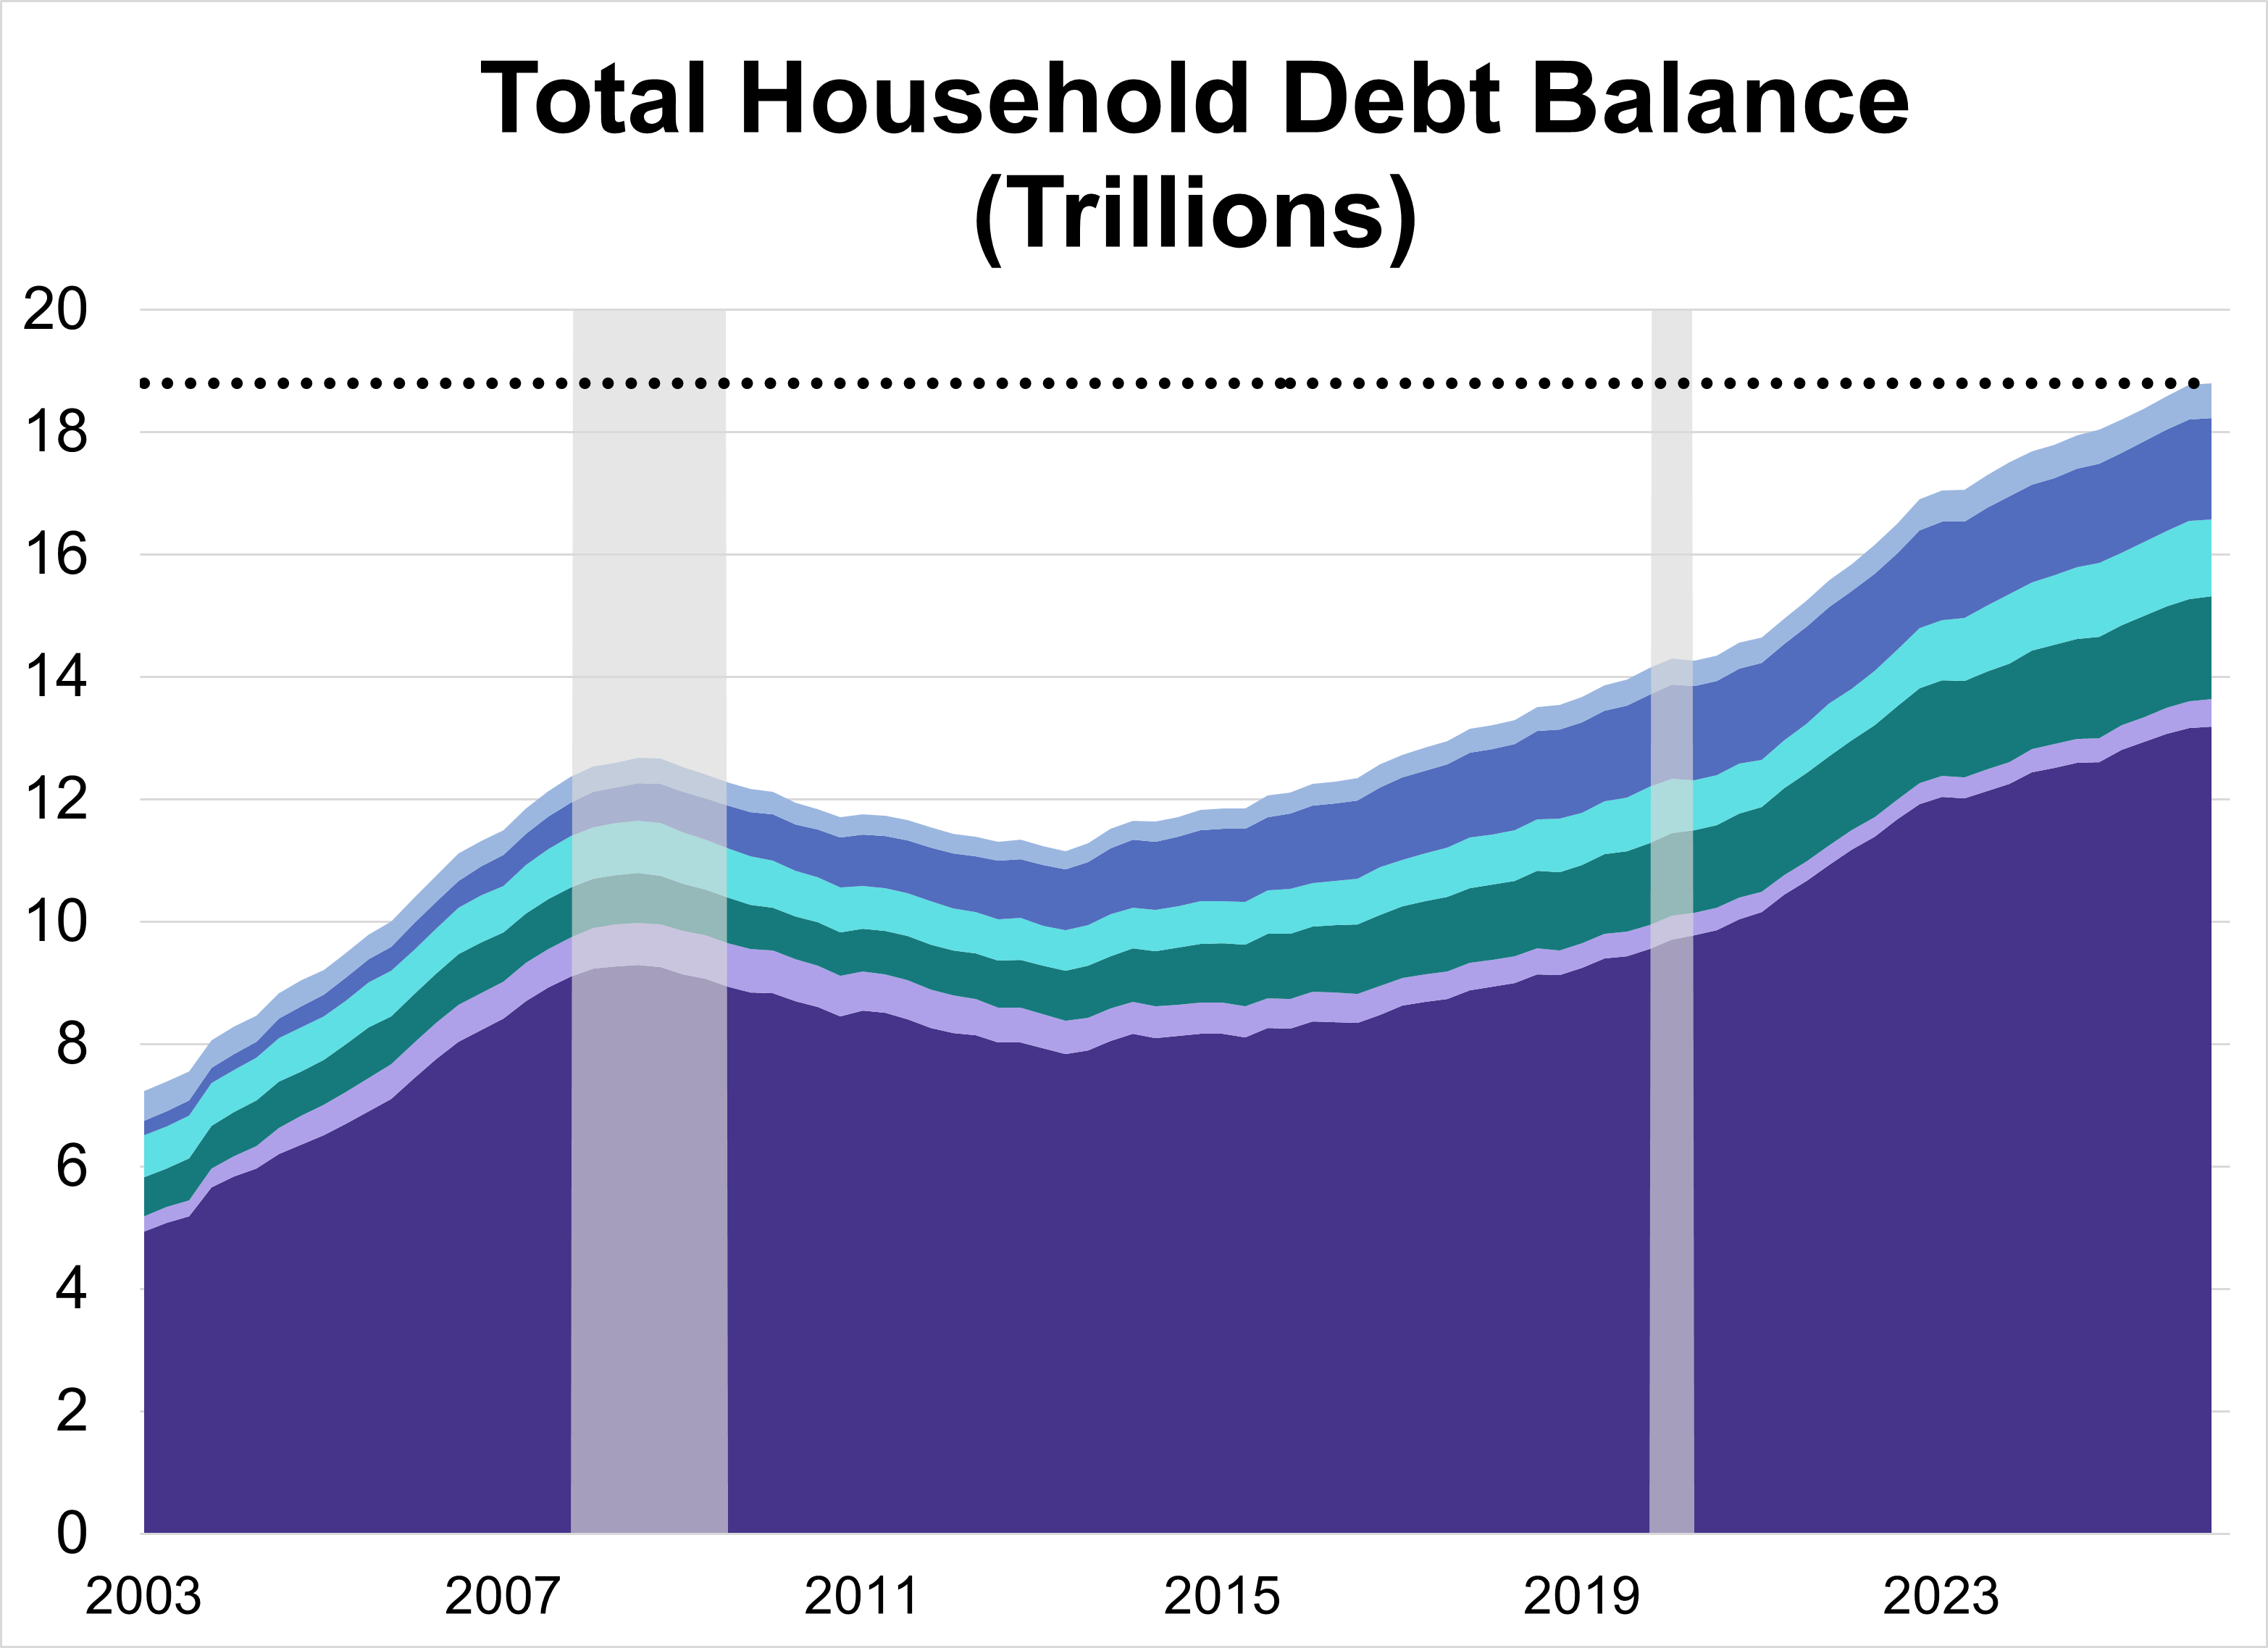
Total U.S. household debt climbed to a record $18.79 trillion in Q1 2026, a modest 0.1% ($18 billion) increase from the previous quarter. The overall rise was driven by increases across a handful of categories, specifically mortgage and auto loan balances.
Munis may have struggled a bit in March, but the long-term environment for these bonds remains full of potential.
Explore the new 529 rules, including Roth IRA rollovers, the grandparent loophole, and higher K-12 limits.
The U.S. labor market demonstrated remarkable endurance in April, with job gains outpacing expectations and private sector expansion reaching its strongest point in over a year. As the Federal Reserve maintains a steady interest rate policy, the focus now turns to upcoming inflation and retail data to gauge the sustainability of this momentum.