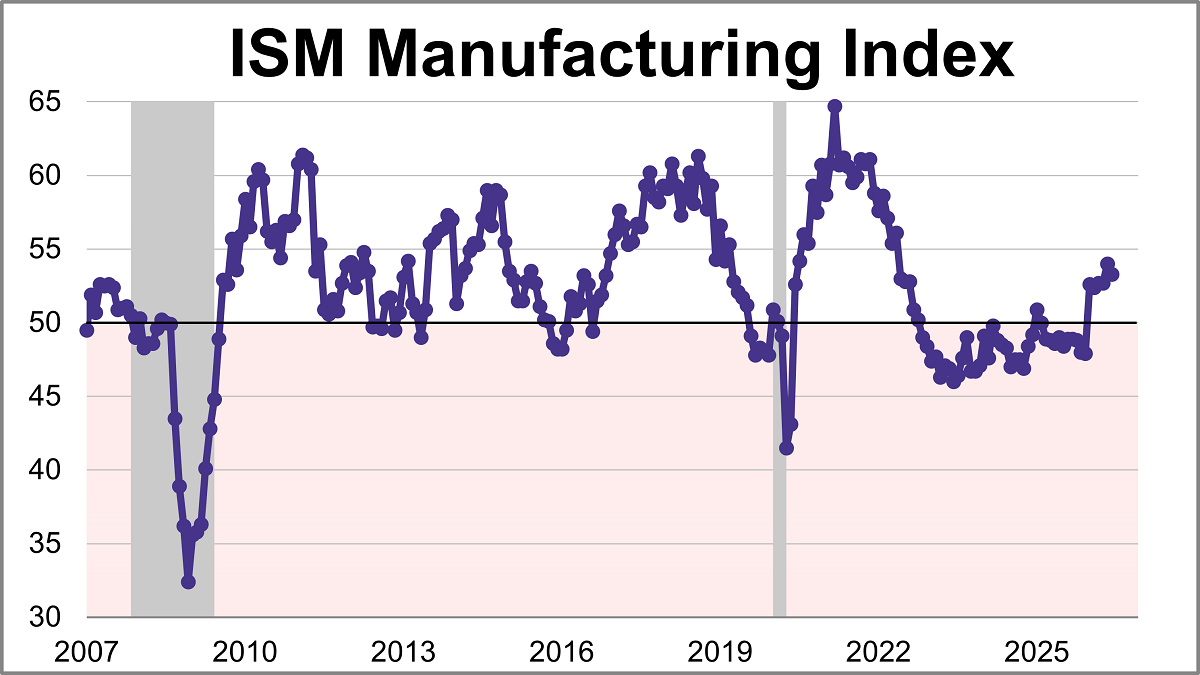
The Institute for Supply Management (ISM) manufacturing purchasing managers index (PMI) came in at 53.3 in June, down from 54.0 in May, marking slightly slower growth. The latest reading was just below the 53.8 forecast and is the index's sixth straight month in expansion territory.
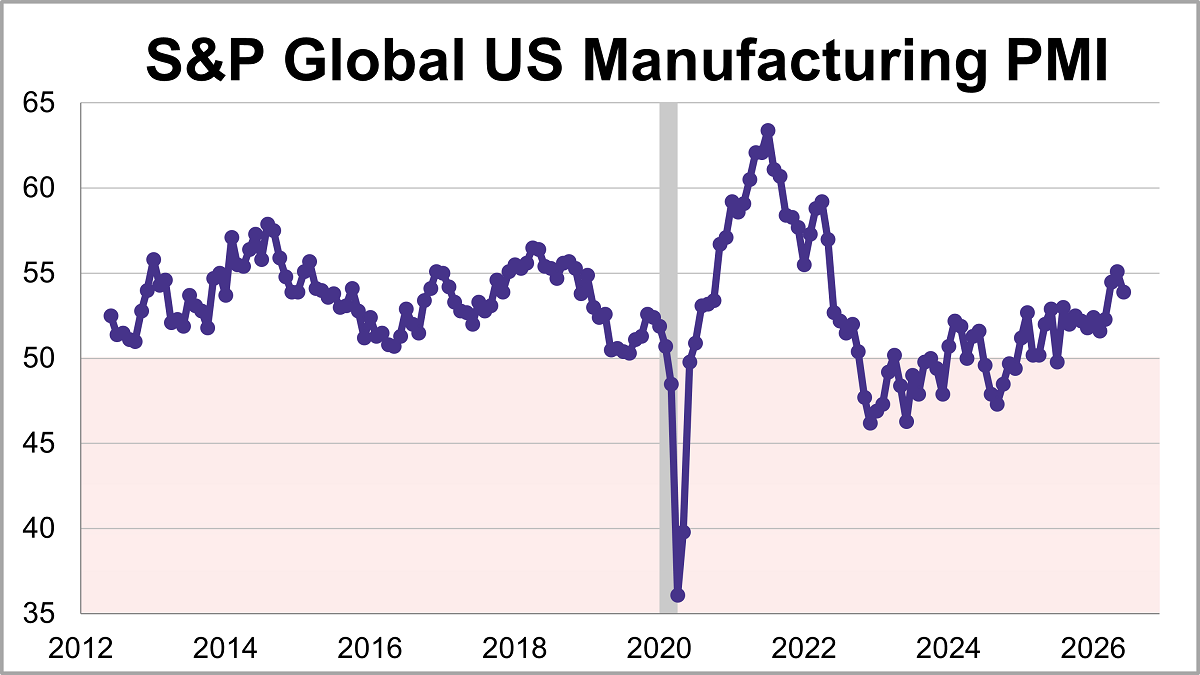
U.S. manufacturing expanded for an eleventh straight month in June but the growth eased to its lowest level in three months. The S&P Global PMI fell 1.2 points to 53.9 last month, falling short of the 55.7 forecast.
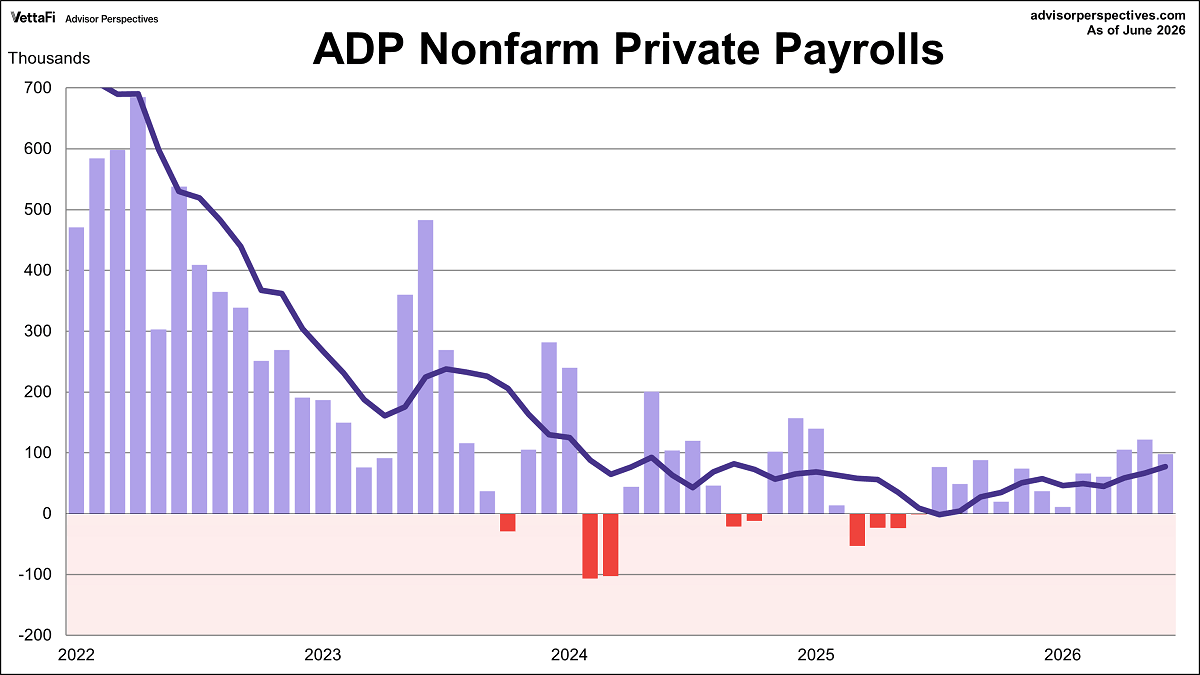
The ADP employment report revealed that 98,000 nonfarm private jobs were added in June, the twelfth straight month of growth. However, the latest figure was below the projected 118,000 addition.
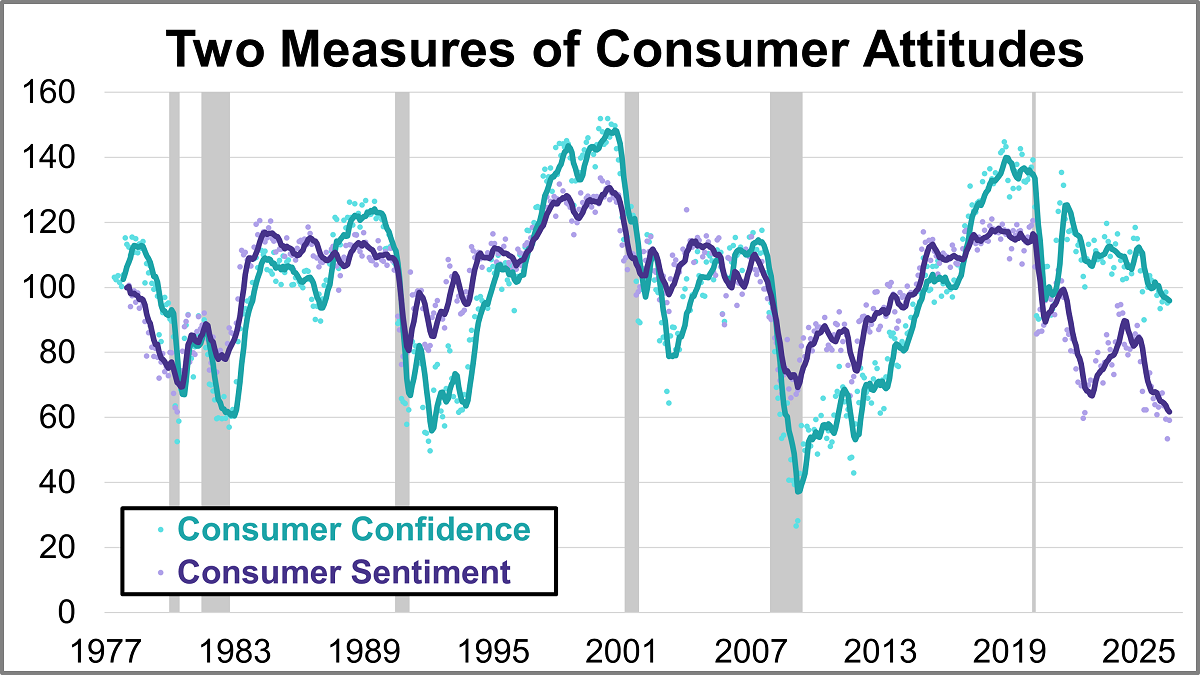
What are consumers thinking about the economy? Their collective mood offers crucial clues for businesses, investors, and policymakers alike. In June, the two leading benchmarks, the University of Michigan’s Consumer Sentiment Index (MCSI) and the Conference Board’s Consumer Confidence Index (CCI), offered similar views with both showing slight improvement despite ongoing inflation concerns.
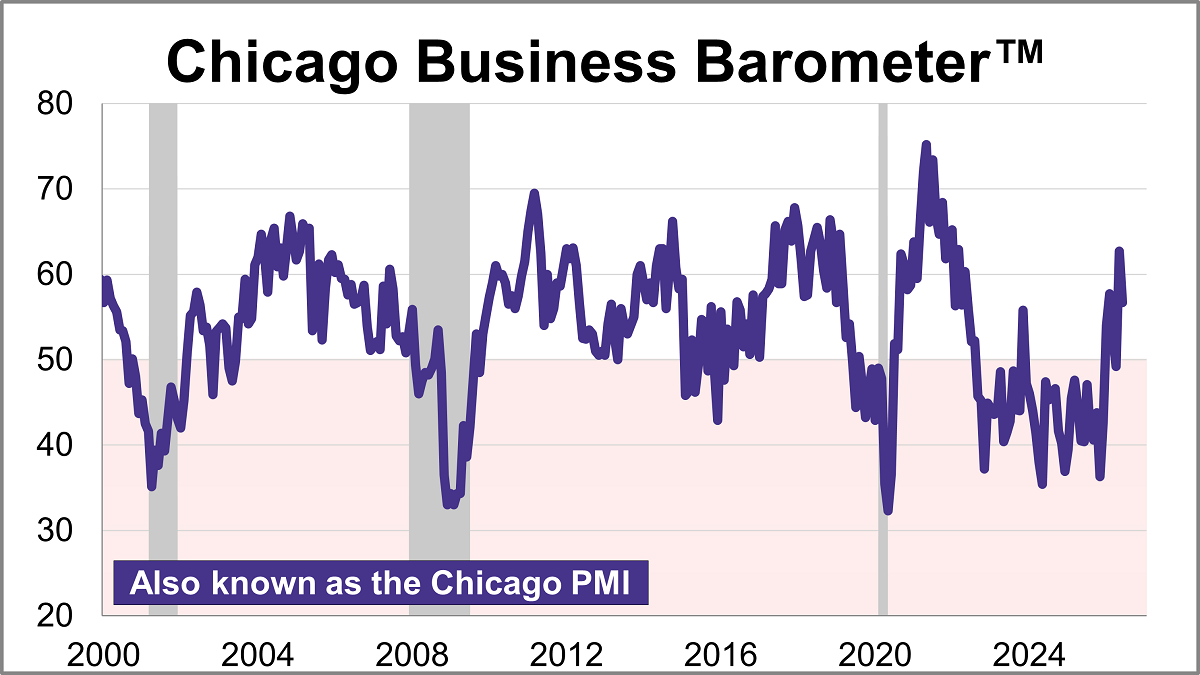
The Chicago Purchasing Managers’ Index cooled 6.0 points in June to 56.7, signaling an expansion in regional business activity for a second straight month. The latest reading was higher than the projected 55.7.
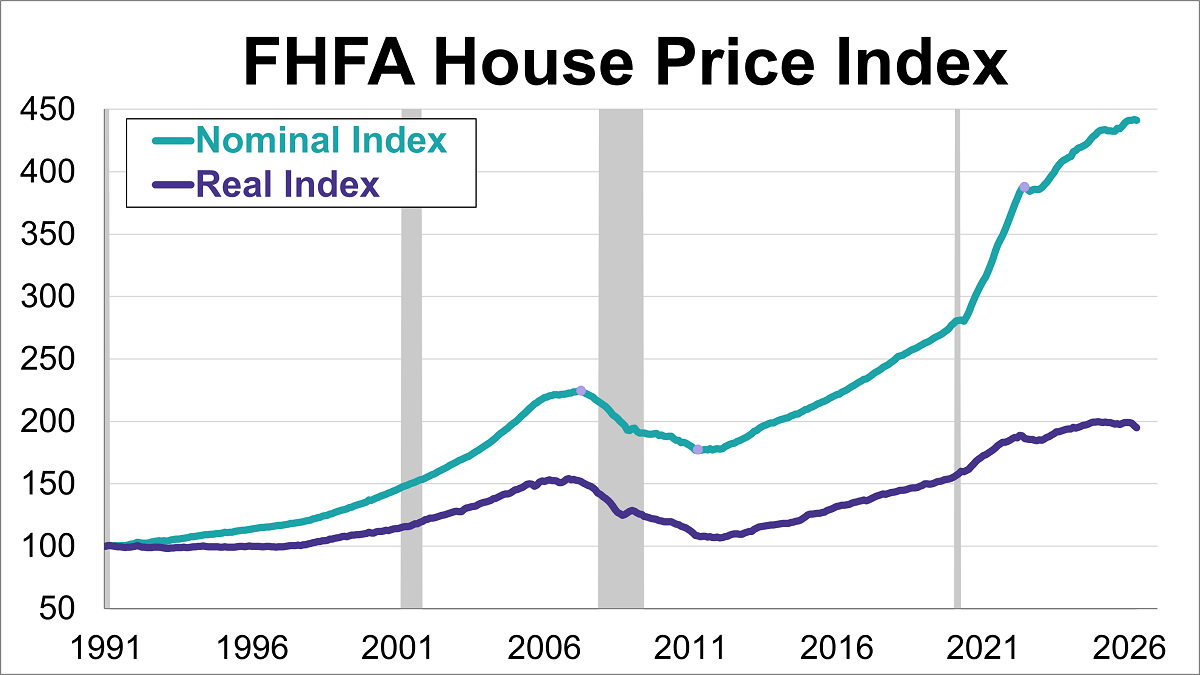
The Federal Housing Finance Agency (FHFA) House Price Index (HPI) retreated in April, falling 0.1% from the previous month's record high to 441.4.
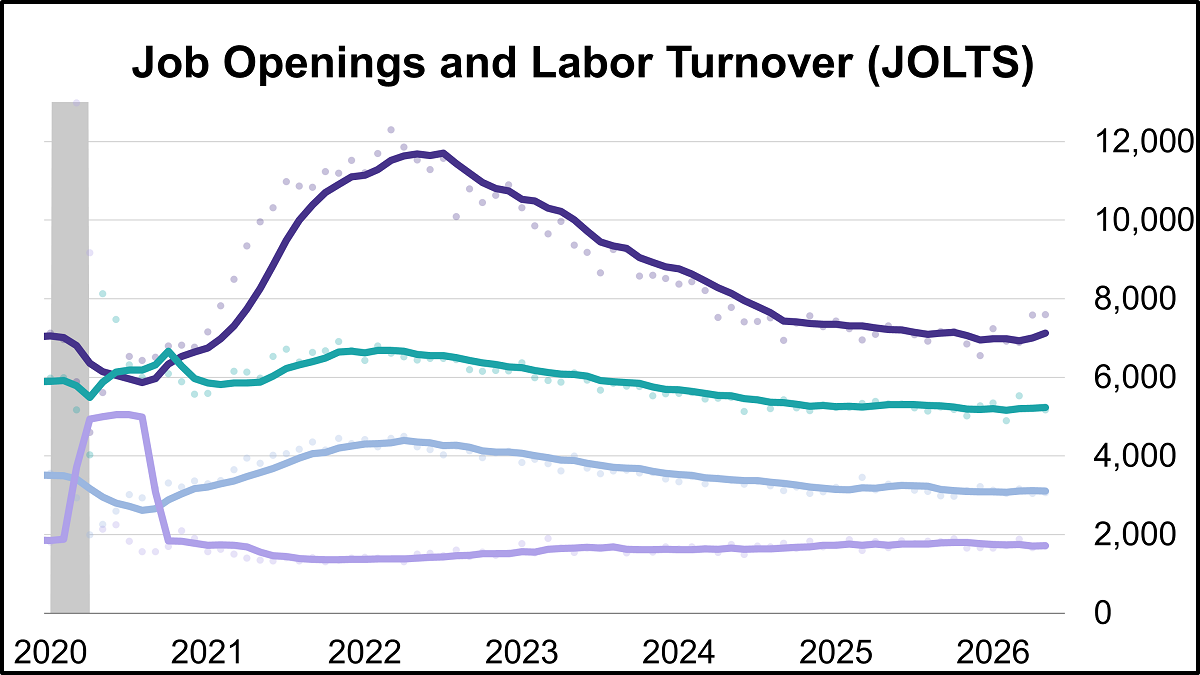
Job openings reached their highest level in two years in May, hitting 7.594 million vacancies according to the latest Job Openings and Labor Turnover Survey (JOLTS). The latest reading was higher than the projected 7.280 million openings.
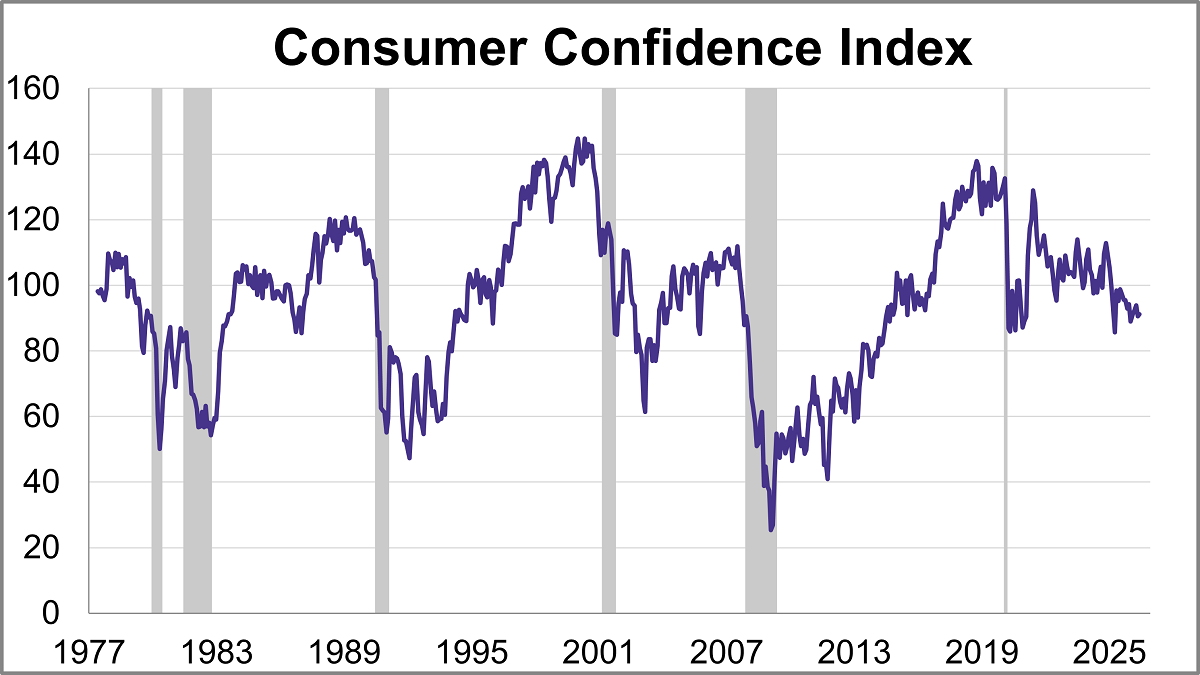
The Conference Board's Consumer Confidence Index® inched up in June, rising 0.6 points to 91.2. Despite the improvement, the index came in below the forecast of 94.4.
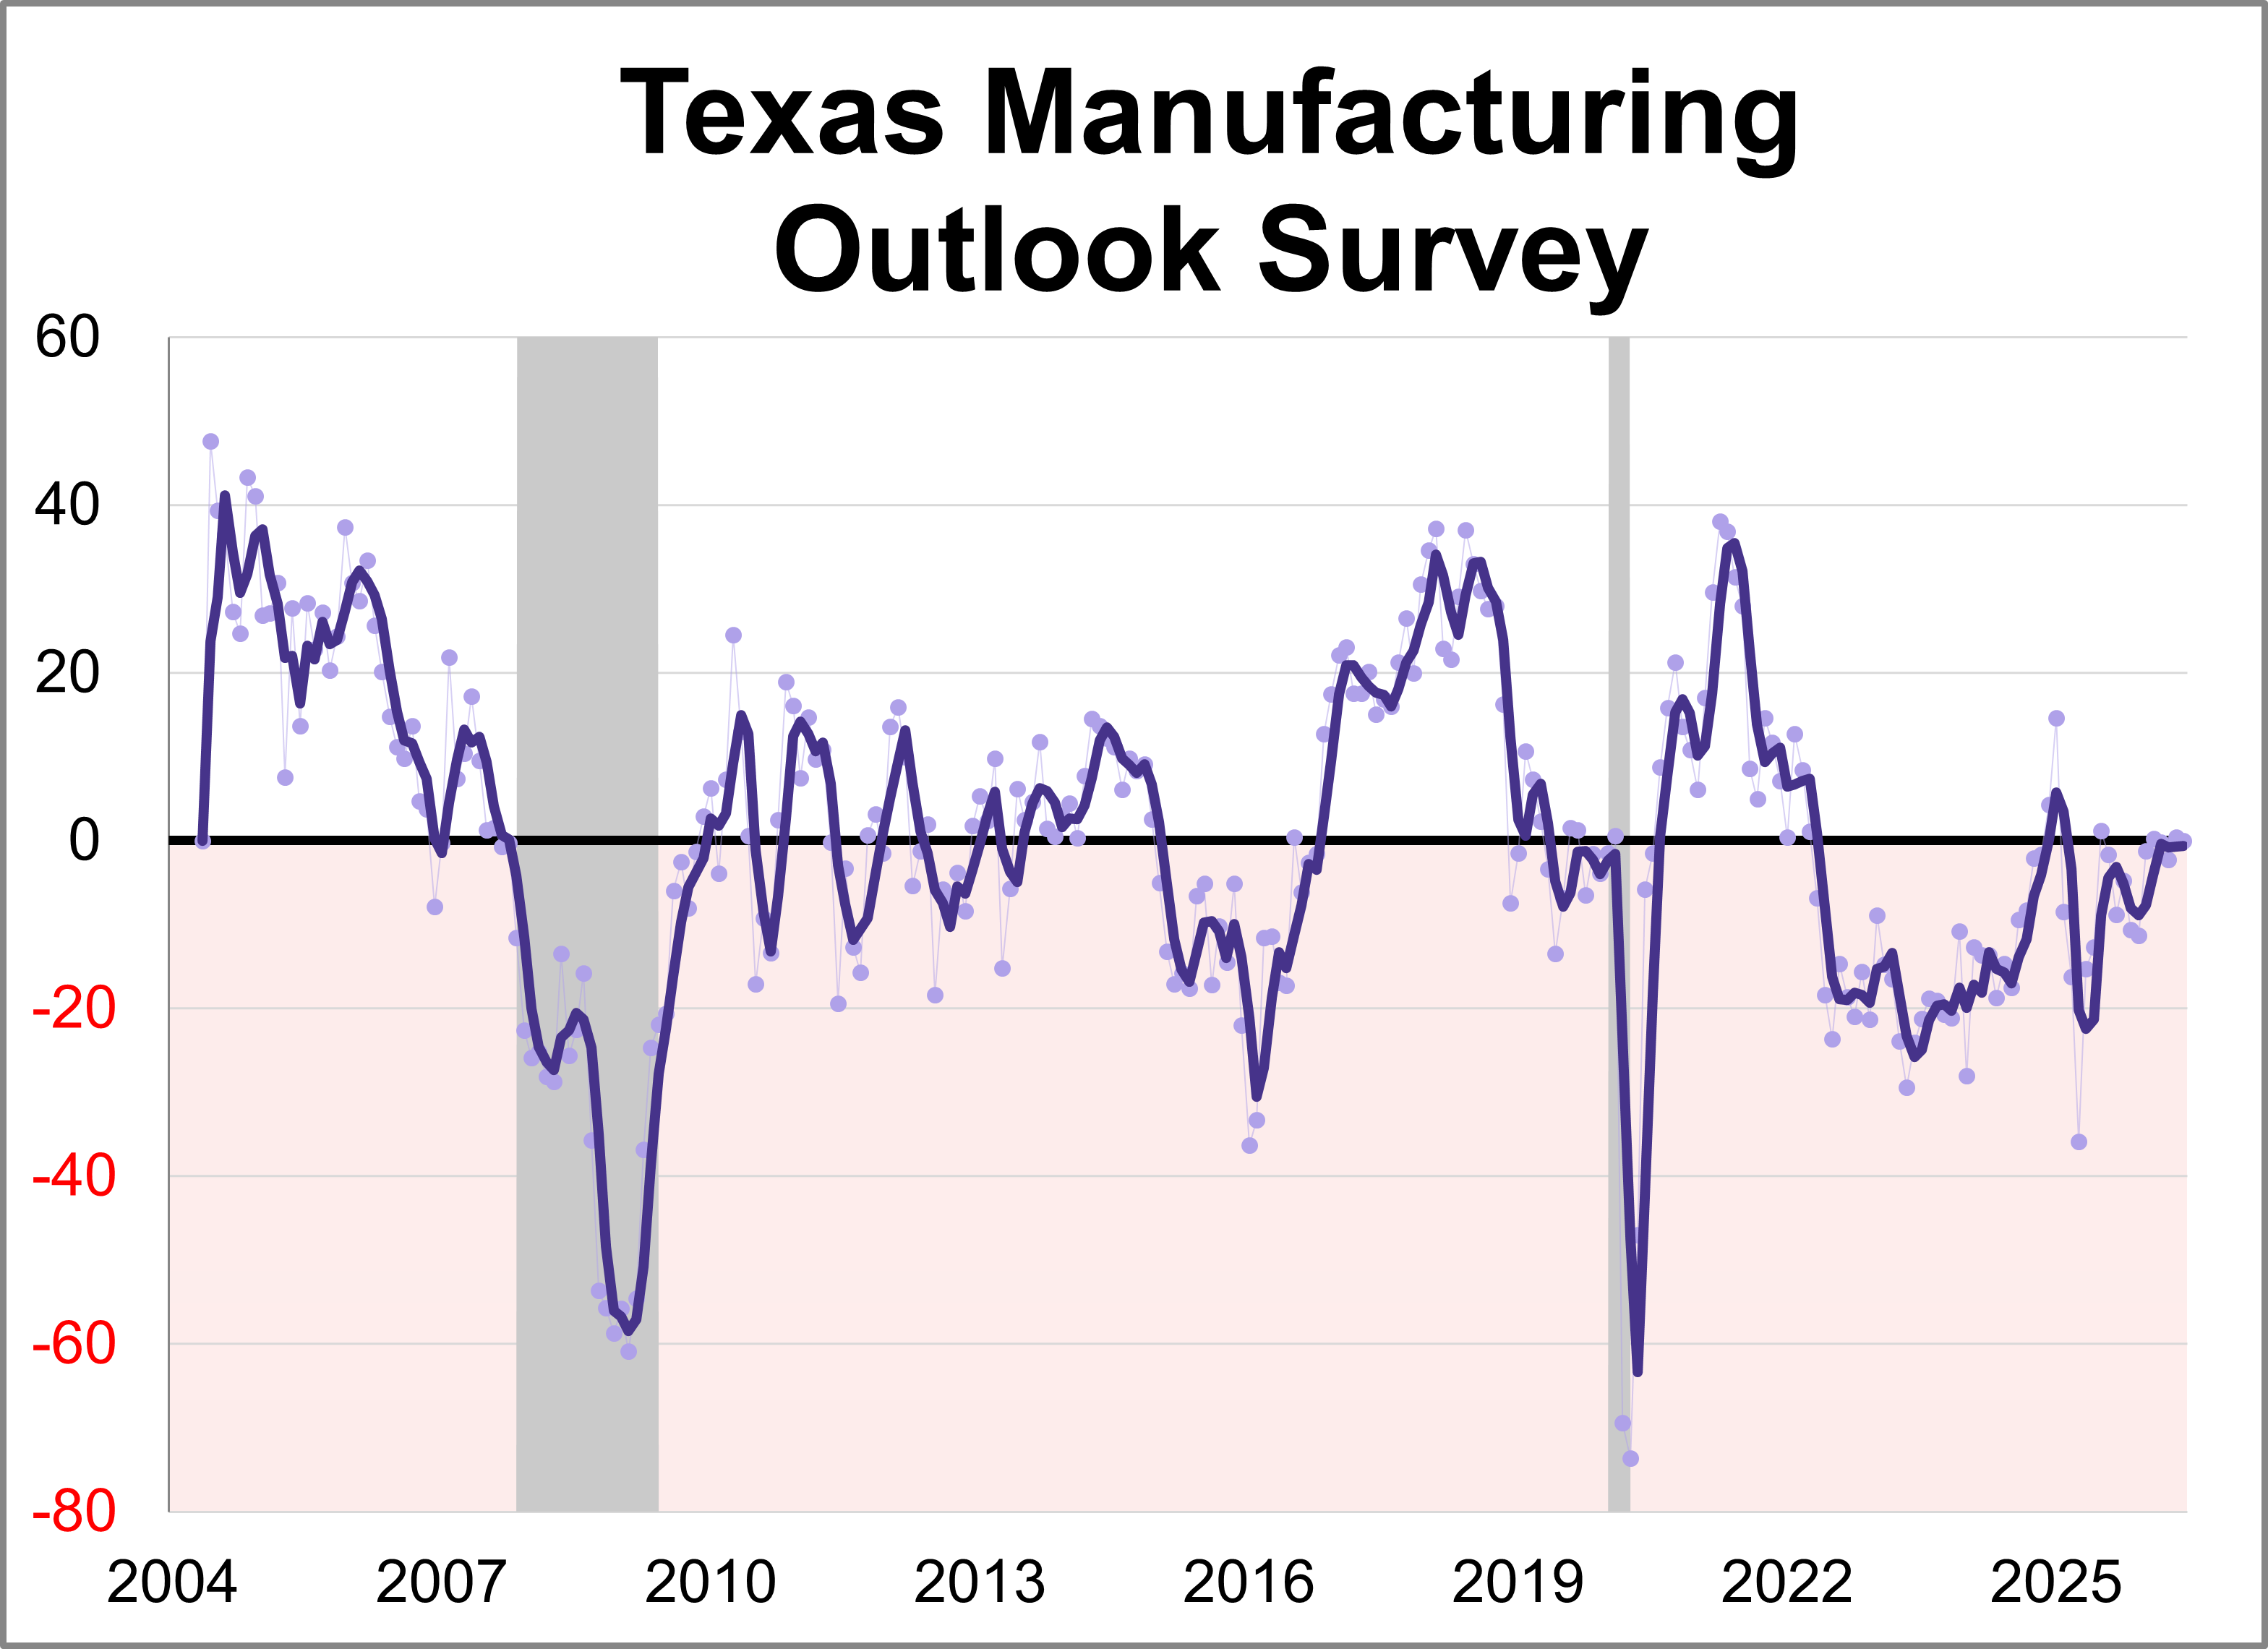
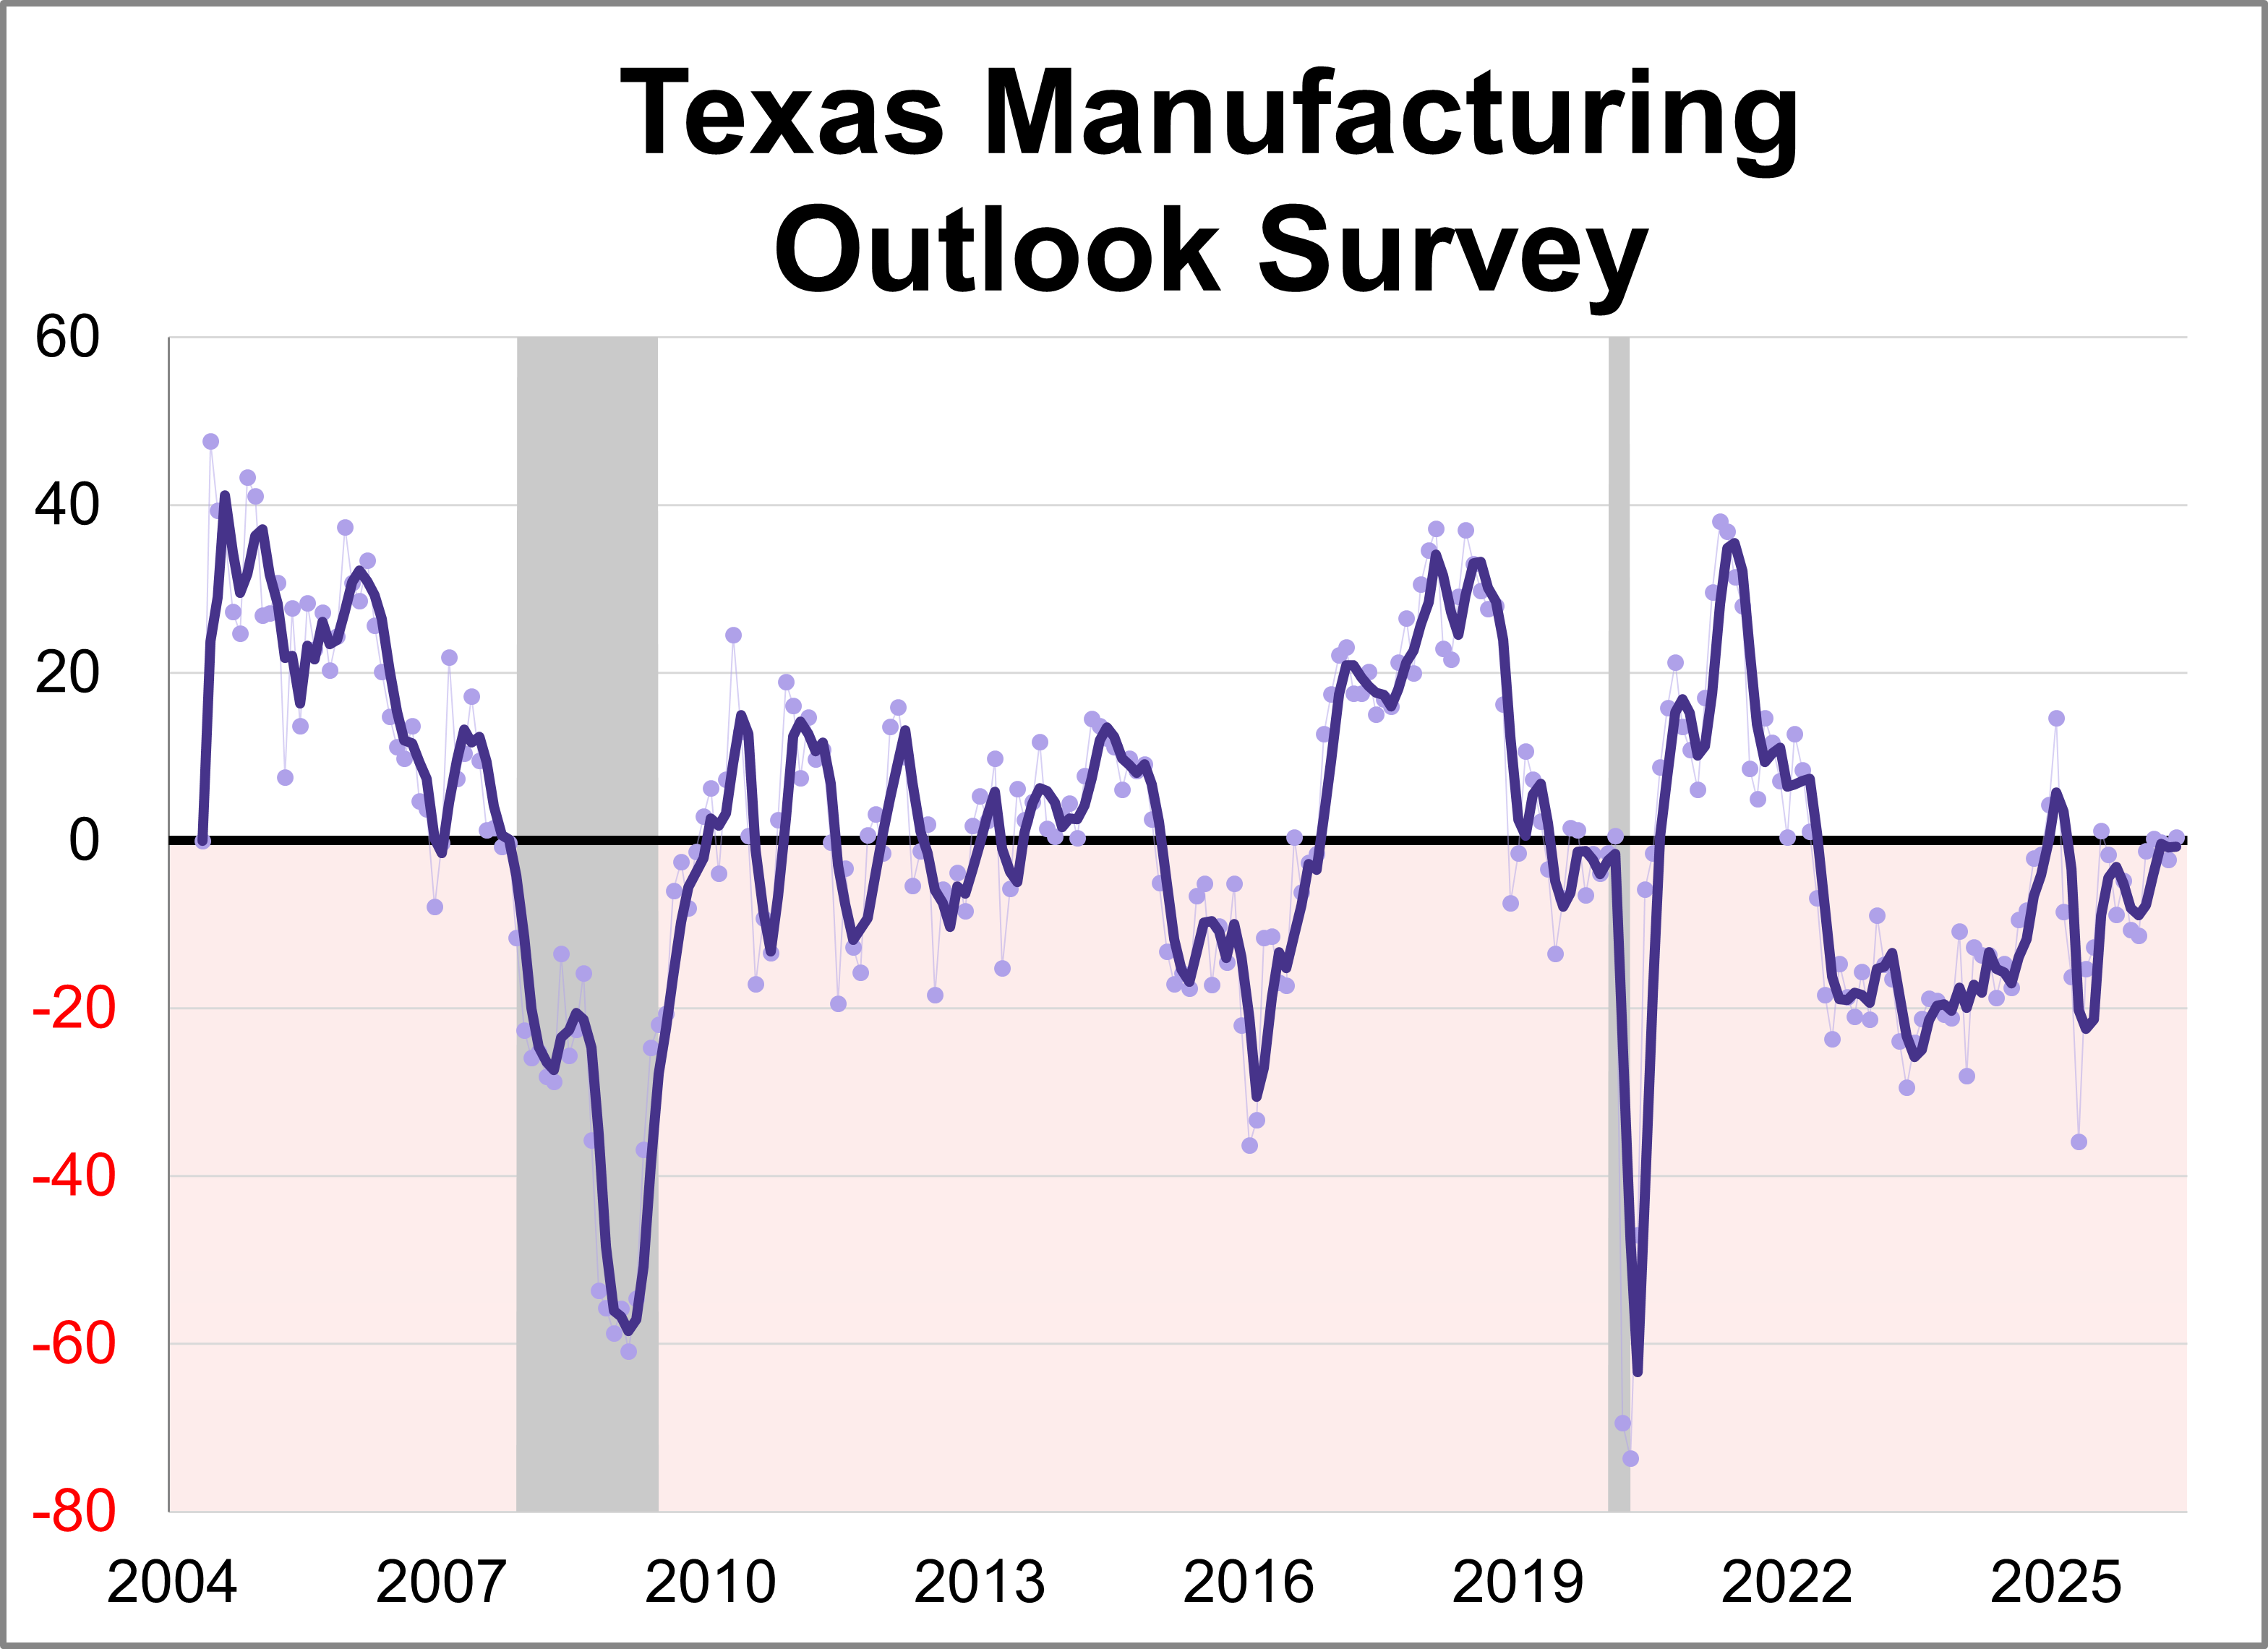
The Dallas Fed released its Texas Manufacturing Outlook Survey (TMOS) for June. The general business activity index fell 0.4 points to 0.0, indicating slower growth of manufacturing activity and stable business conditions perceptions.
Last week’s data reaffirmed that inflation pressures remain the defining narrative across the economic landscape.
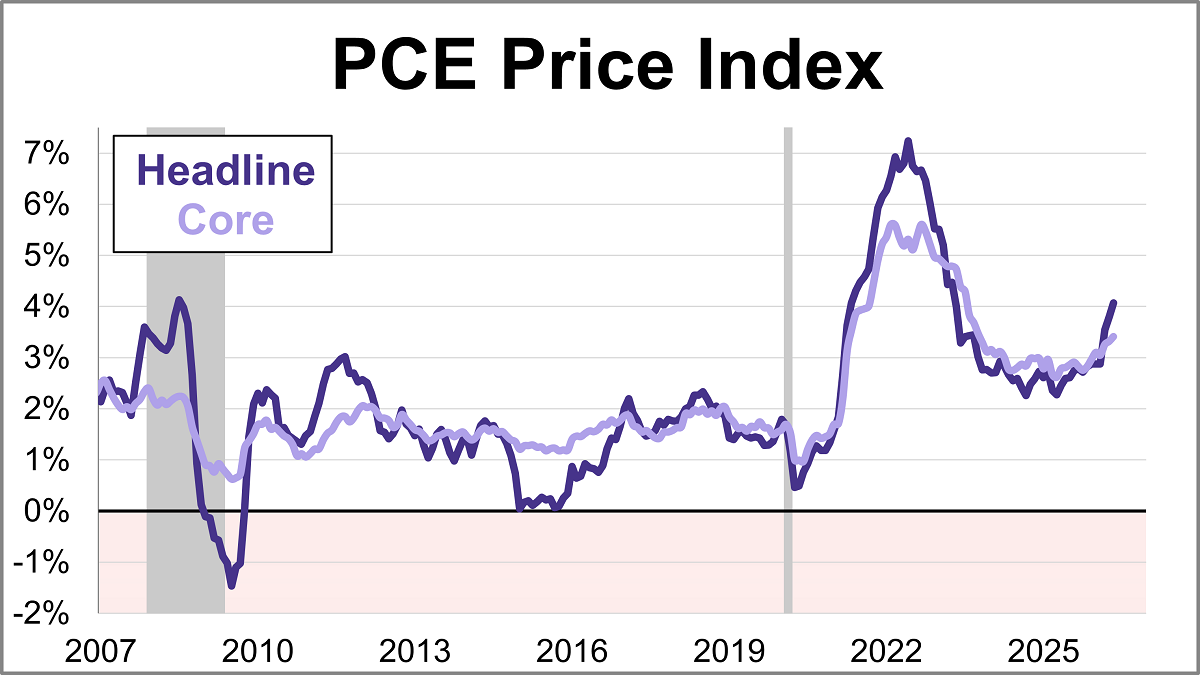
The Federal Reserve’s preferred inflation gauge, the core PCE price index, climbed 3.4% year-over-year in May. This marks the highest level since October 2023 and marks a pickup from April's 3.3% reading. On a monthly basis, core prices rose 0.3%.
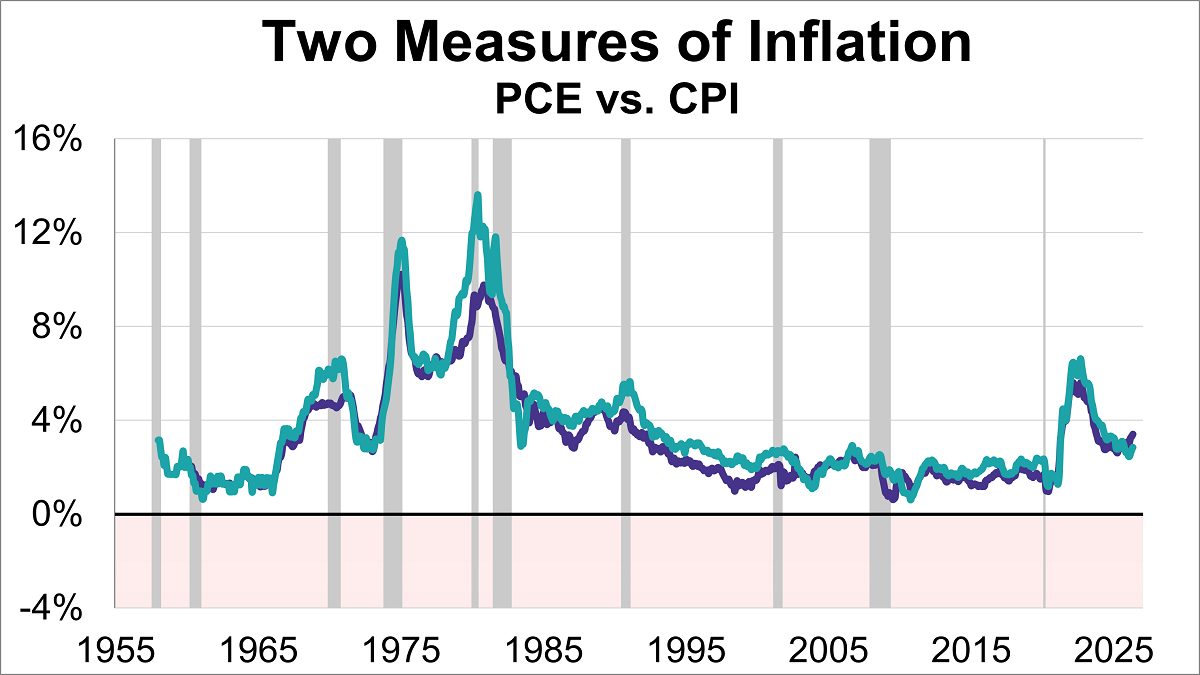
Inflation remains a hot topic, directly impacting everything from your grocery bill to interest rates. As of the latest data, two key inflation gauges — the Personal Consumption Expenditures (PCE) Price Index and the Consumer Price Index (CPI) — show that prices are still above the Federal Reserve's 2% target, with the core PCE at 3.4% and core CPI at 2.9%.
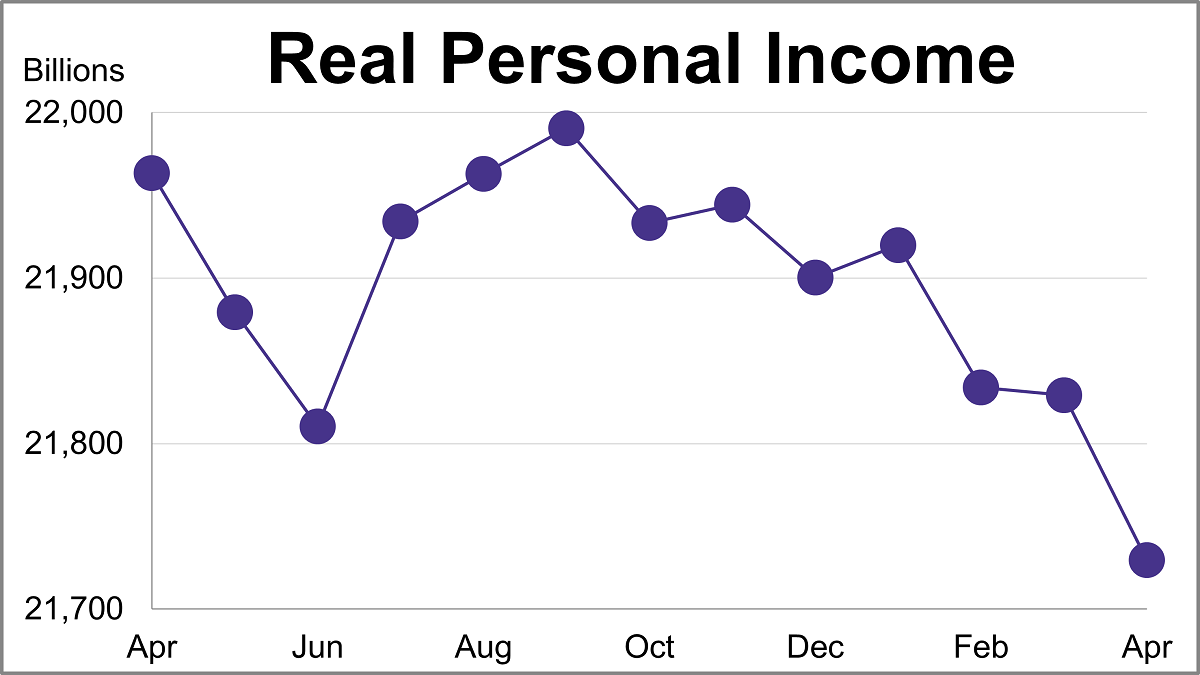
Personal income (excluding transfer receipts) was up 0.70% in May and was up 3.62% year-over-year. However, when adjusted for inflation using the BEA's PCE Price Index, real personal income (excluding transfer receipts) was up 0.25% month-over-month and down 0.43% year-over-year.
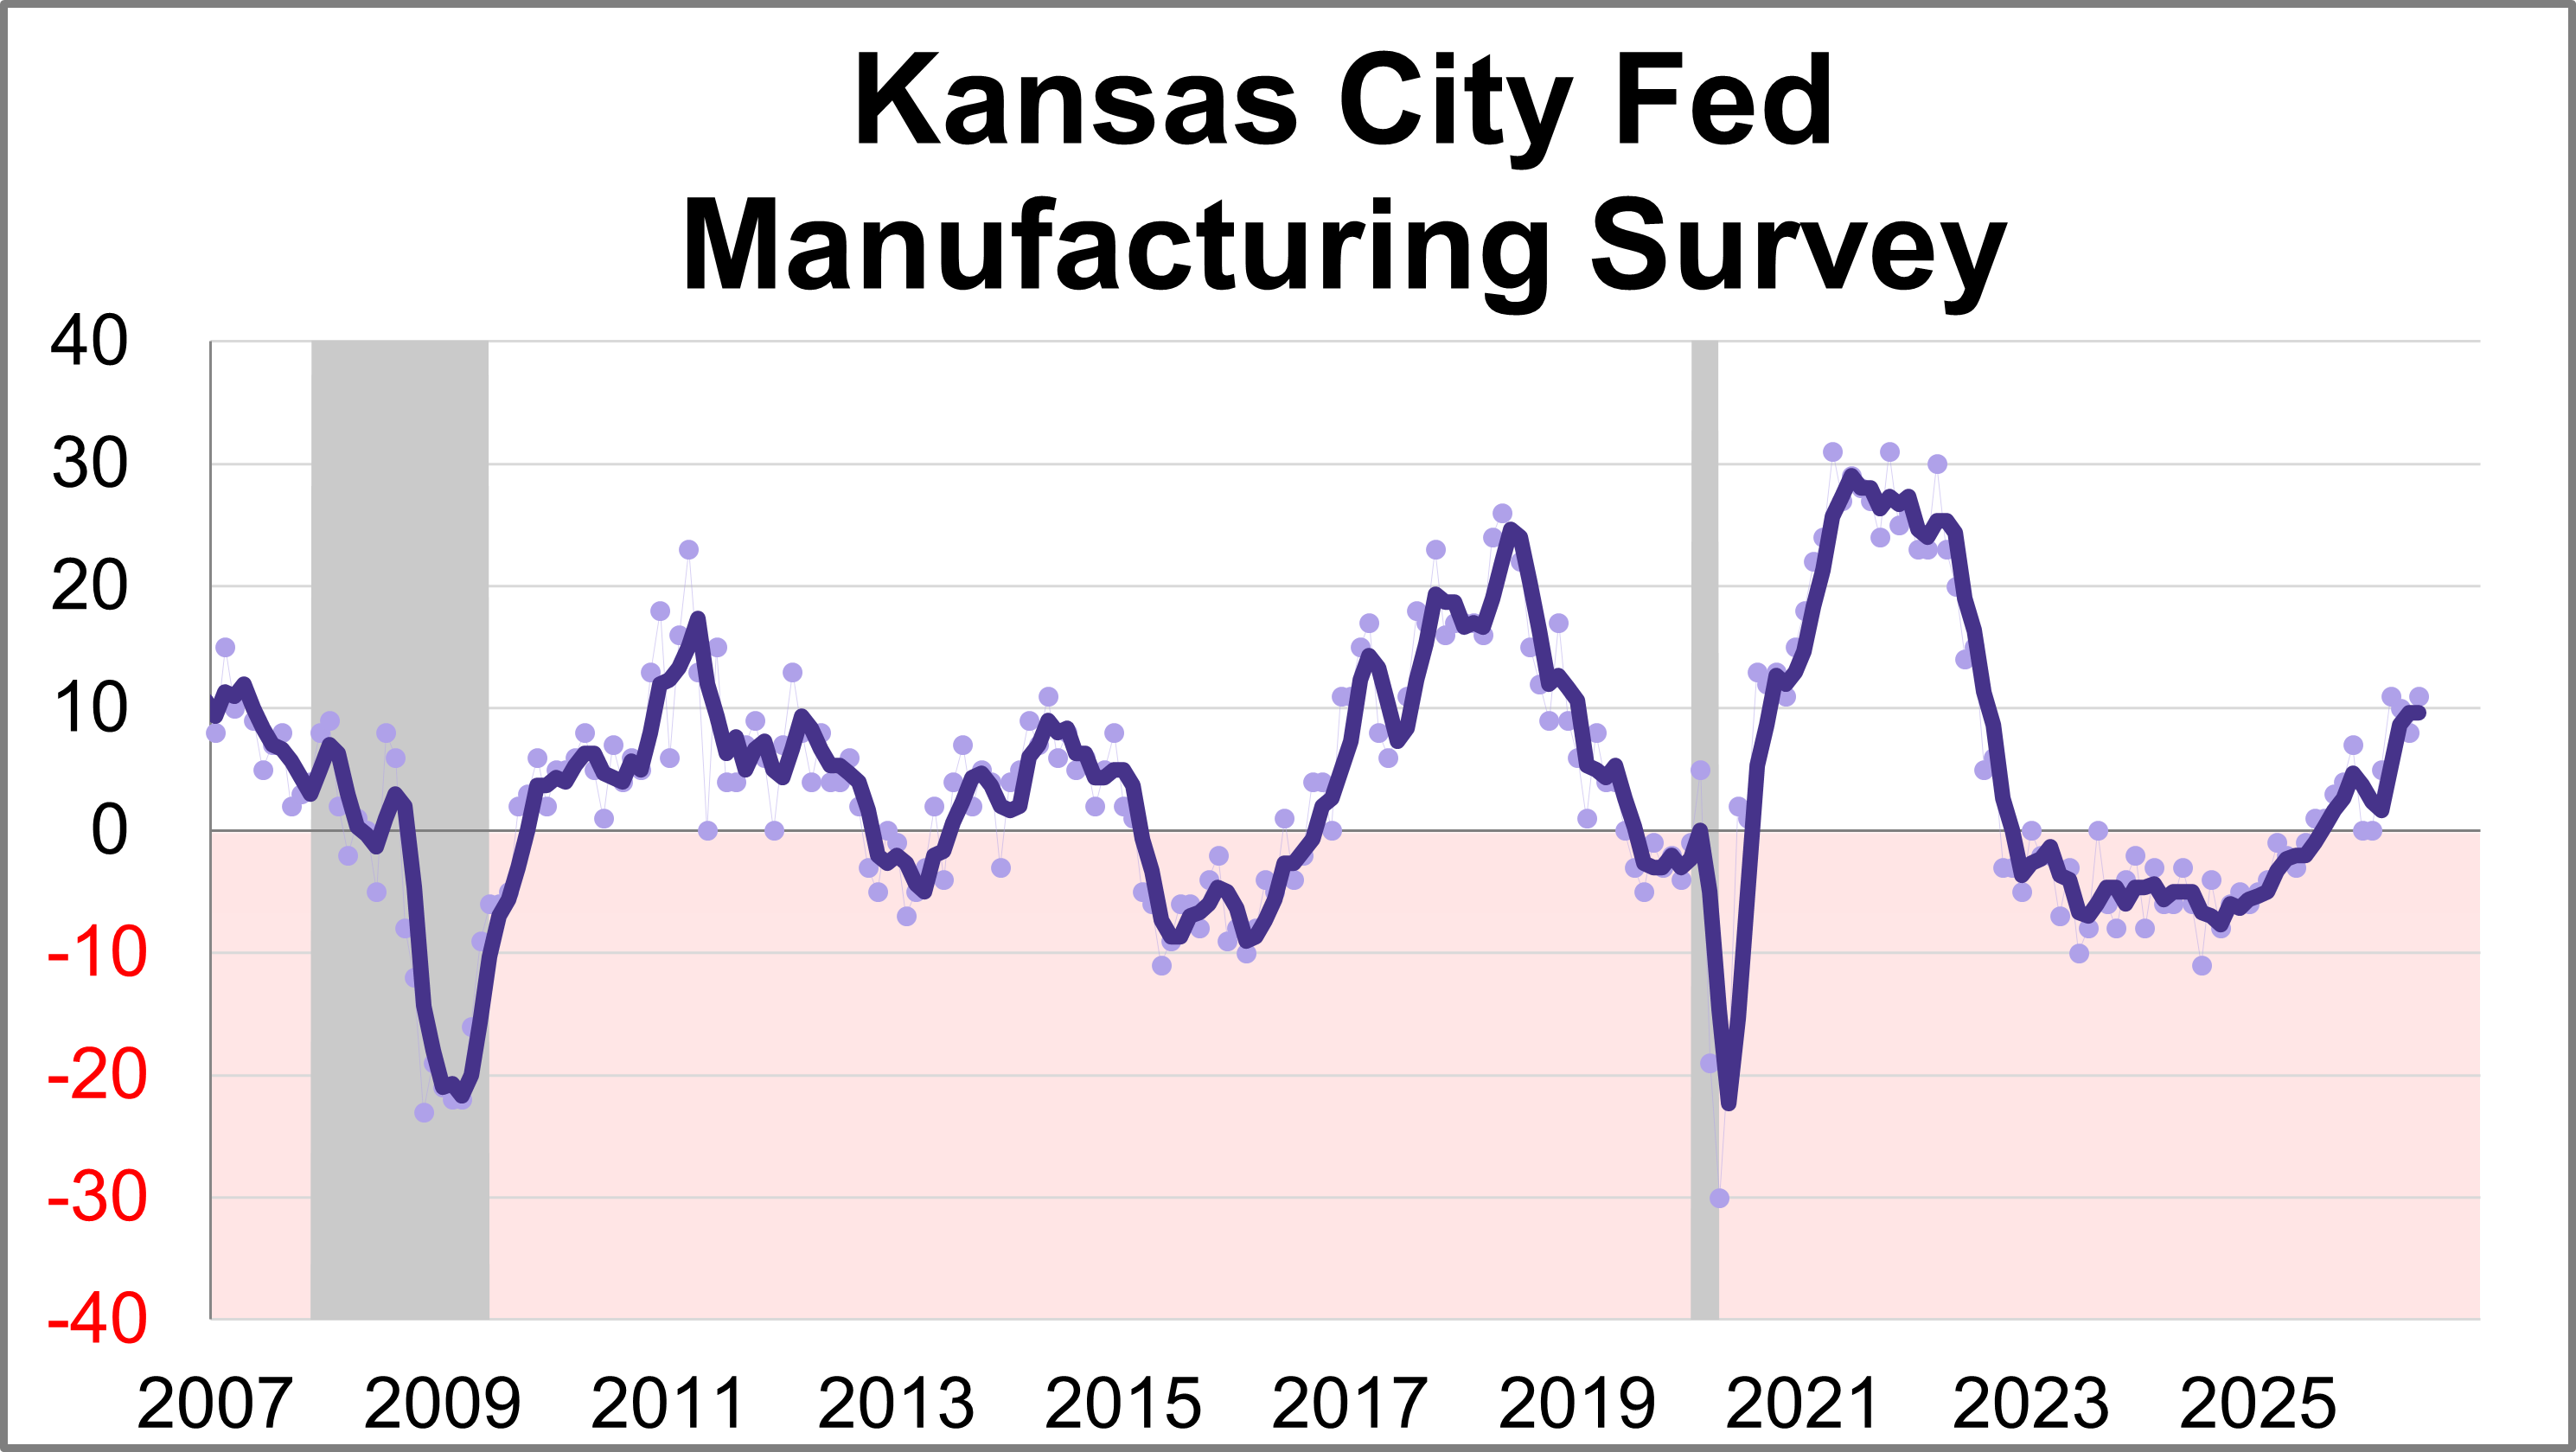
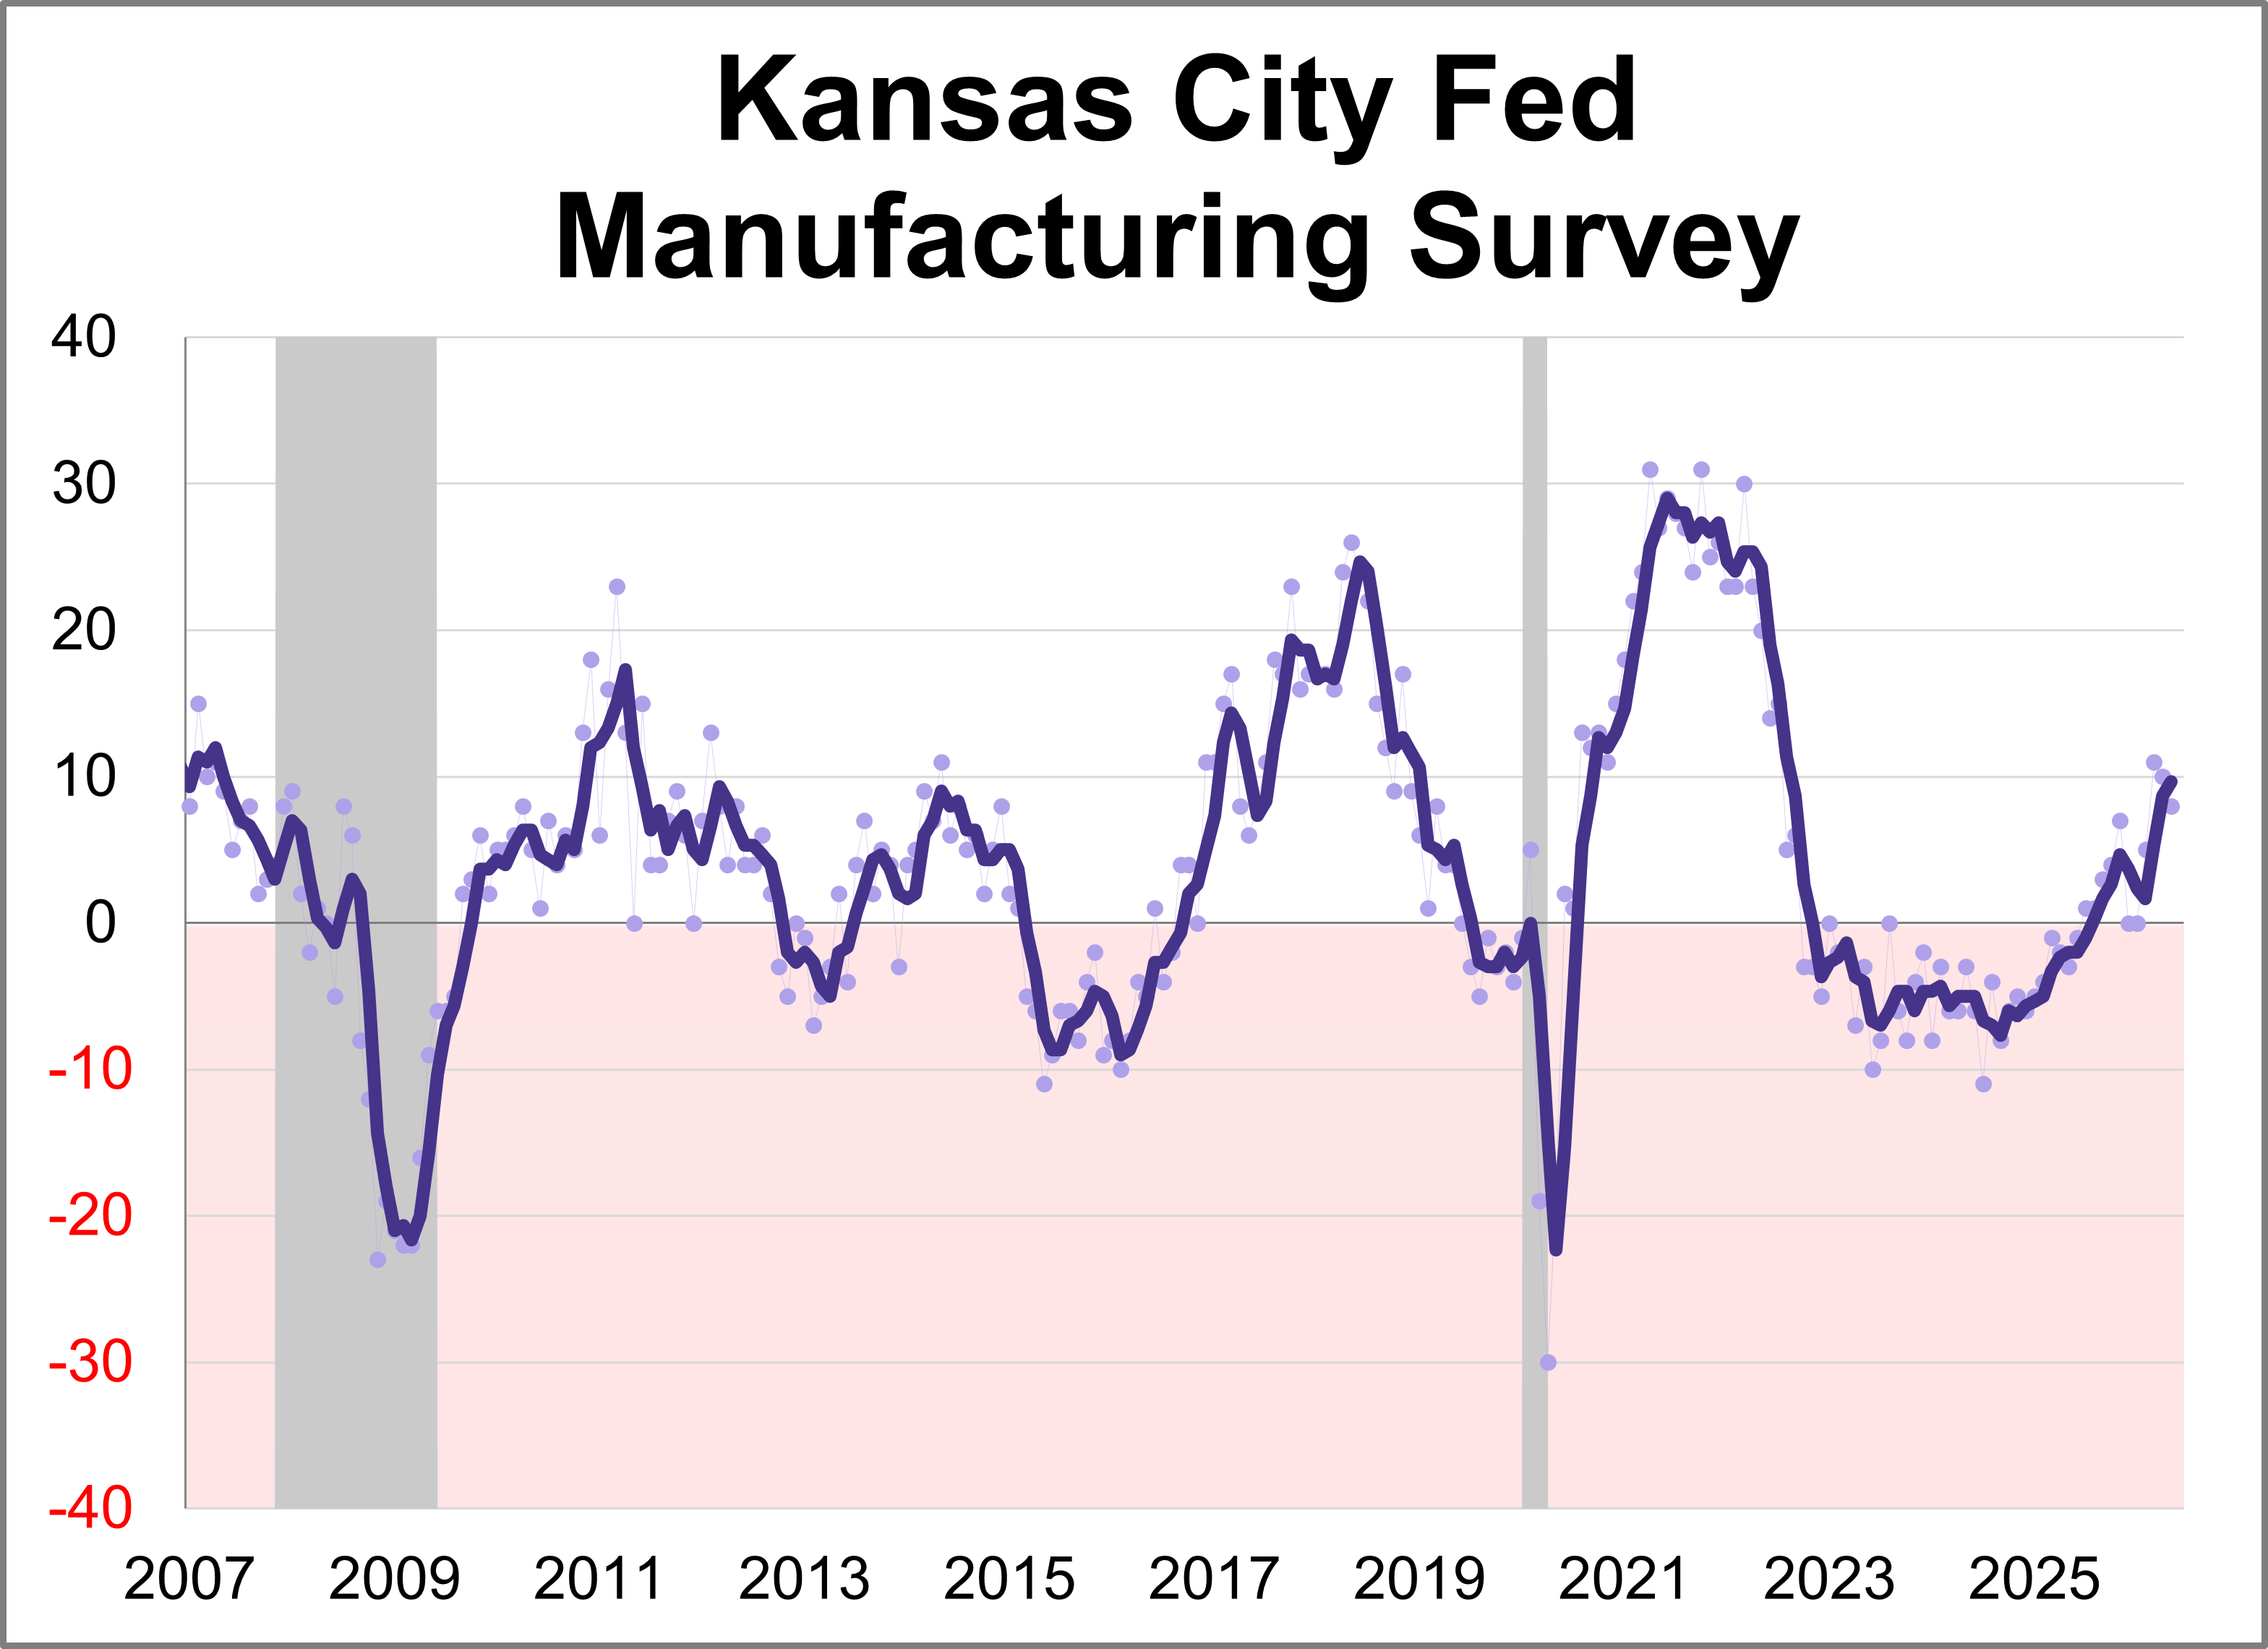
The Kansas City Fed Manufacturing Survey revealed regional activity continued to increase in May. The composite index came in at 8 this month, down slightly from 10 in April but still indicating continued expansion.
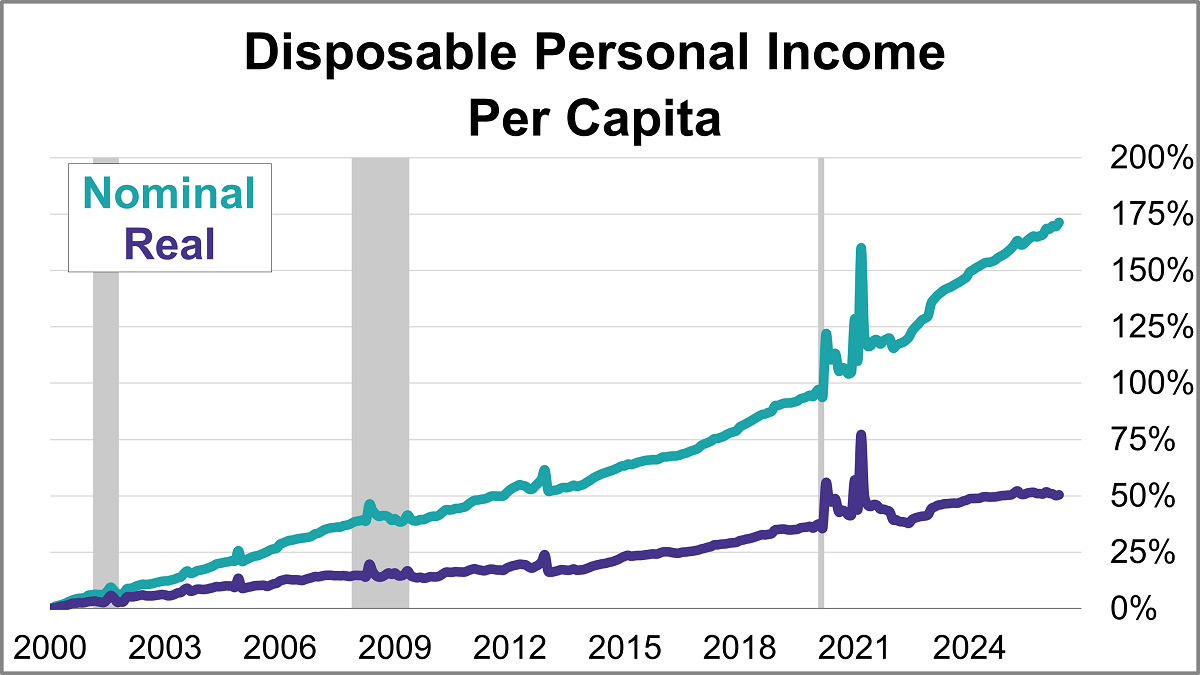
With the release of May's report on personal incomes and outlays, we can now take a closer look at "real" disposable personal income per capita. To two decimal places, disposable income per capita was up up 0.68% month-over-month. But when adjusted for inflation, real disposable income per capita was up 0.23%.
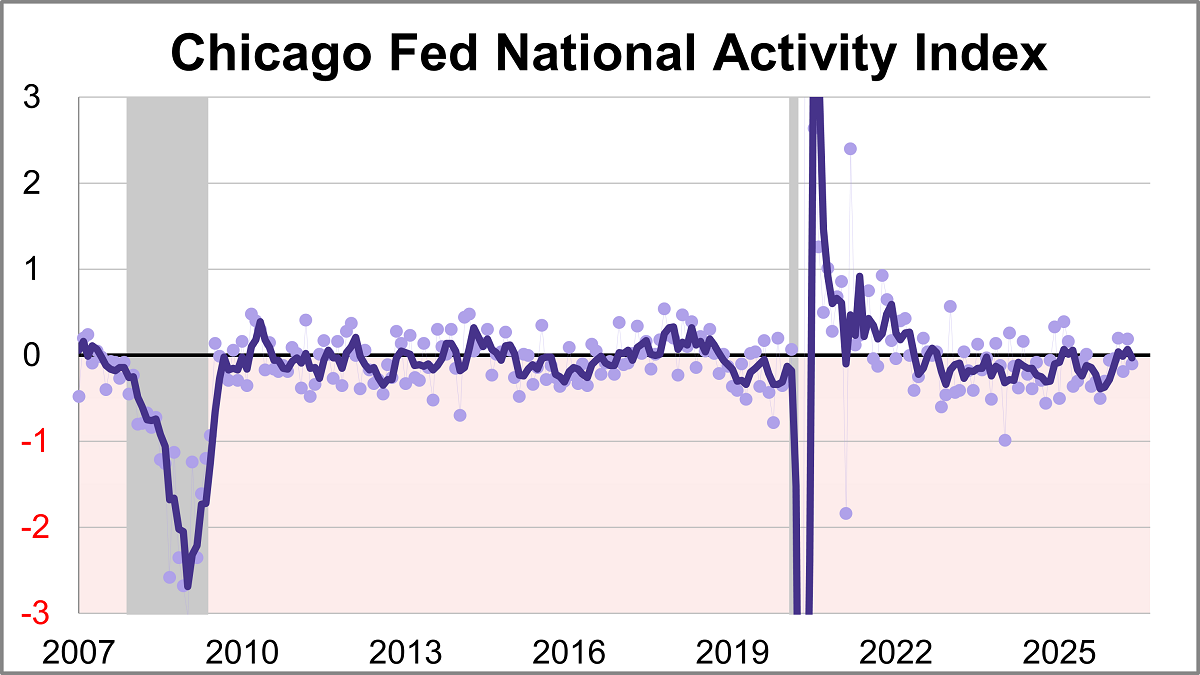
The Chicago Fed National Activity Index (CFNAI) fell to -0.10 in May from +0.19 in April. Two of the four broad categories of indicators used to construct the index decreased from April, and three categories made negative contributions.
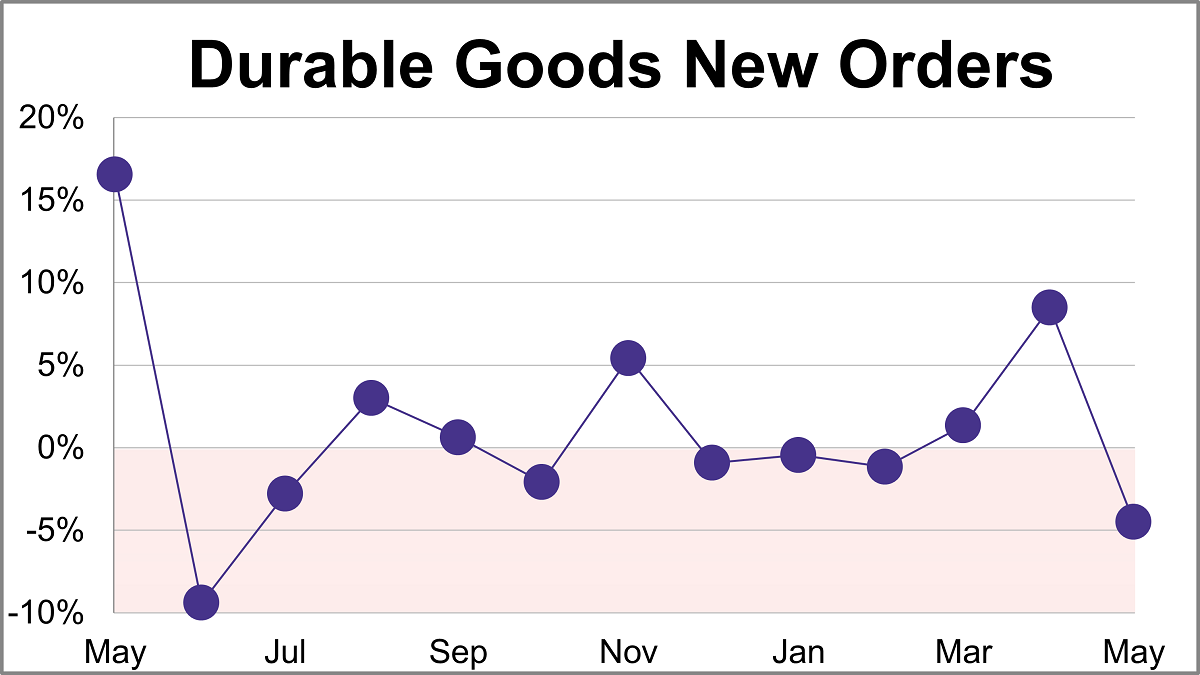
New orders for manufactured durable goods sank 4.5% in May to $332.05B, slightly less than the projected 5.0% monthly decline.
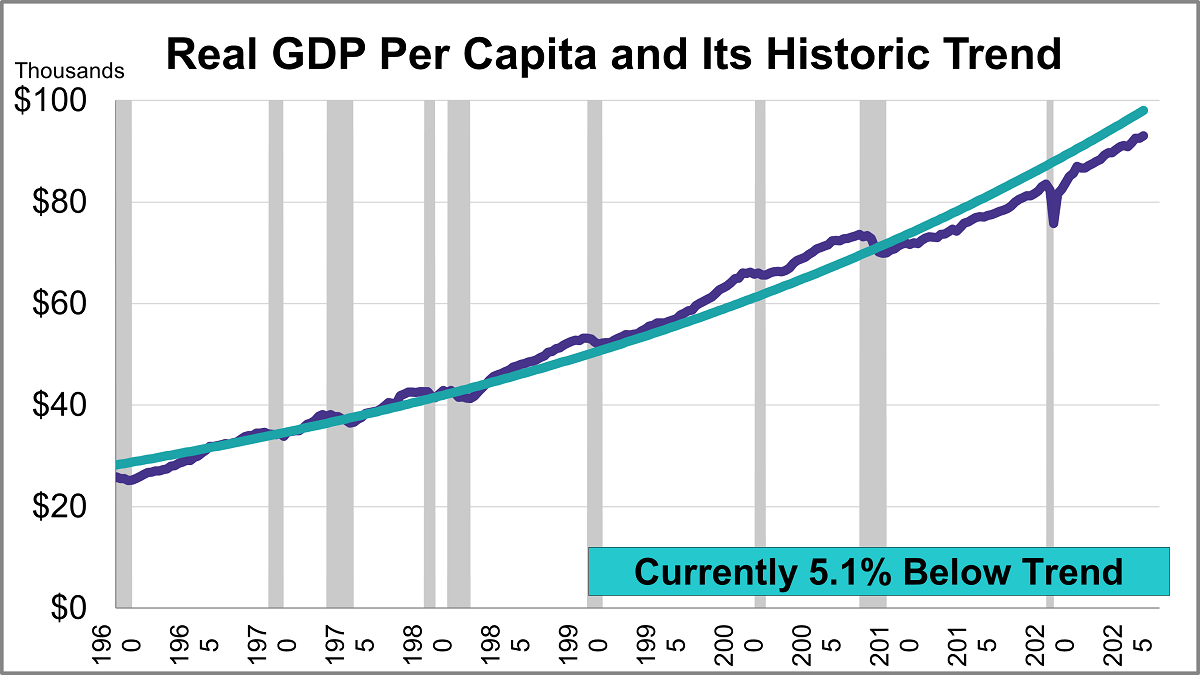
The third estimate for Q1 GDP came in at 2.09%, an acceleration from 0.48% for the Q4 final estimate. With a per-capita adjustment, the headline number is lower at 1.91%, a pickup from 0.18% for the Q4 headline number.
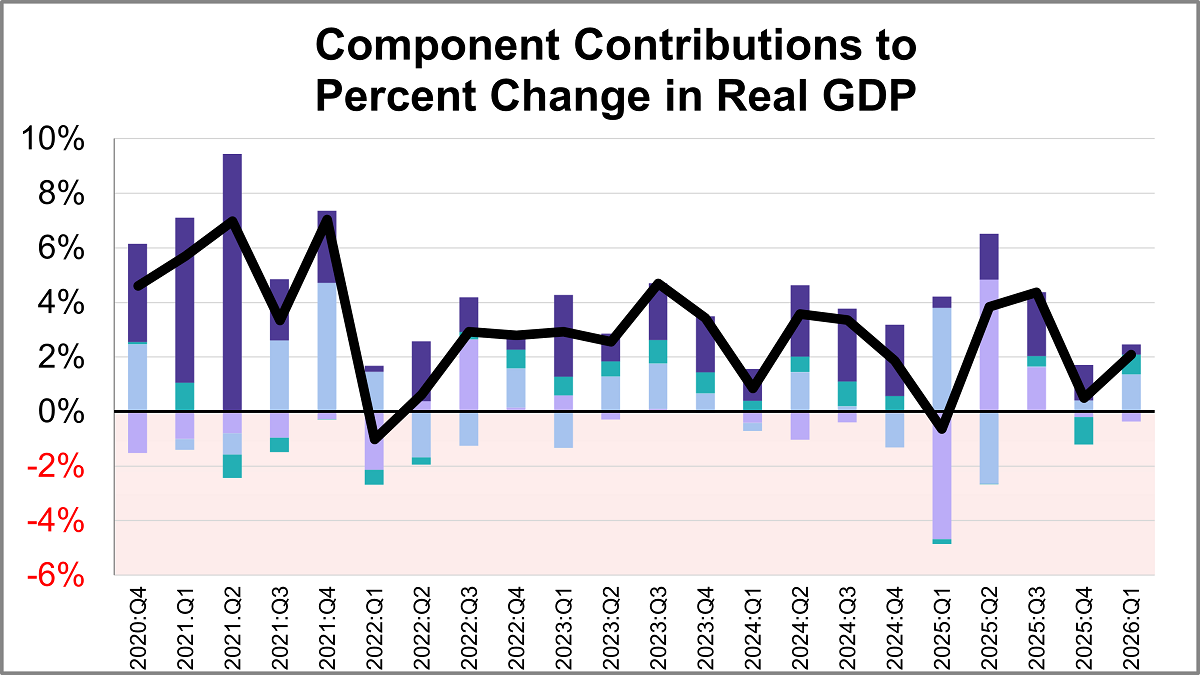
Real gross domestic product (GDP) is comprised of four major subcomponents. In the Q1 2026 GDP third estimate, three of the four components made positive contributions.
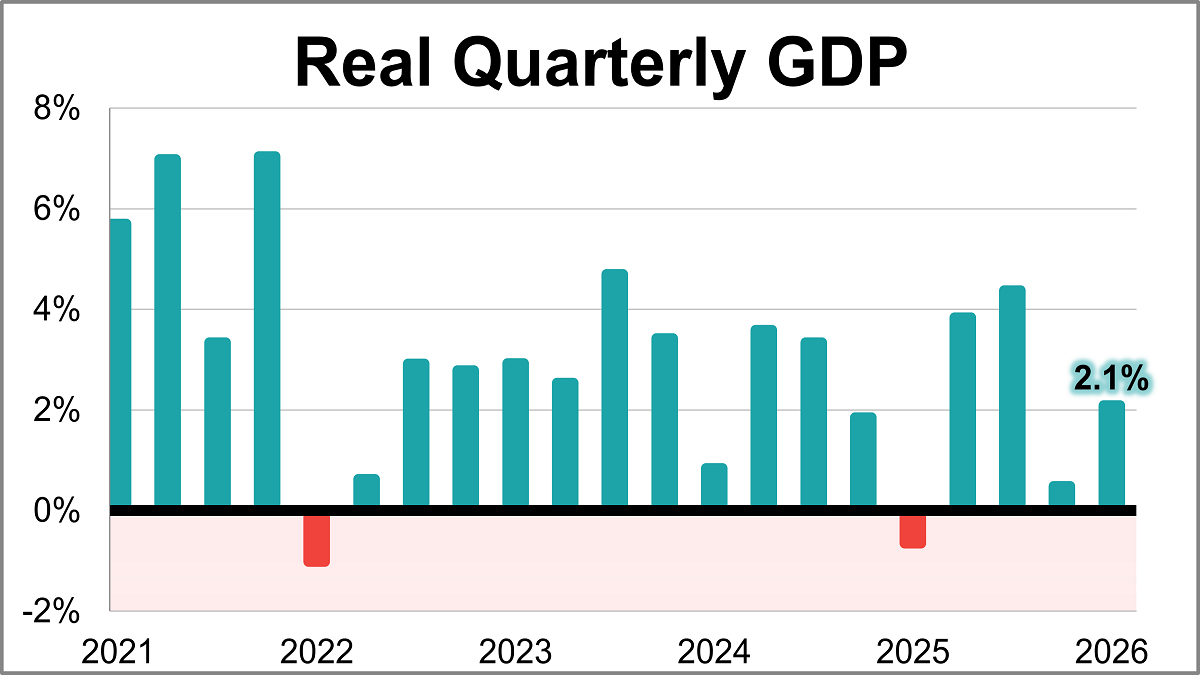
U.S. economic growth rebounded at the beginning of 2026, according to the BEA’s latest estimate. Real GDP rose at a 2.1% annual rate in Q1, exceeding the 1.6% forecast and marking a sharp acceleration from the 0.5% final estimate seen in Q4 of last year.
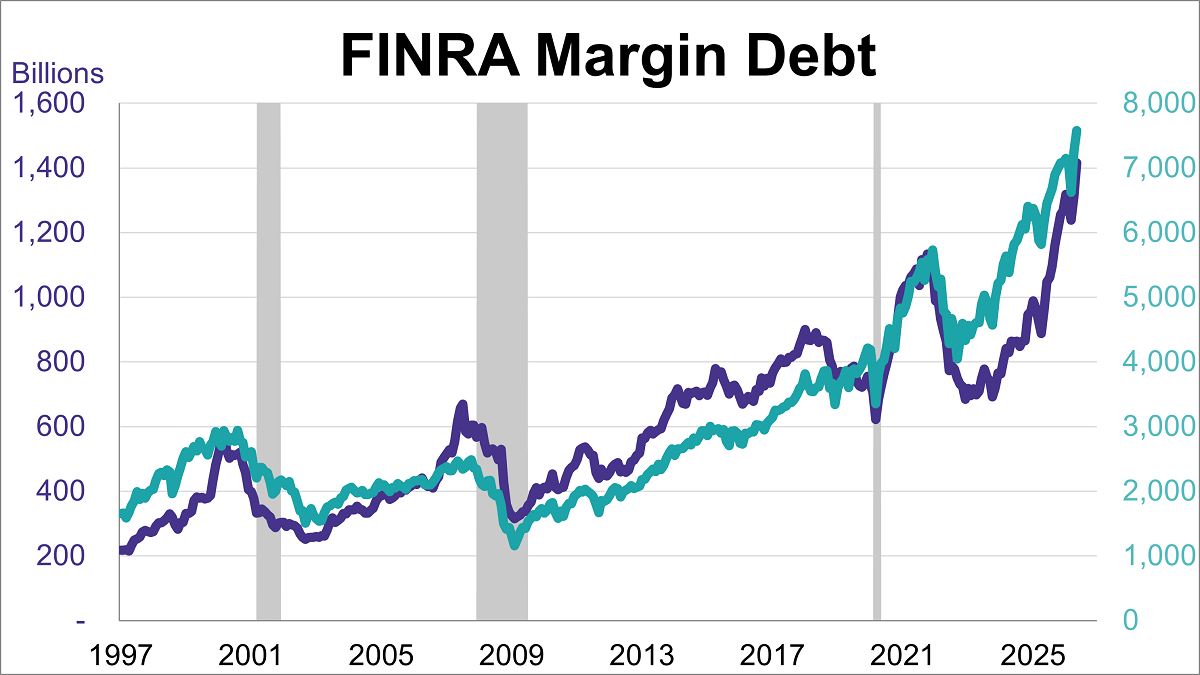
Margin debt rose for a second straight month in May, reaching a new record high of $1.42 trillion. This marked an 8.5% increase from April and a 53.7% rise compared to the previous year.
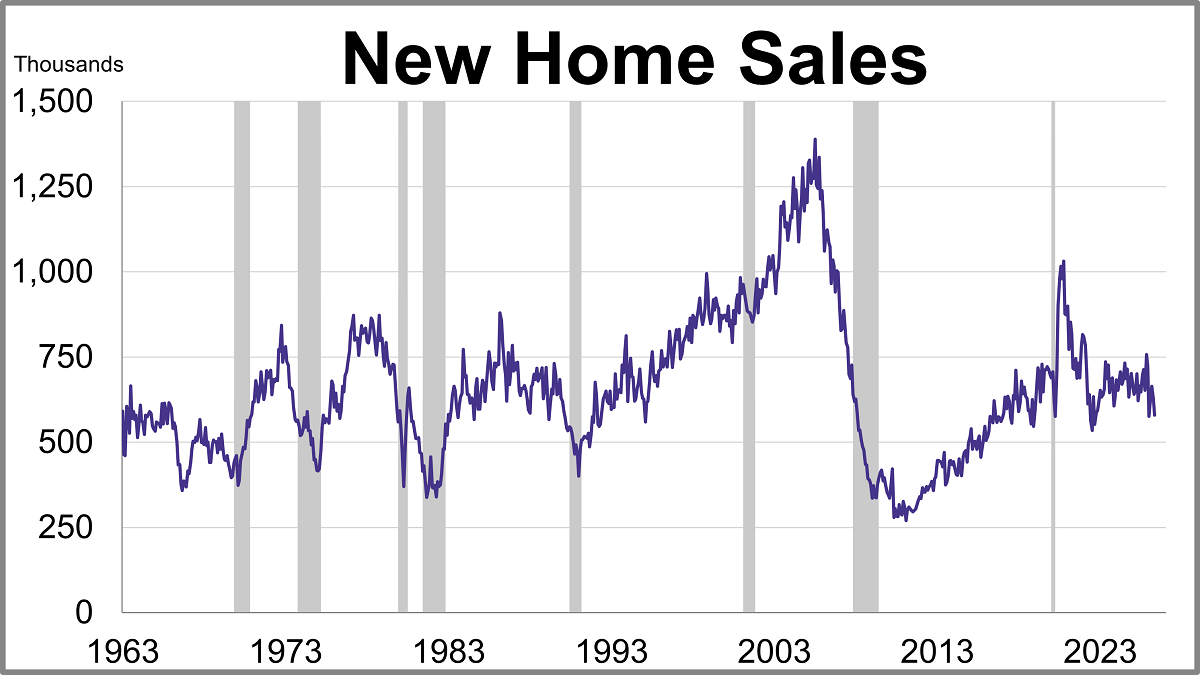
New home sales fell more than expected in May while the median price rose for a second straight month.
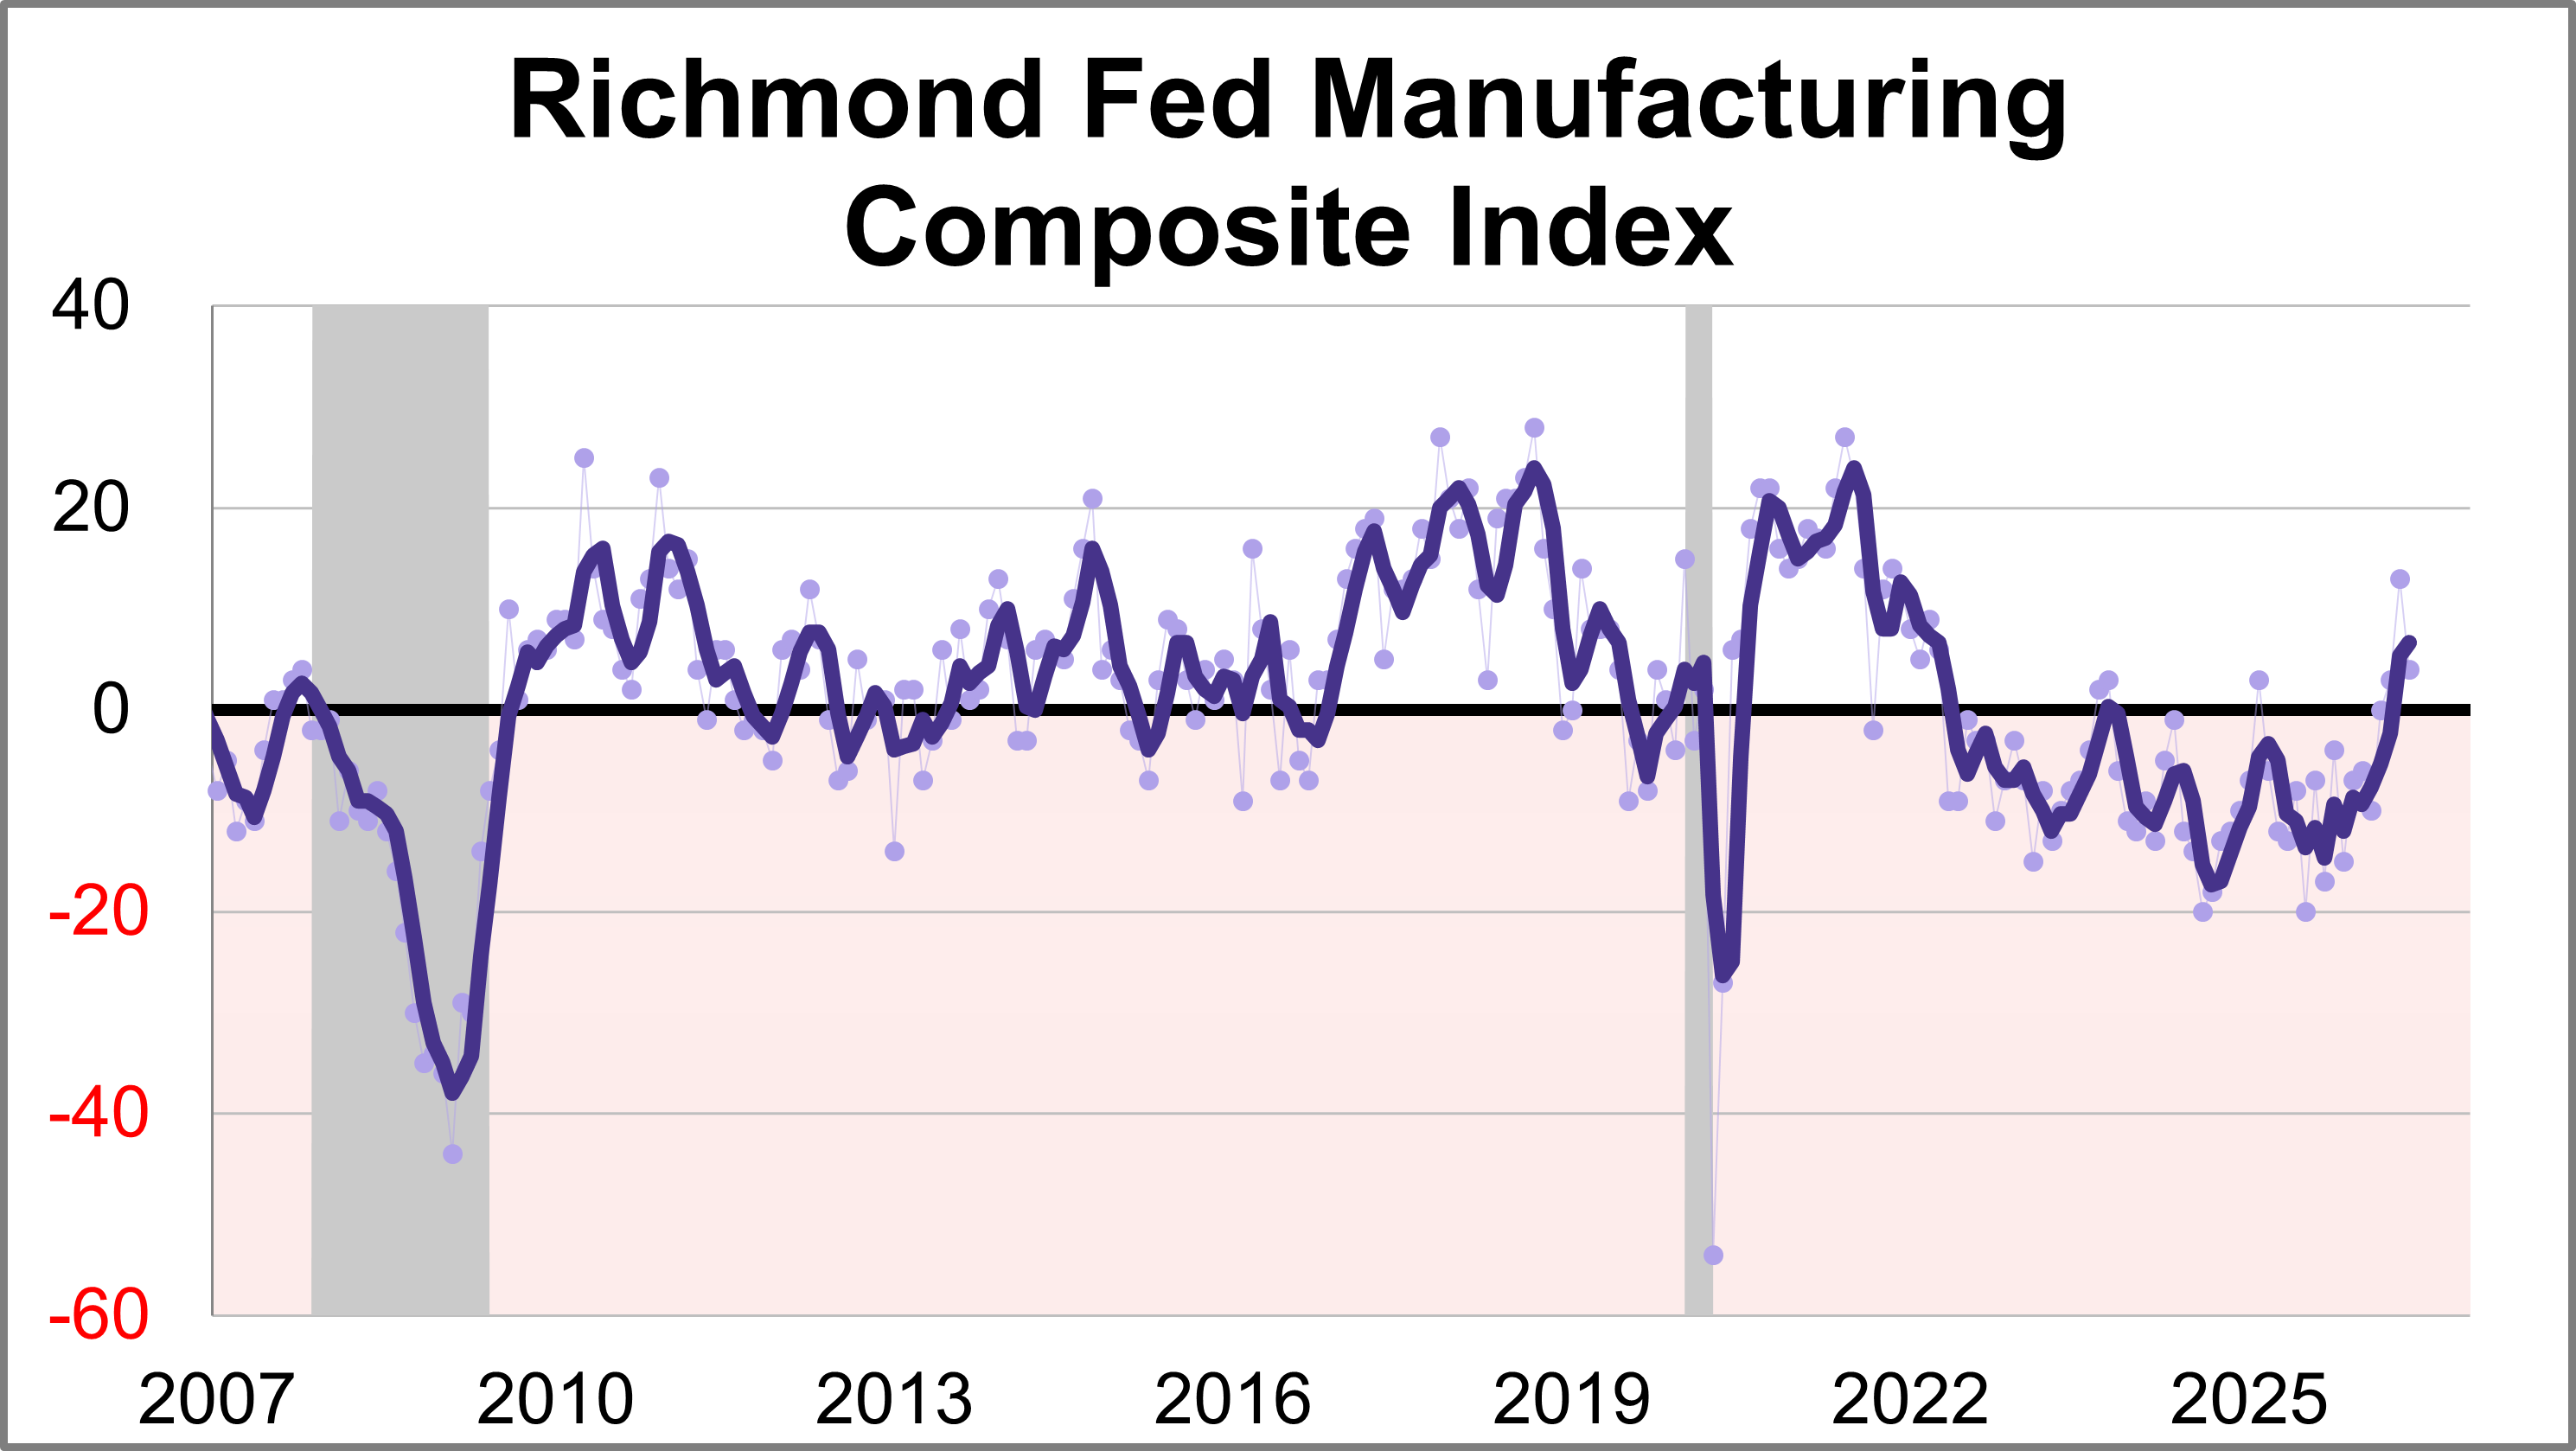
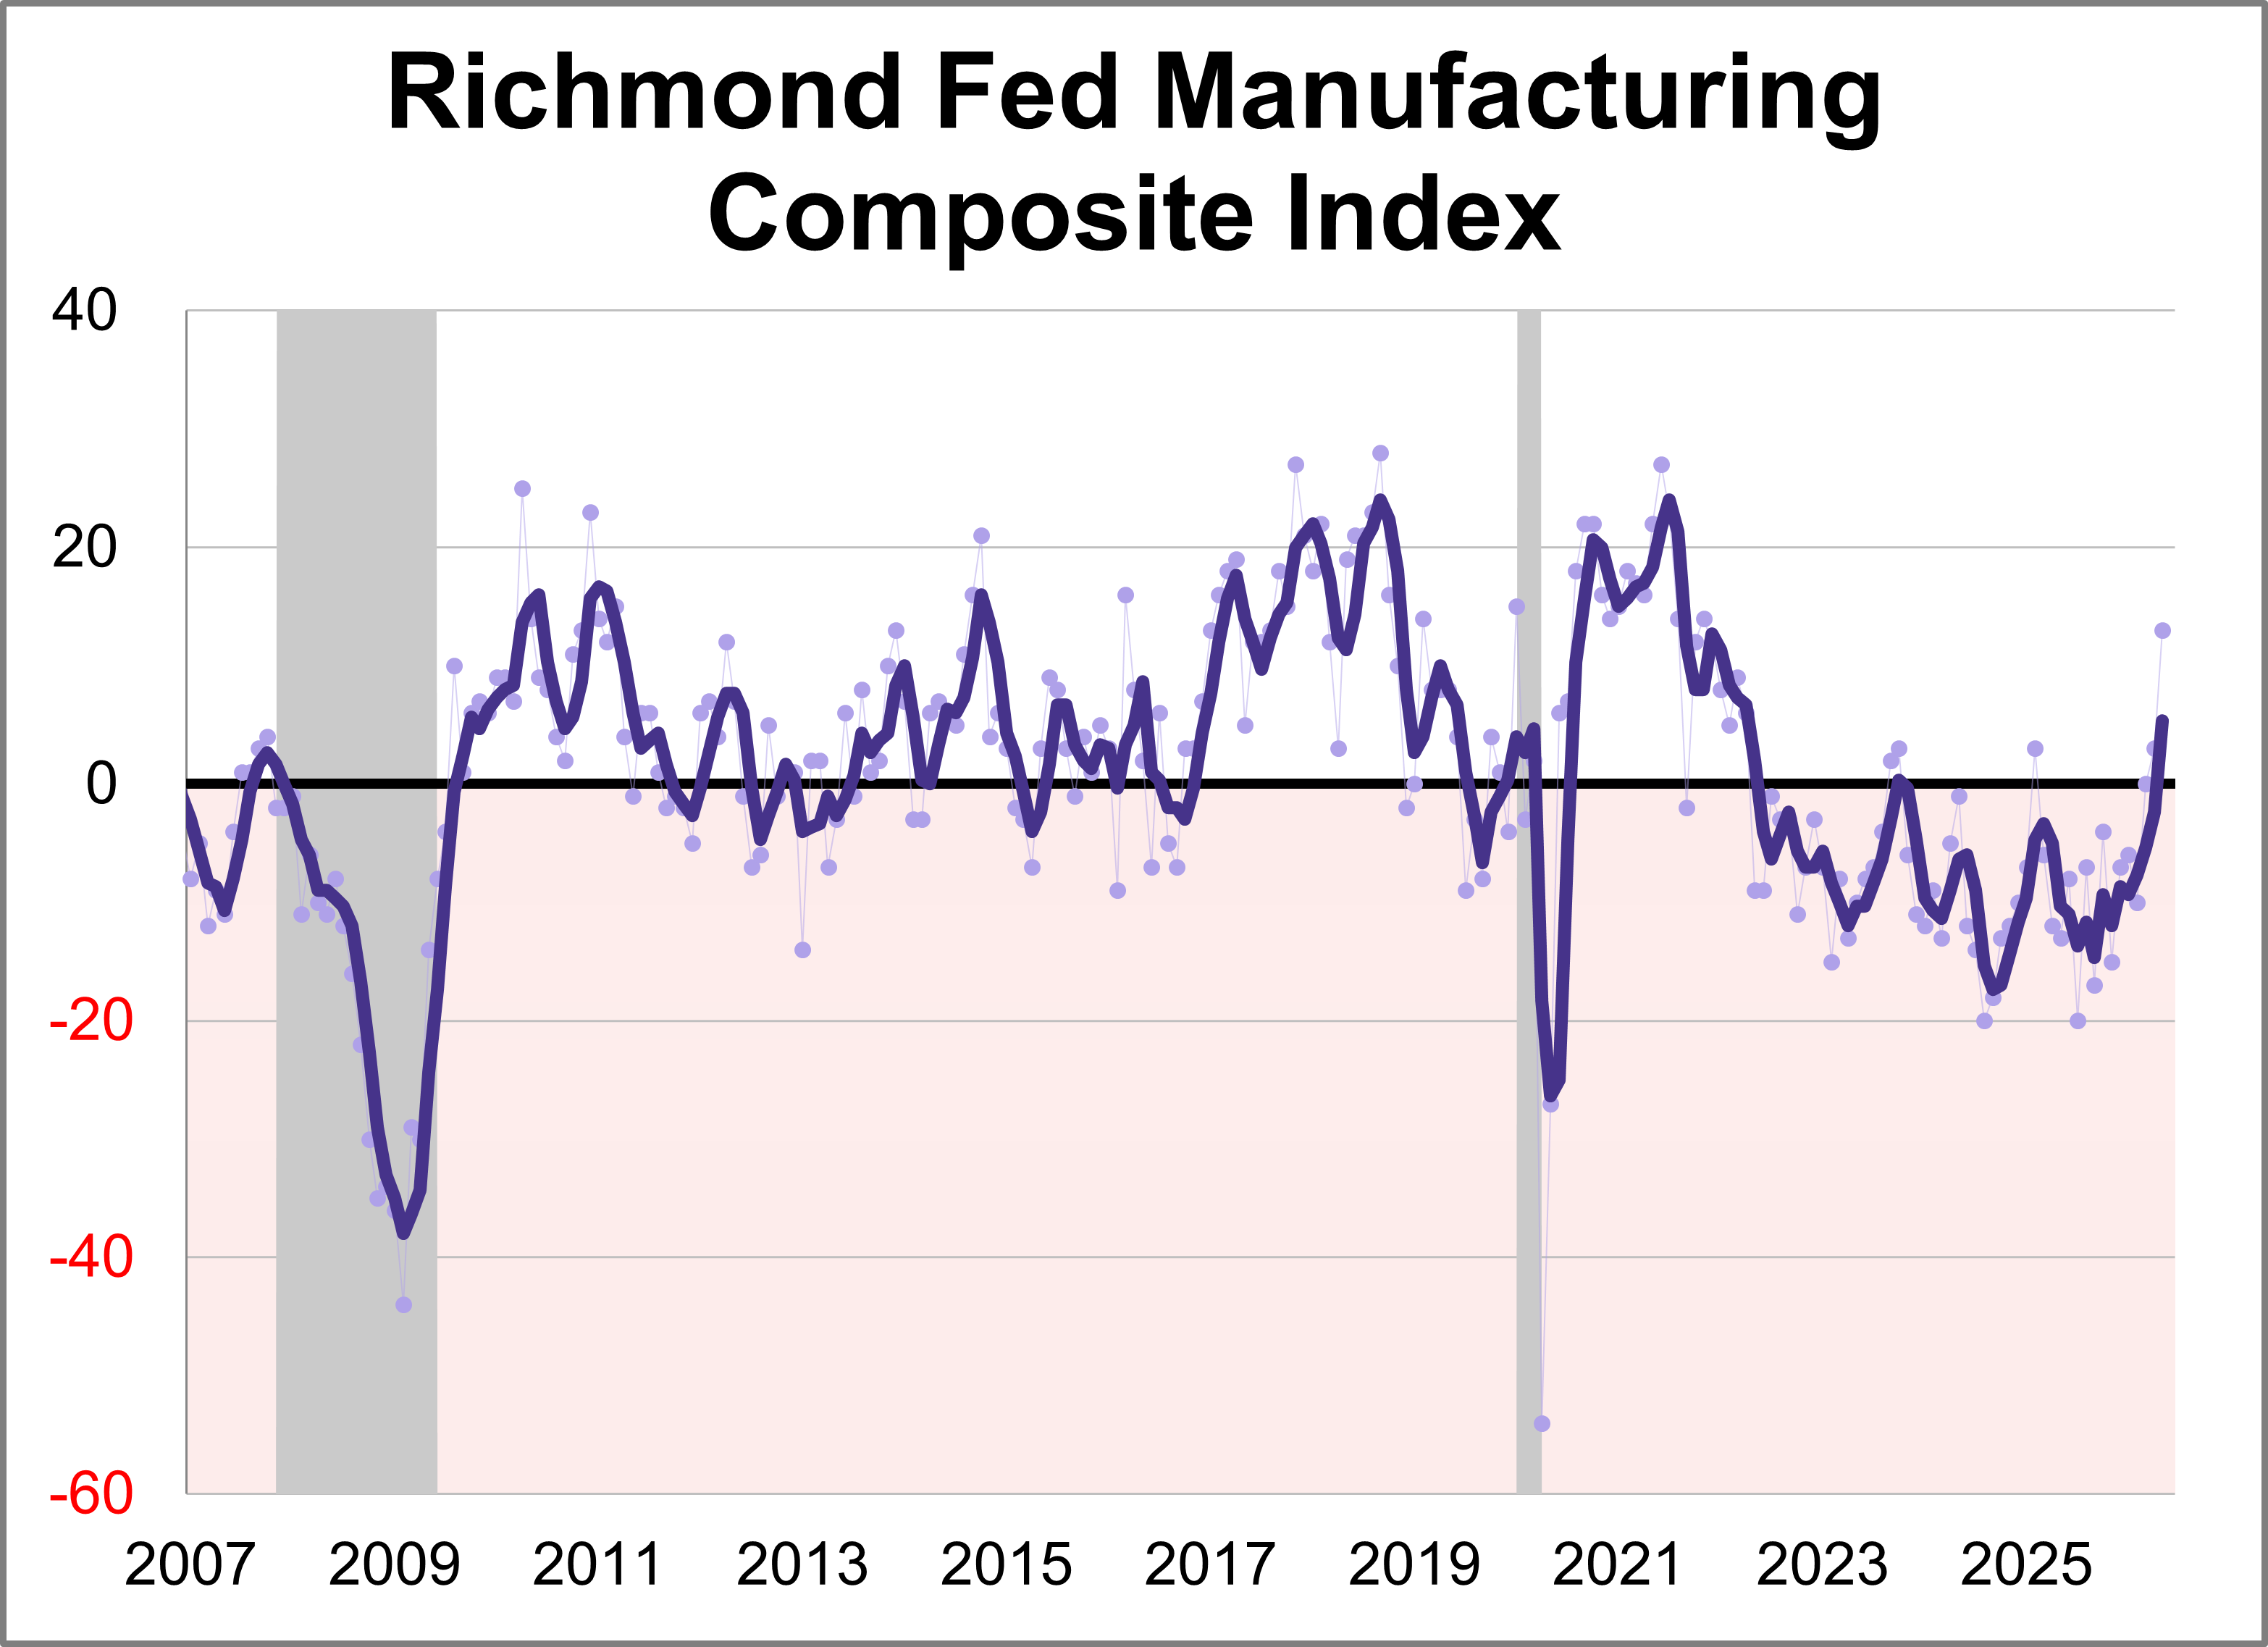
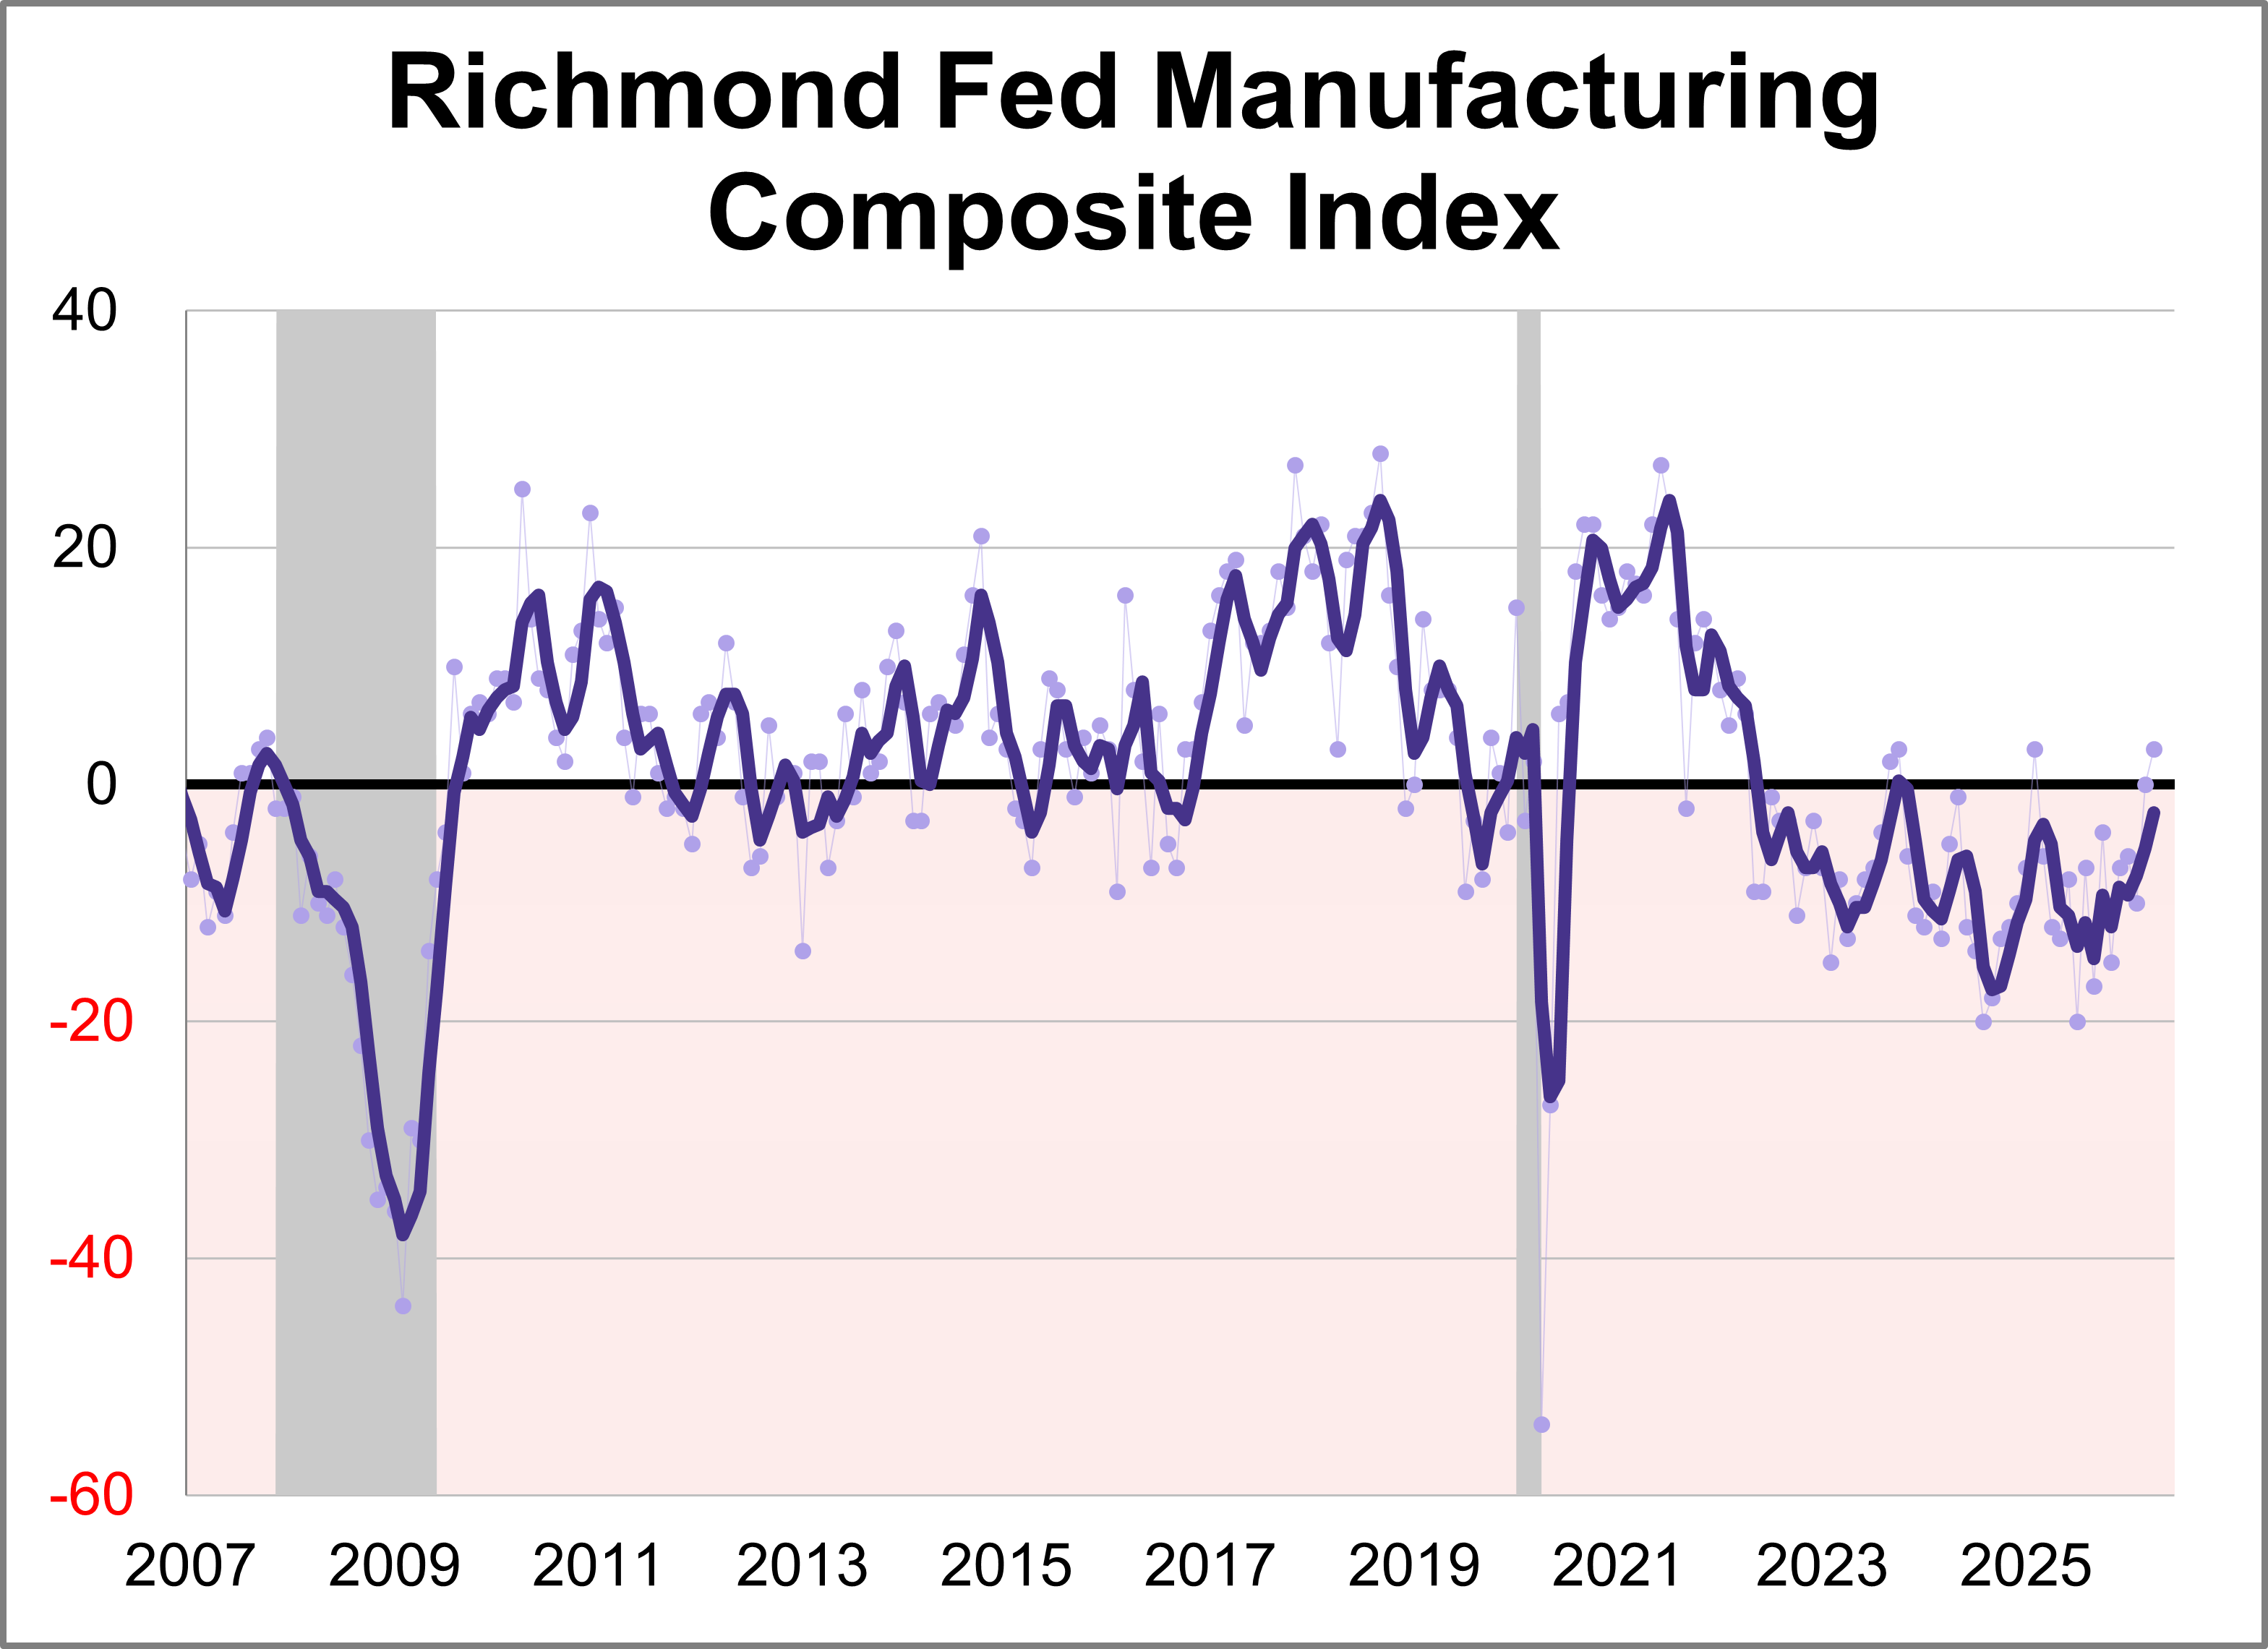
Fifth district manufacturing activity was flat in June, according to the most recent survey from the Federal Reserve Bank of Richmond. The composite manufacturing index fell nine points points to 4, marking the third consecutive positive reading. This month's reading was below the forecast of 8.
As the summer economic landscape takes shape, investors are navigating shifting monetary policy, stubborn inflation pressures, and unexpected market momentum. This week’s snapshot breaks down the most critical updates and data releases from the past week to give you a clear view of where the economy is heading.
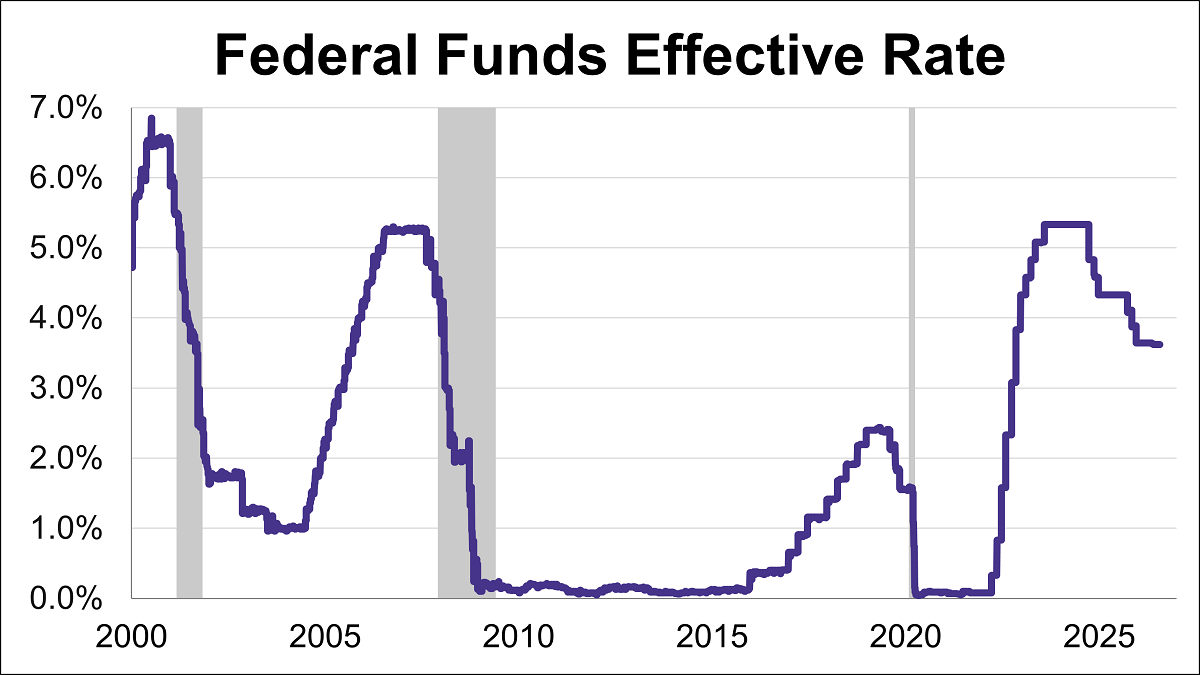
The Federal Reserve concluded its fourth meeting of the year by holding the federal funds rate (FFR) steady in the 3.50%-3.75% range.
The U.S. economy faced intensifying headwinds in May as both consumer and wholesale inflation metrics surged to multi-year highs.
The U.S. labor market took center stage last week as three major labor market indicators outperformed forecasts. Robust payroll additions in both the public and private sectors, paired with a massive surge in job openings, point to a workforce on solid footing.
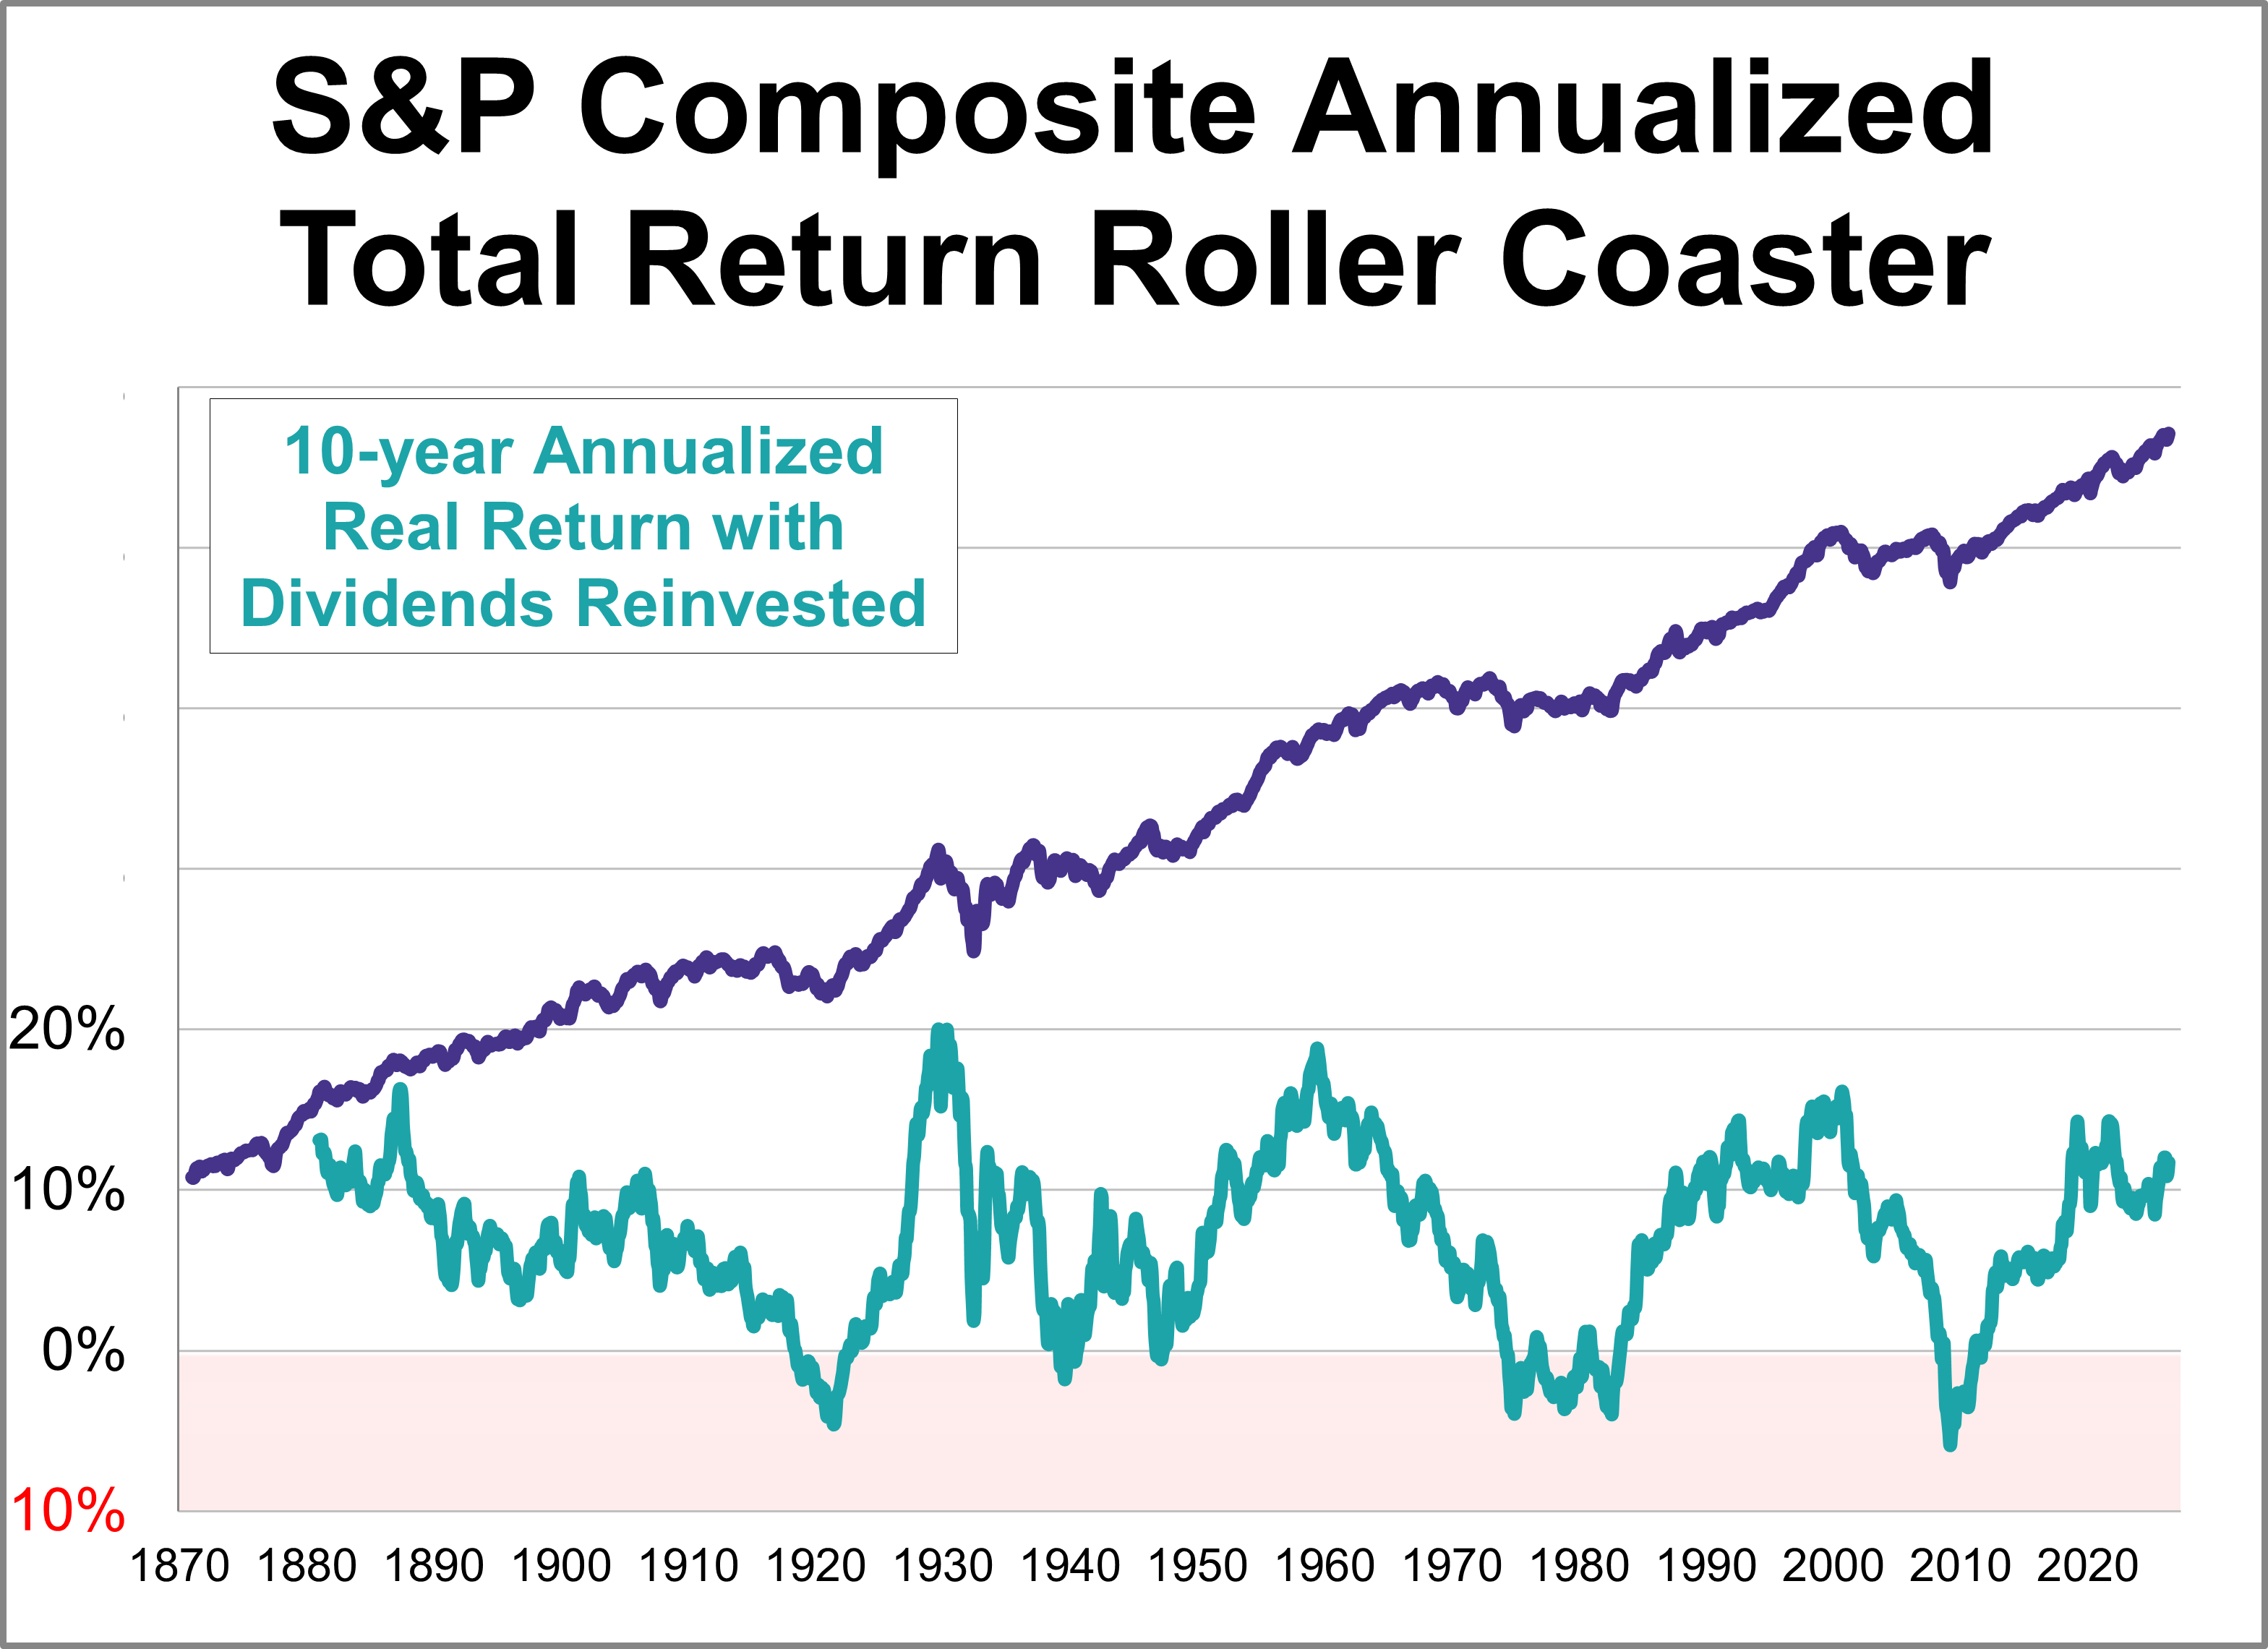
Here's an interesting set of charts that will especially resonate with those of us who follow economic and market cycles. Imagine that five years ago you invested $10,000 in the S&P 500. How much would it be worth today, with dividends reinvested but adjusted for inflation?
Last week’s data tracked a shifting economic trajectory over the last several months. While the latest reading on first-quarter GDP confirms the economy started the year with steady growth, subsequent inflation metrics moved higher and ultimately weighed on consumer confidence.
Fifth district manufacturing activity increased in May according to the most recent survey from the Federal Reserve Bank of Richmond. The composite manufacturing index rose ten points points to 13, marking the highest level in nearly five years. This month's reading was above the forecast of 4.
The Dallas Fed released its Texas Manufacturing Outlook Survey (TMOS) for May. The general business activity index rose 2.7 points to 0.4, indicating slower growth of manufacturing activity and stable business conditions perceptions.
There is currently a stark contrast between everyday consumer confidence and financial market behavior. On one hand, persistent inflation and elevated living costs have driven consumer sentiment to historic lows. On the other hand, financial market participants are exhibiting aggressive risk appetite, with margin debt surging to an all-time high record on the heels of major equity market gains.
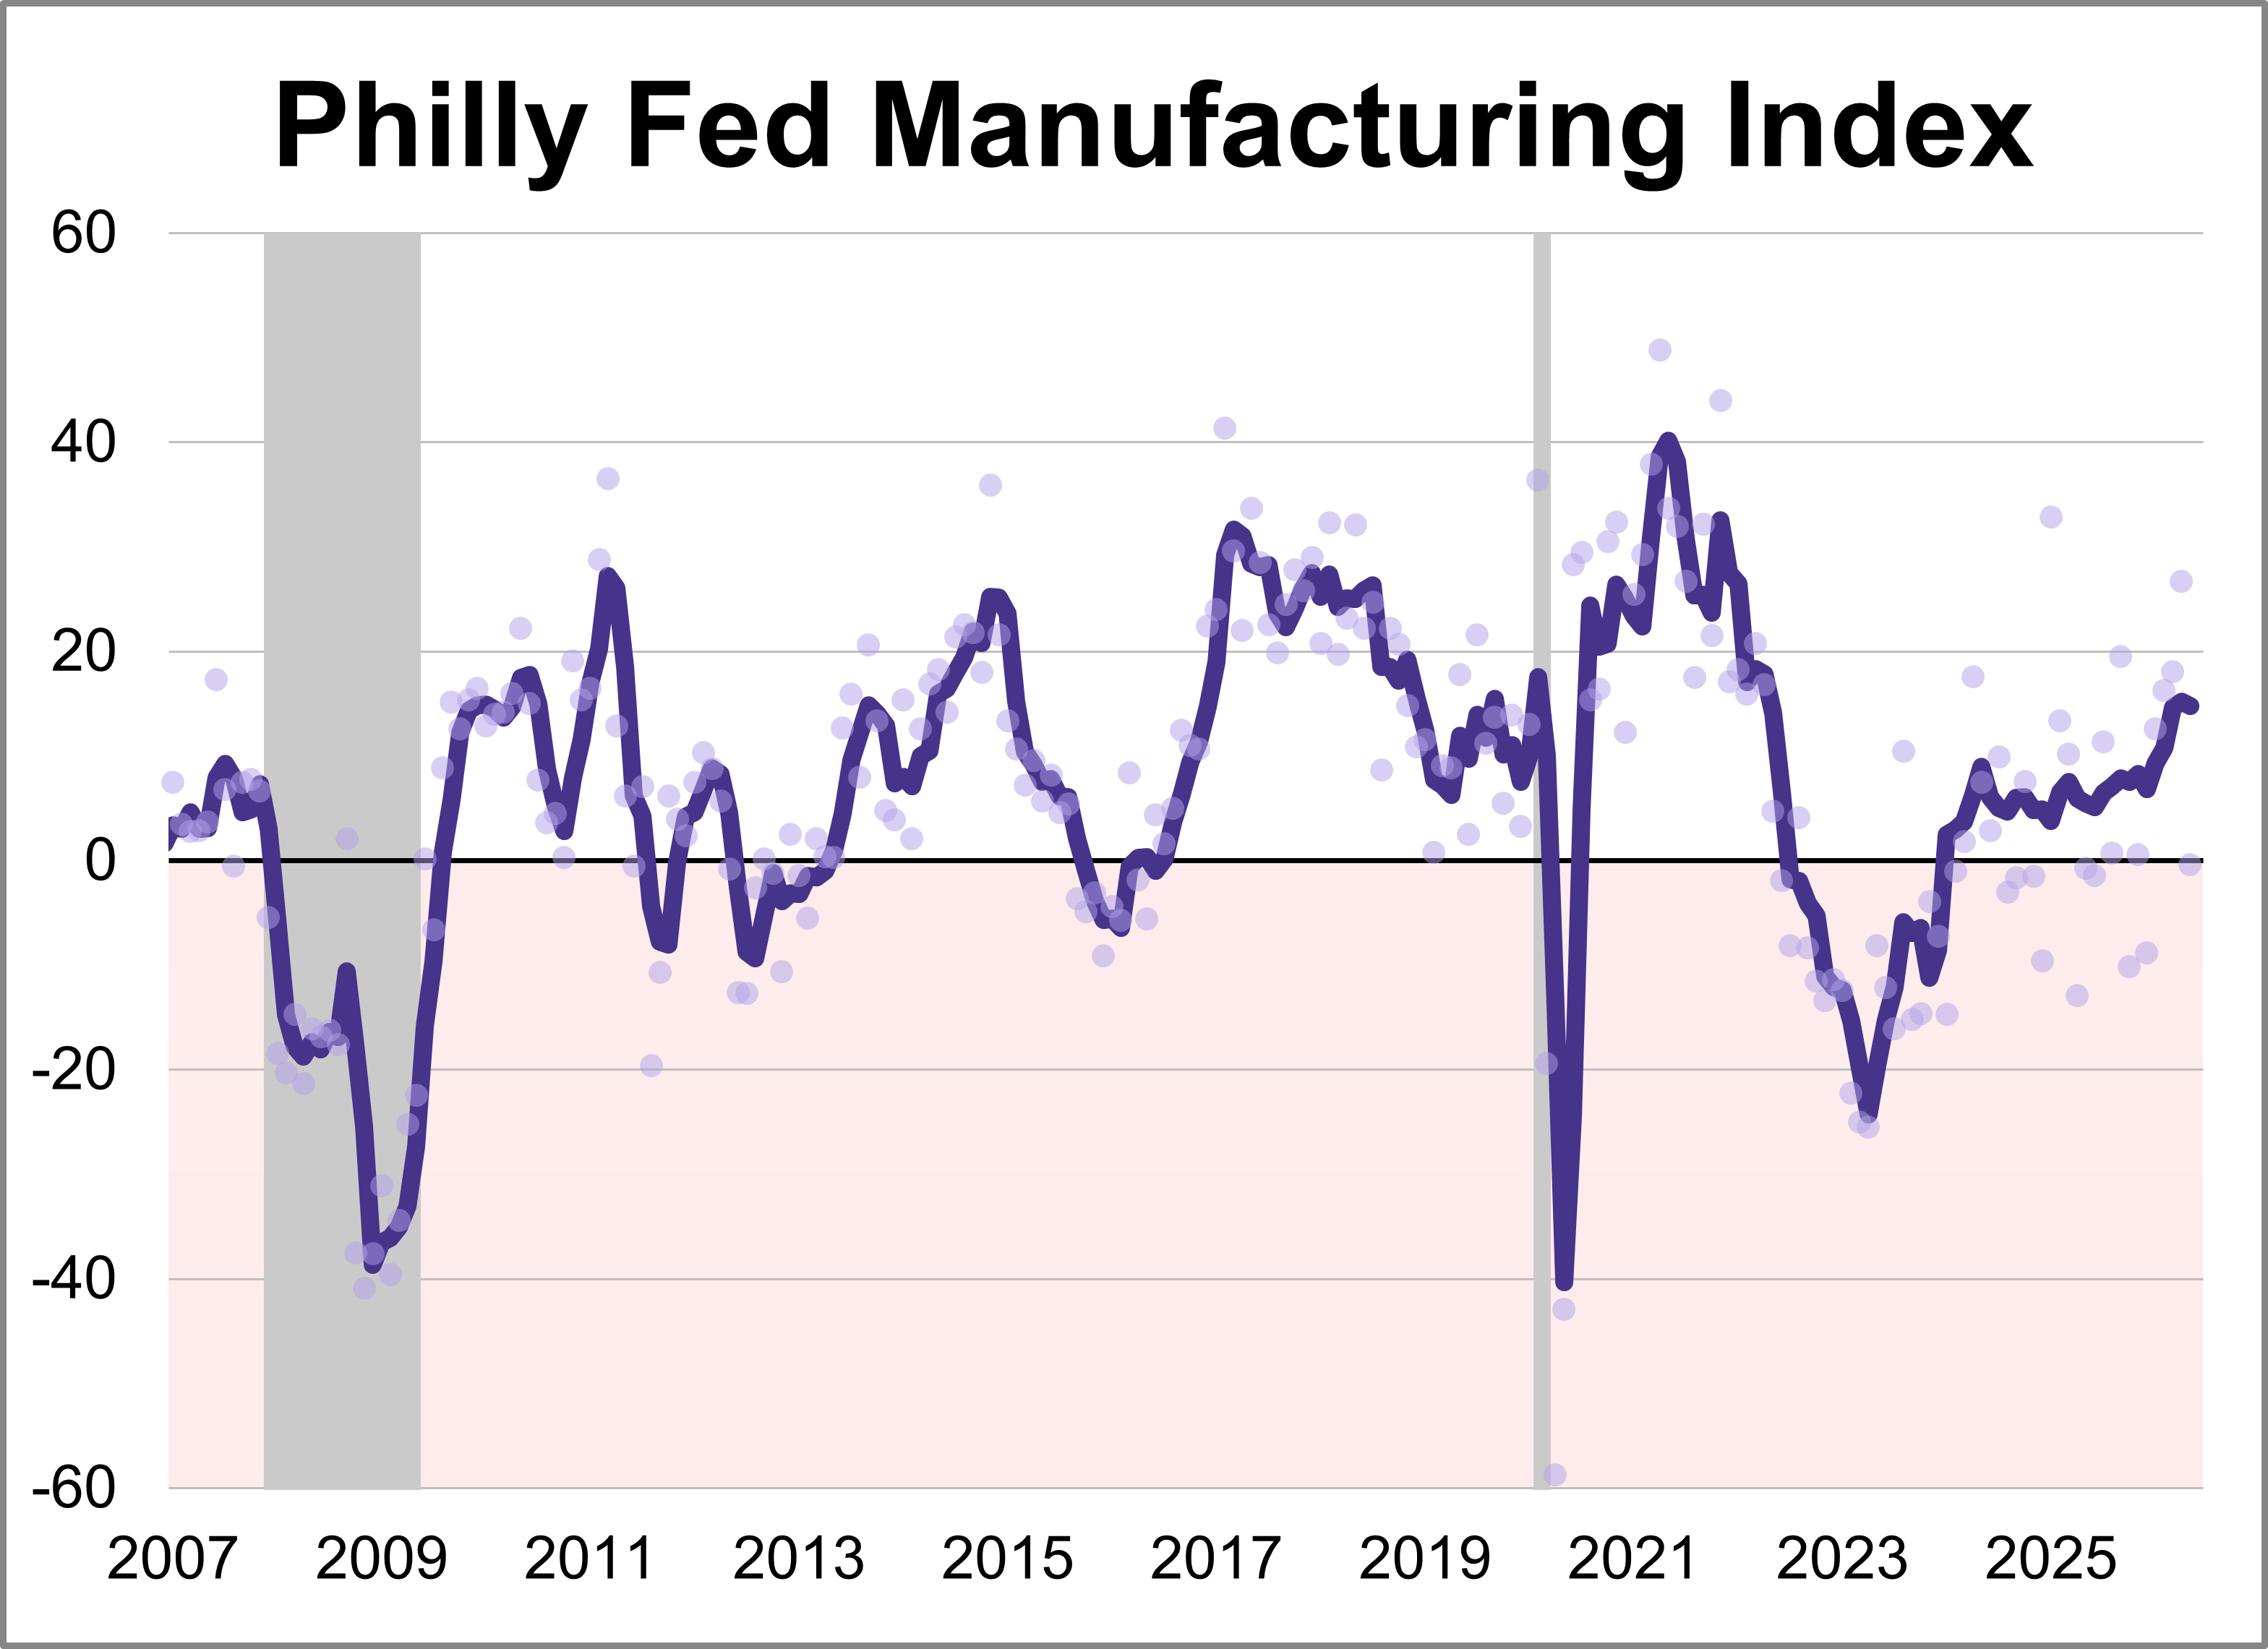
The latest Philadelphia Fed manufacturing index showed activity weakened in May, with the index sinking 27.1 points to -0.4. The latest reading marked the lowest level for the index this year and was worse than the forecast of 17.6.
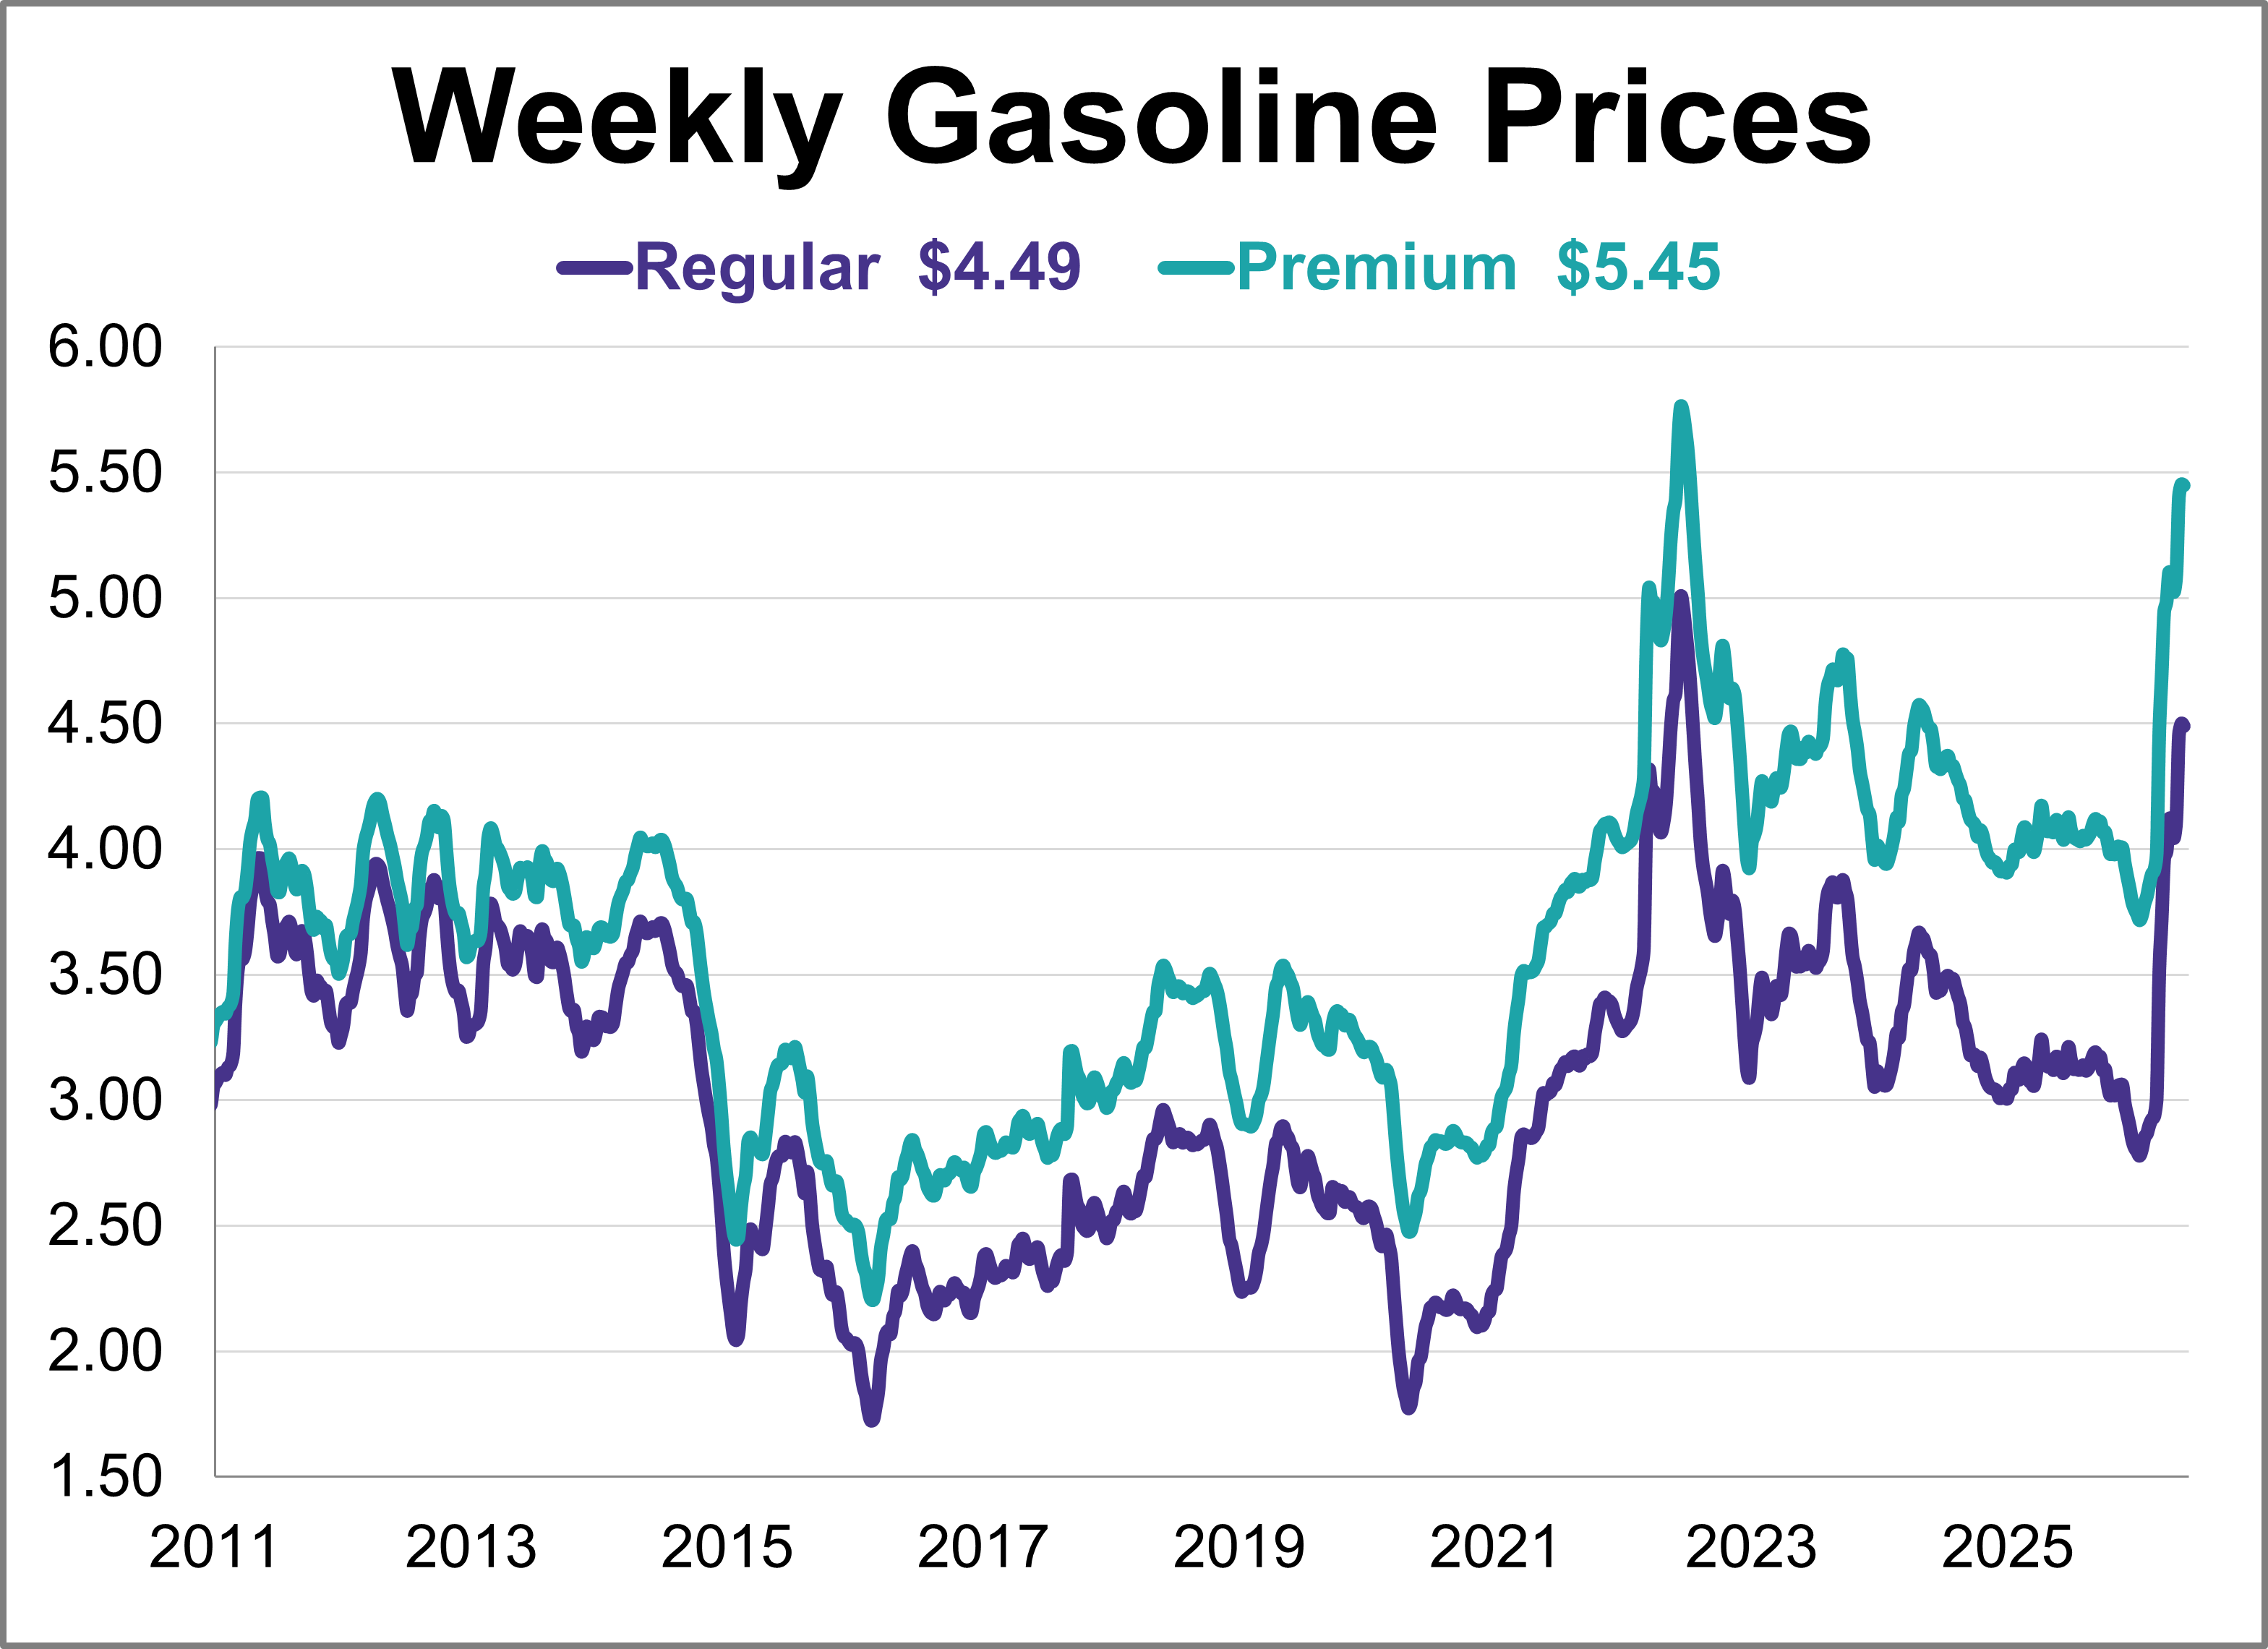
Gas prices were relatively flat this week, remaining at their highest level in nearly four years. As of May 18th, weekly prices were down 1 cent for regular and were unchanged for premium.
The U.S. economic landscape in April was defined by a significant rebound in inflation across both consumer and wholesale sectors, complicating the path for future monetary policy.
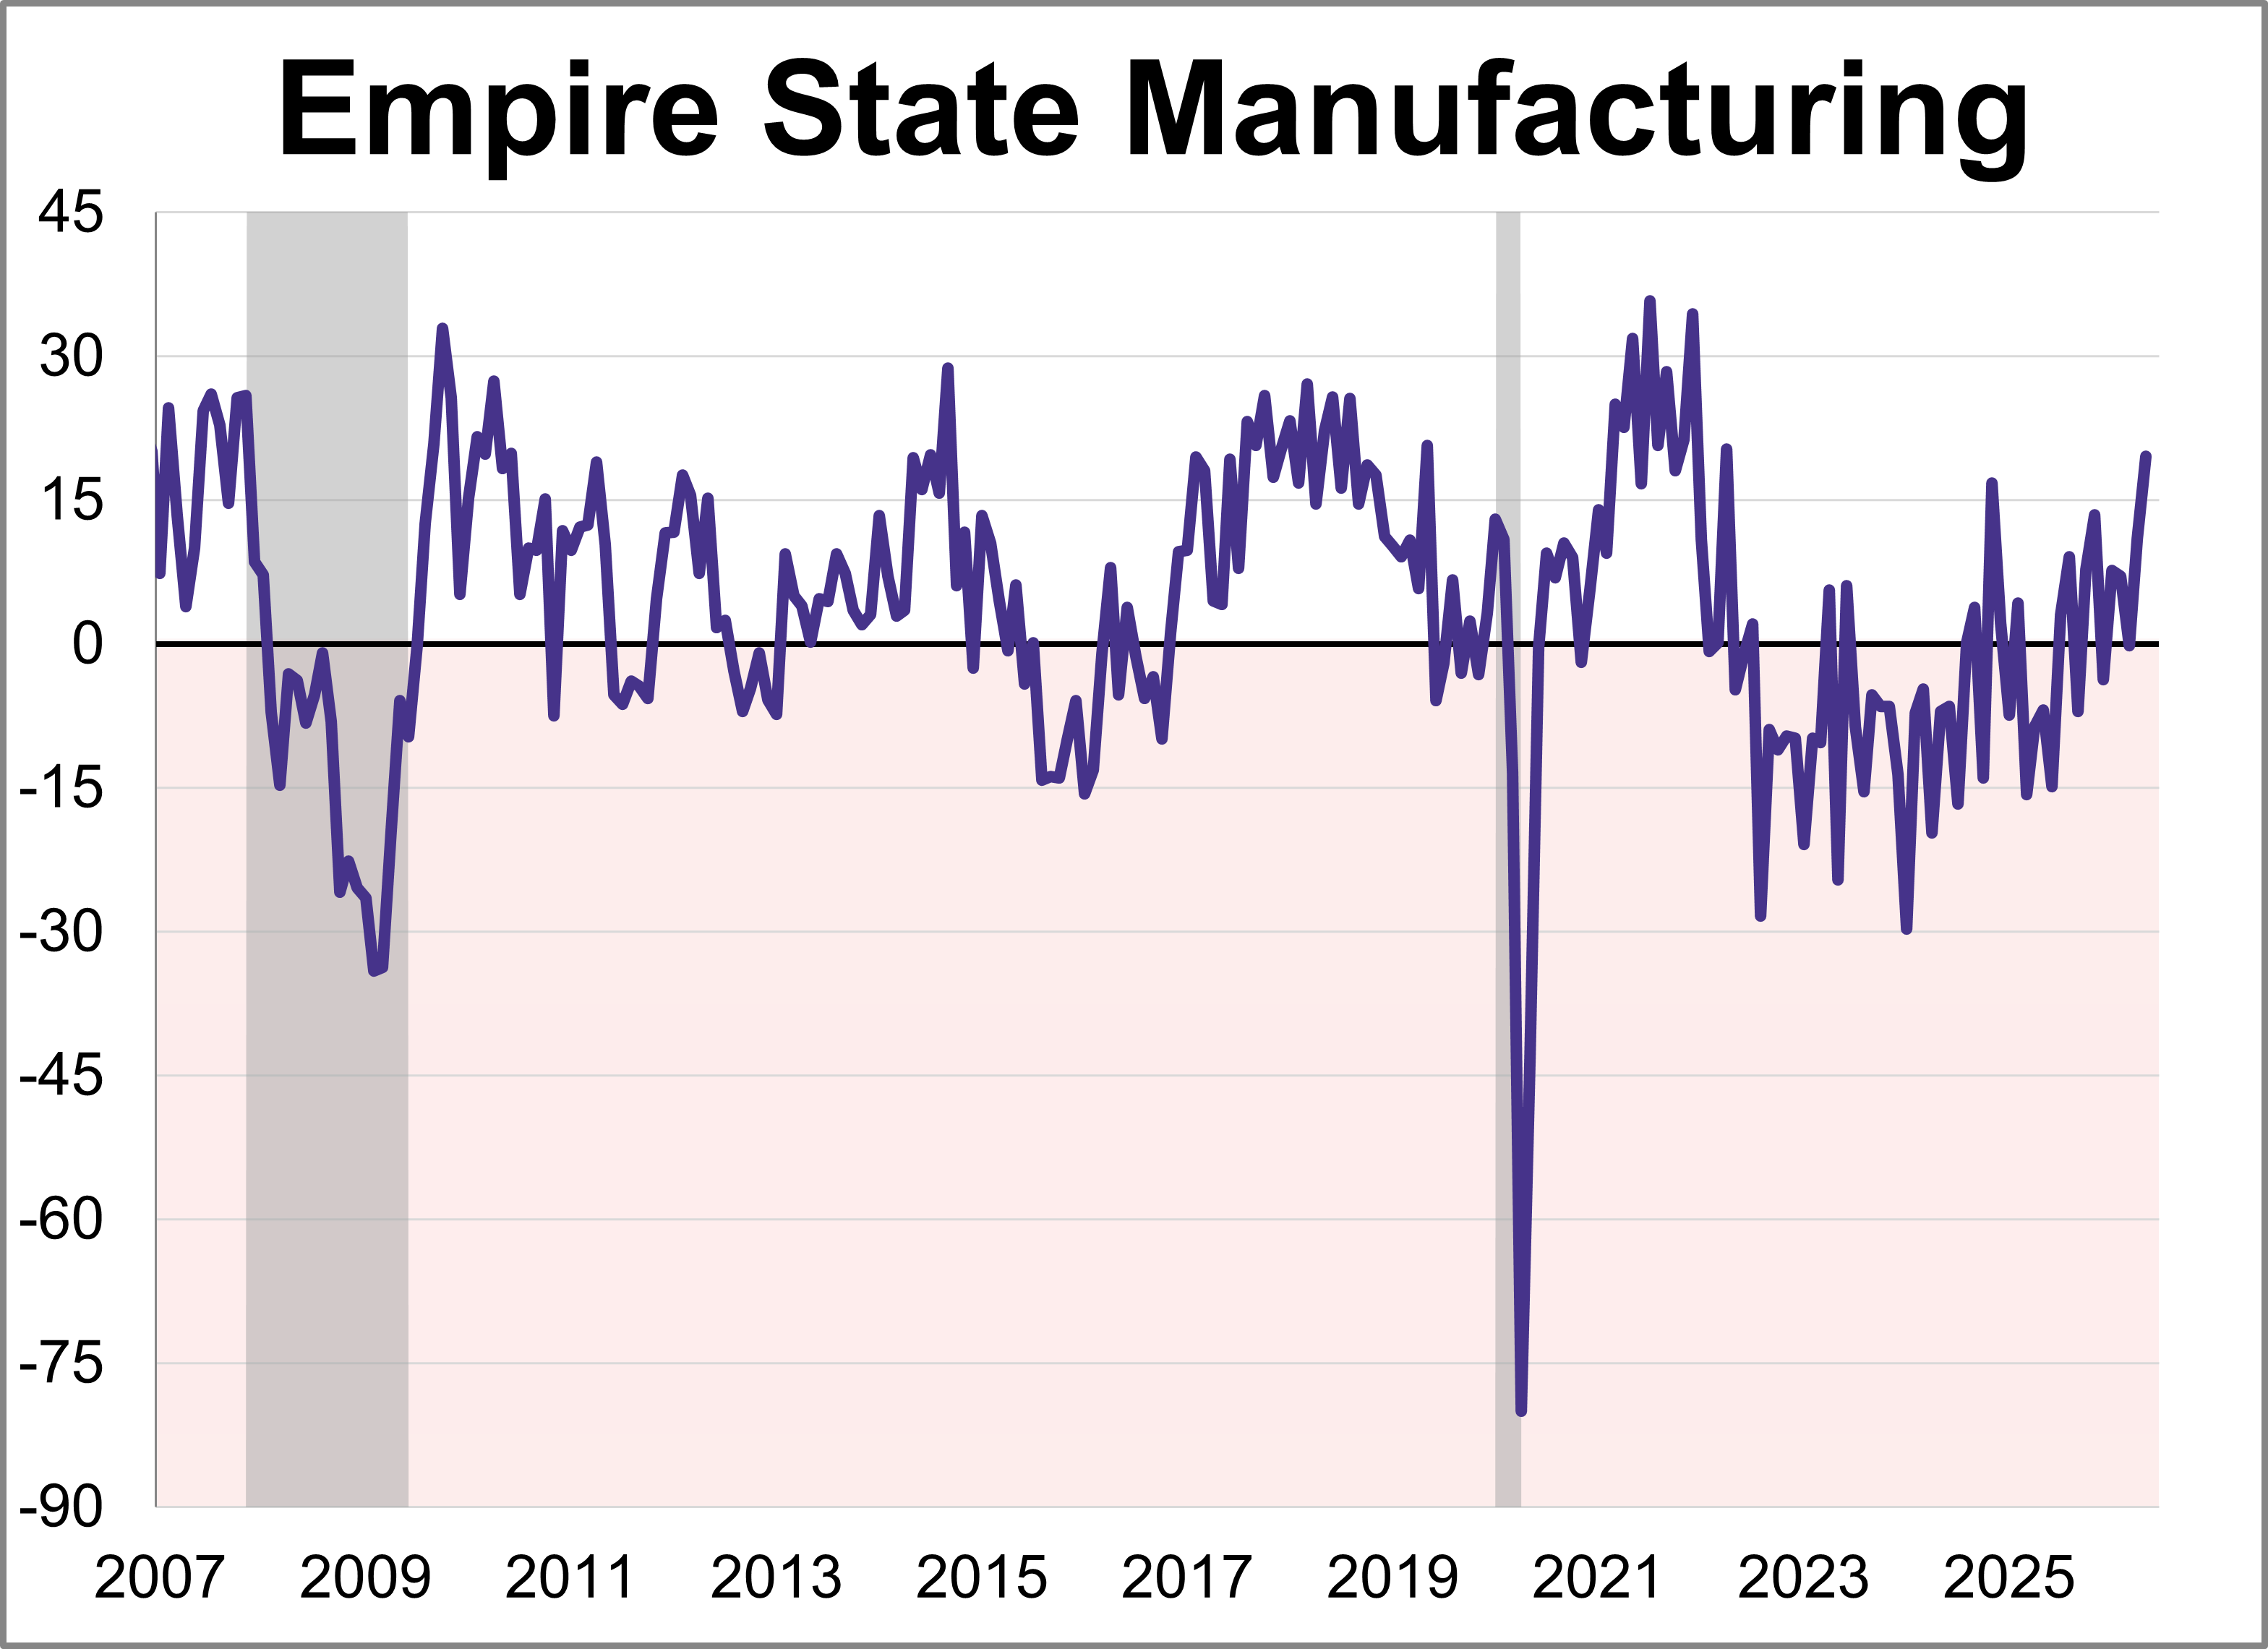
Manufacturing activity grew strongly in New York State, according to the Empire State Manufacturing May survey. The diffusion index for General Business Conditions rose 8.6 points to 19.6, its highest level in over four years.
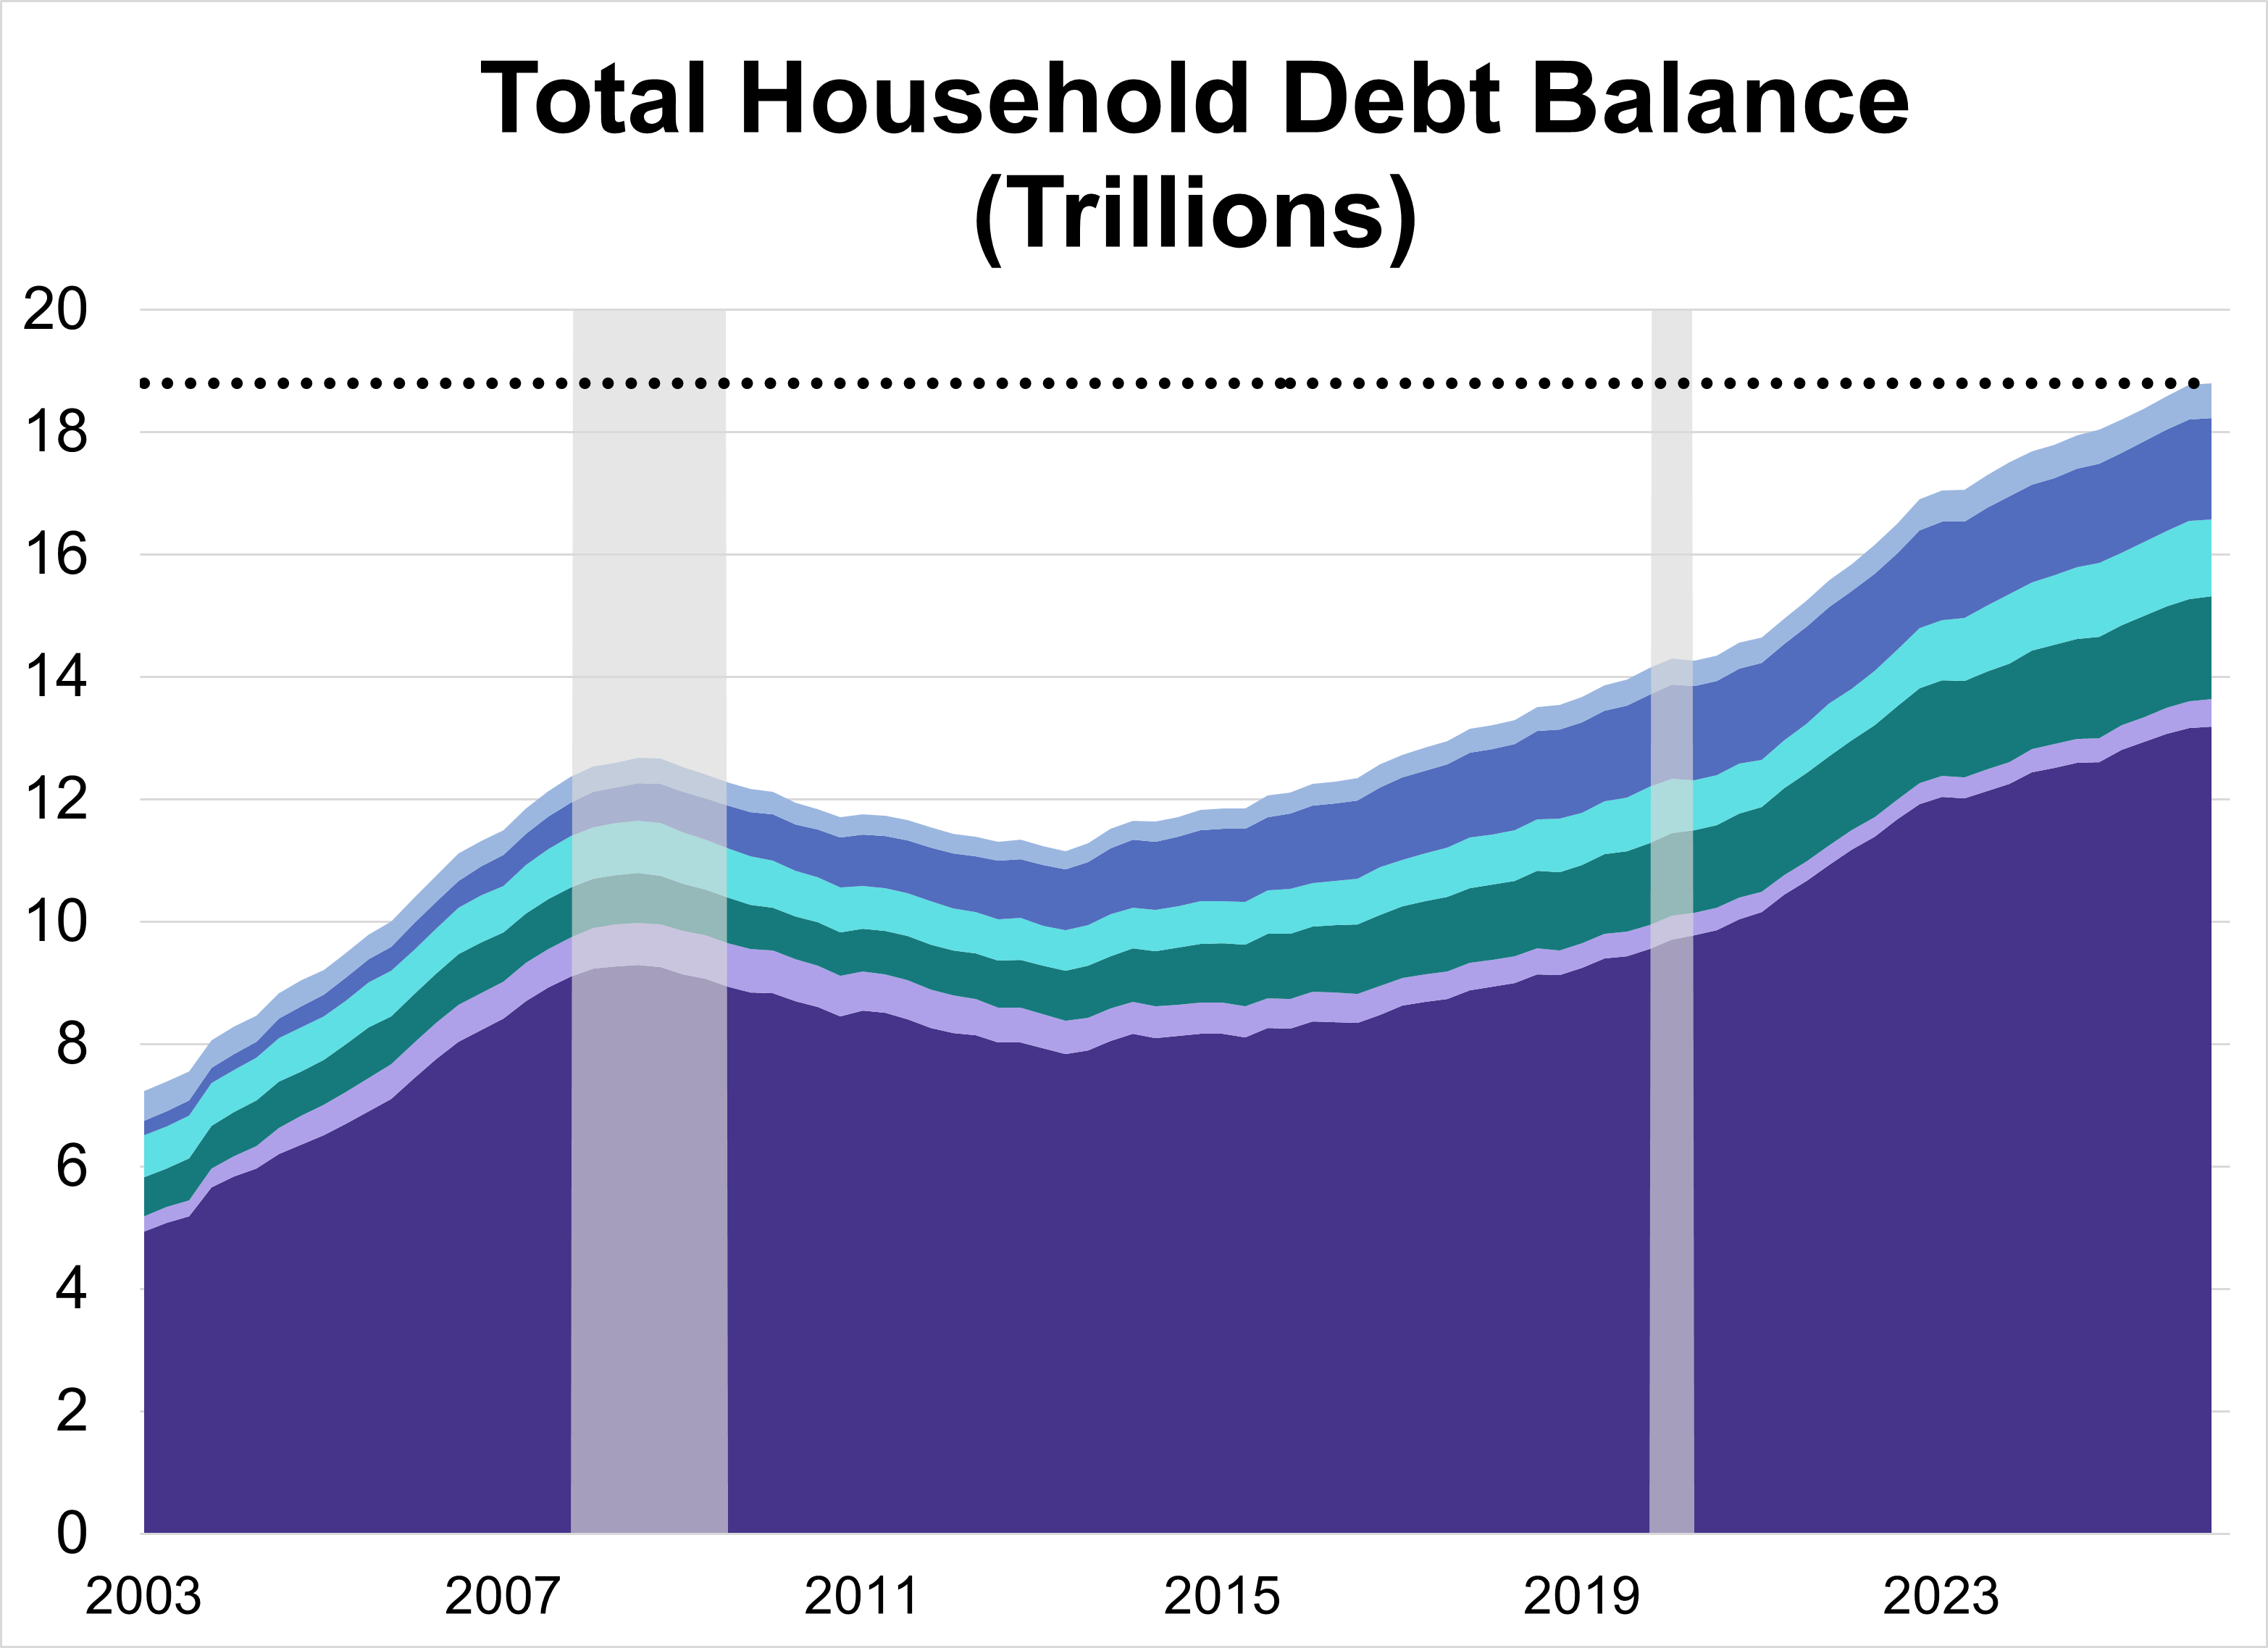
Total U.S. household debt climbed to a record $18.79 trillion in Q1 2026, a modest 0.1% ($18 billion) increase from the previous quarter. The overall rise was driven by increases across a handful of categories, specifically mortgage and auto loan balances.
The U.S. labor market demonstrated remarkable endurance in April, with job gains outpacing expectations and private sector expansion reaching its strongest point in over a year. As the Federal Reserve maintains a steady interest rate policy, the focus now turns to upcoming inflation and retail data to gauge the sustainability of this momentum.
The U.S. economy ended April with mixed signals: steady interest rates and high Fed dissent met persistent, energy-driven inflation. Despite these hurdles, accelerated Q1 growth and rising consumer confidence provided a buffer against ongoing global instability.
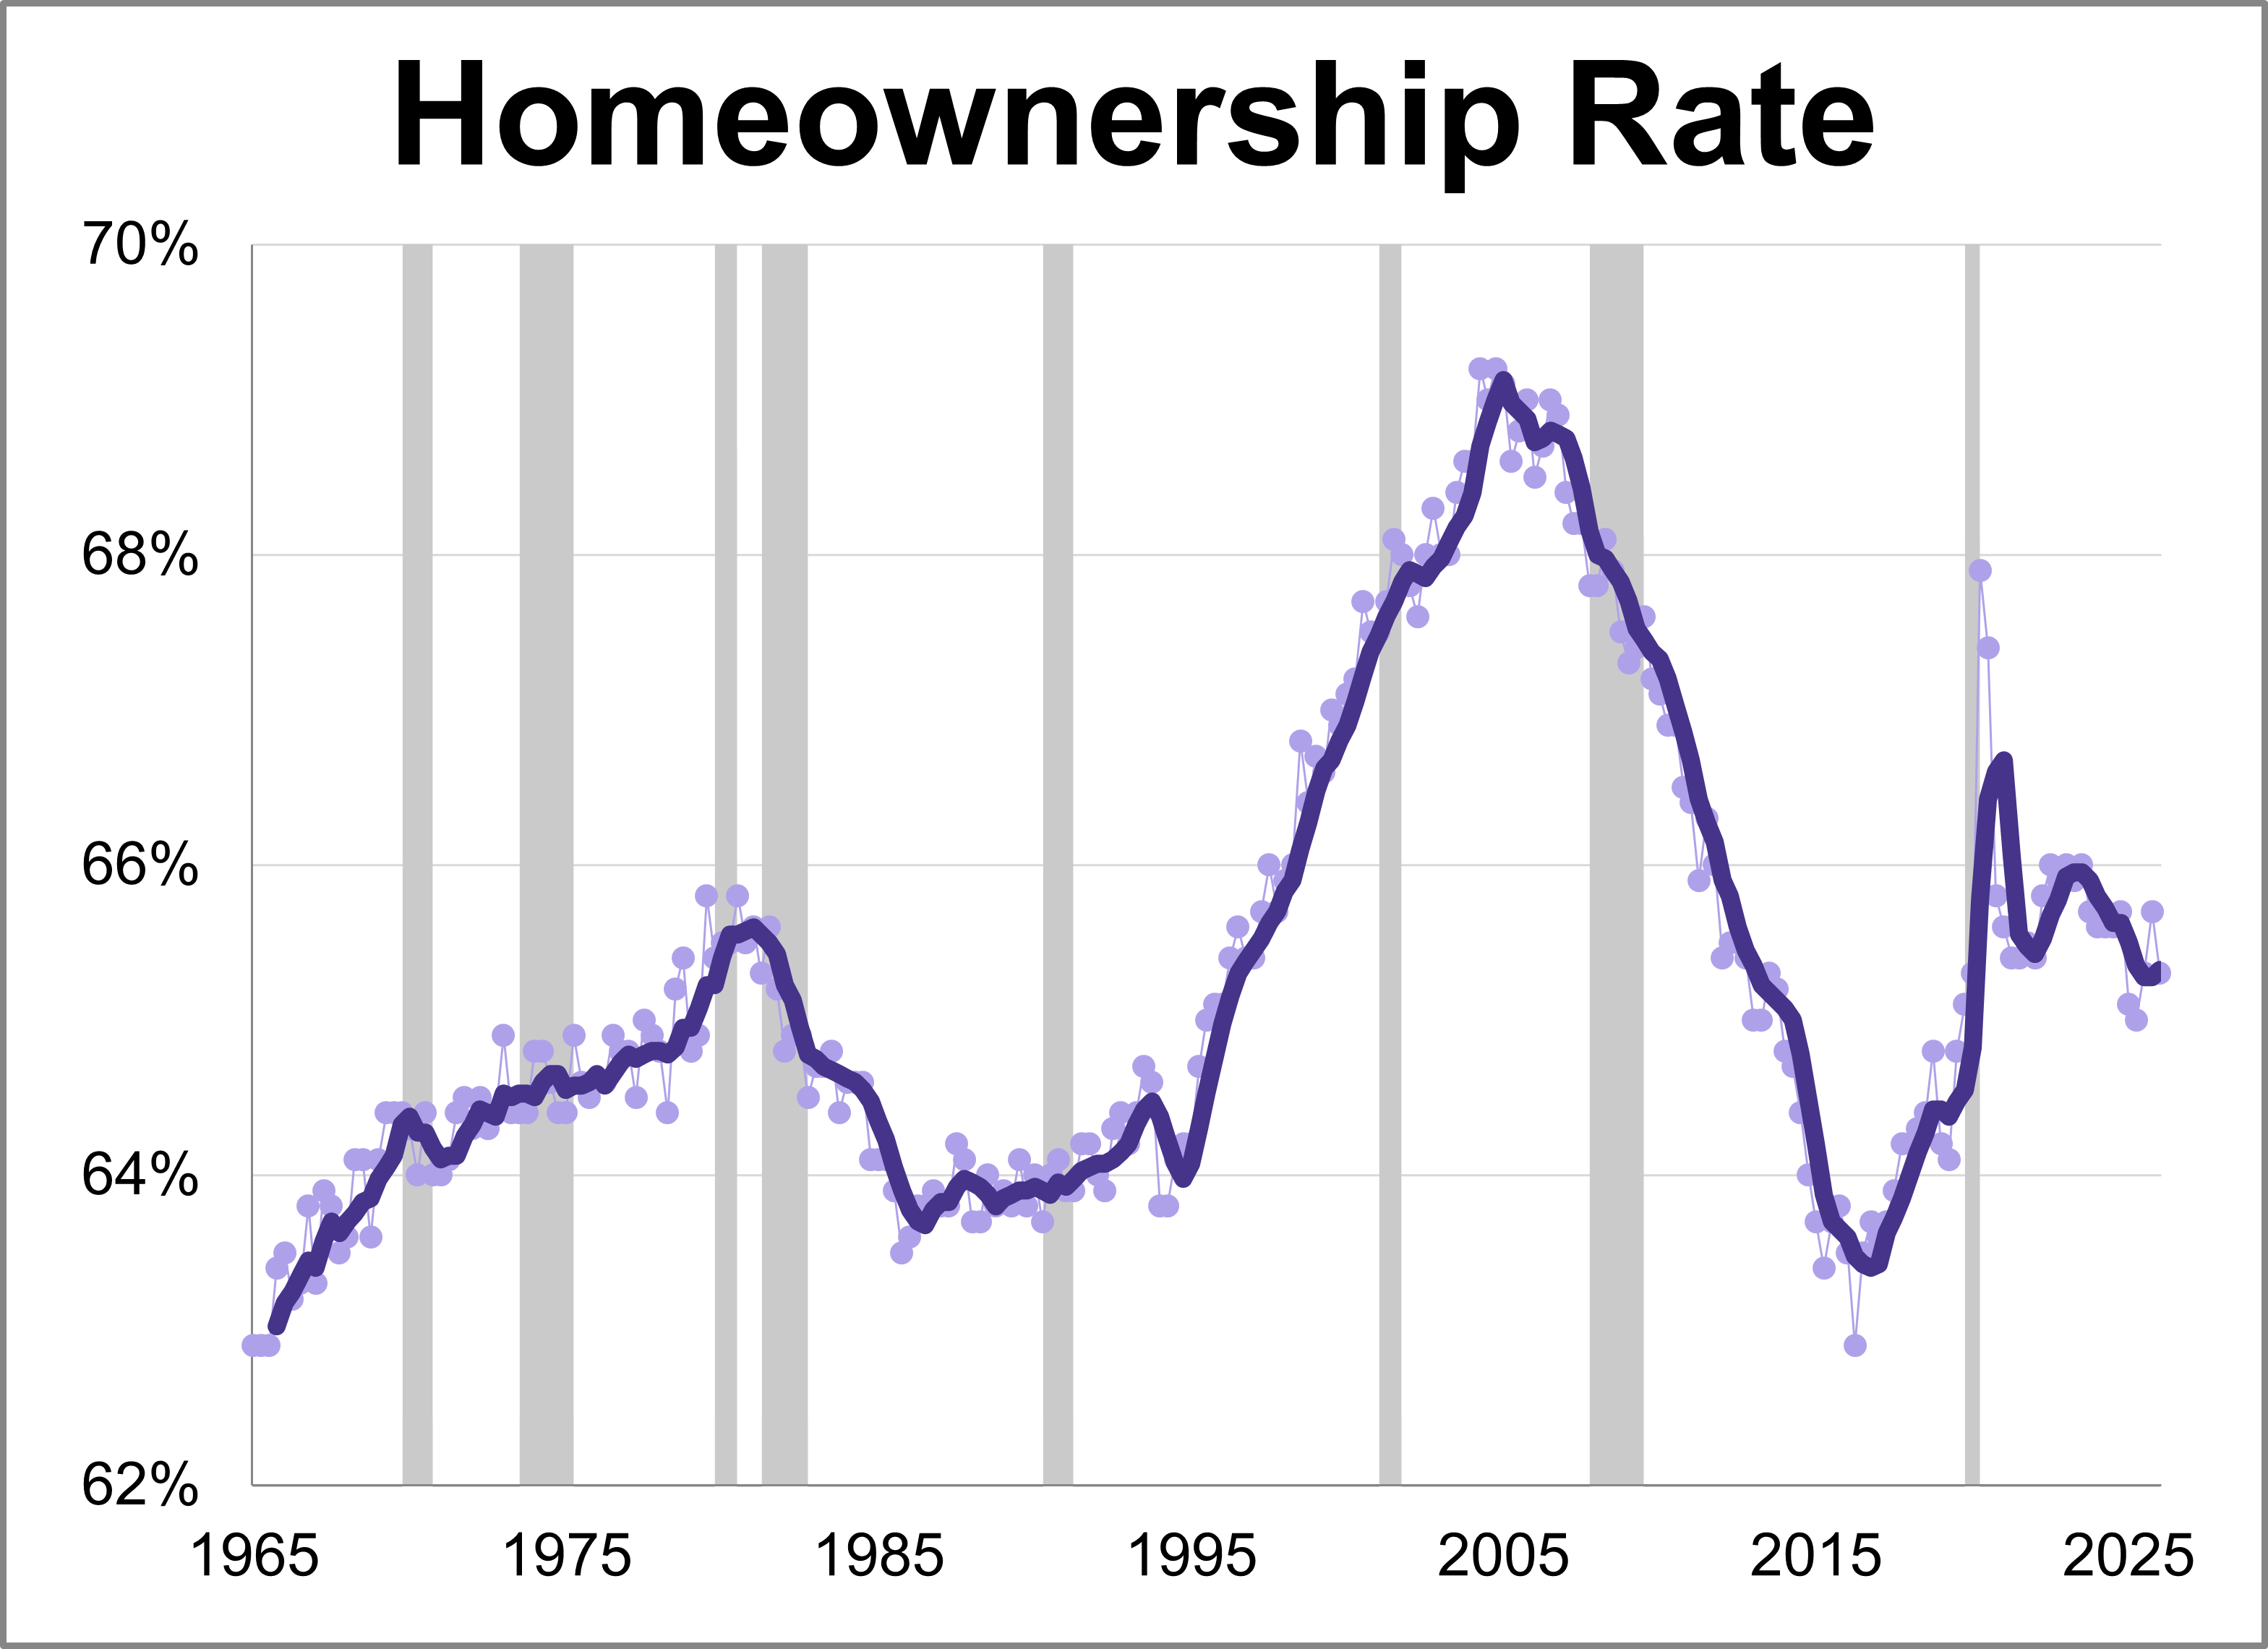
The Census Bureau released its latest quarterly report for Q1 2026 showing the latest homeownership rate is at 65.3%.
Fifth district manufacturing activity increased in April according to the most recent survey from the Federal Reserve Bank of Richmond. The composite manufacturing index rose three points points to 3, marking the highest level for the index in 20 months. This month's reading was above the forecast of 2.
Last week’s economic data was defined by conflicting signals from the consumer. While retail figures suggest resilience, sentiment levels have plummeted to record lows. Meanwhile, the S&P 500 continued its historic rally as markets prepare for the upcoming Fed decision.
While recent market performance reflects optimism over potential geopolitical de-escalation, underlying economic data reveals a complex landscape of intensifying price pressures and cooling growth. This article examines the major economic news from the week of April 6-10th, 2026.
While recent market performance reflects optimism over potential geopolitical de-escalation, underlying economic data reveals a complex landscape of intensifying price pressures and cooling growth.
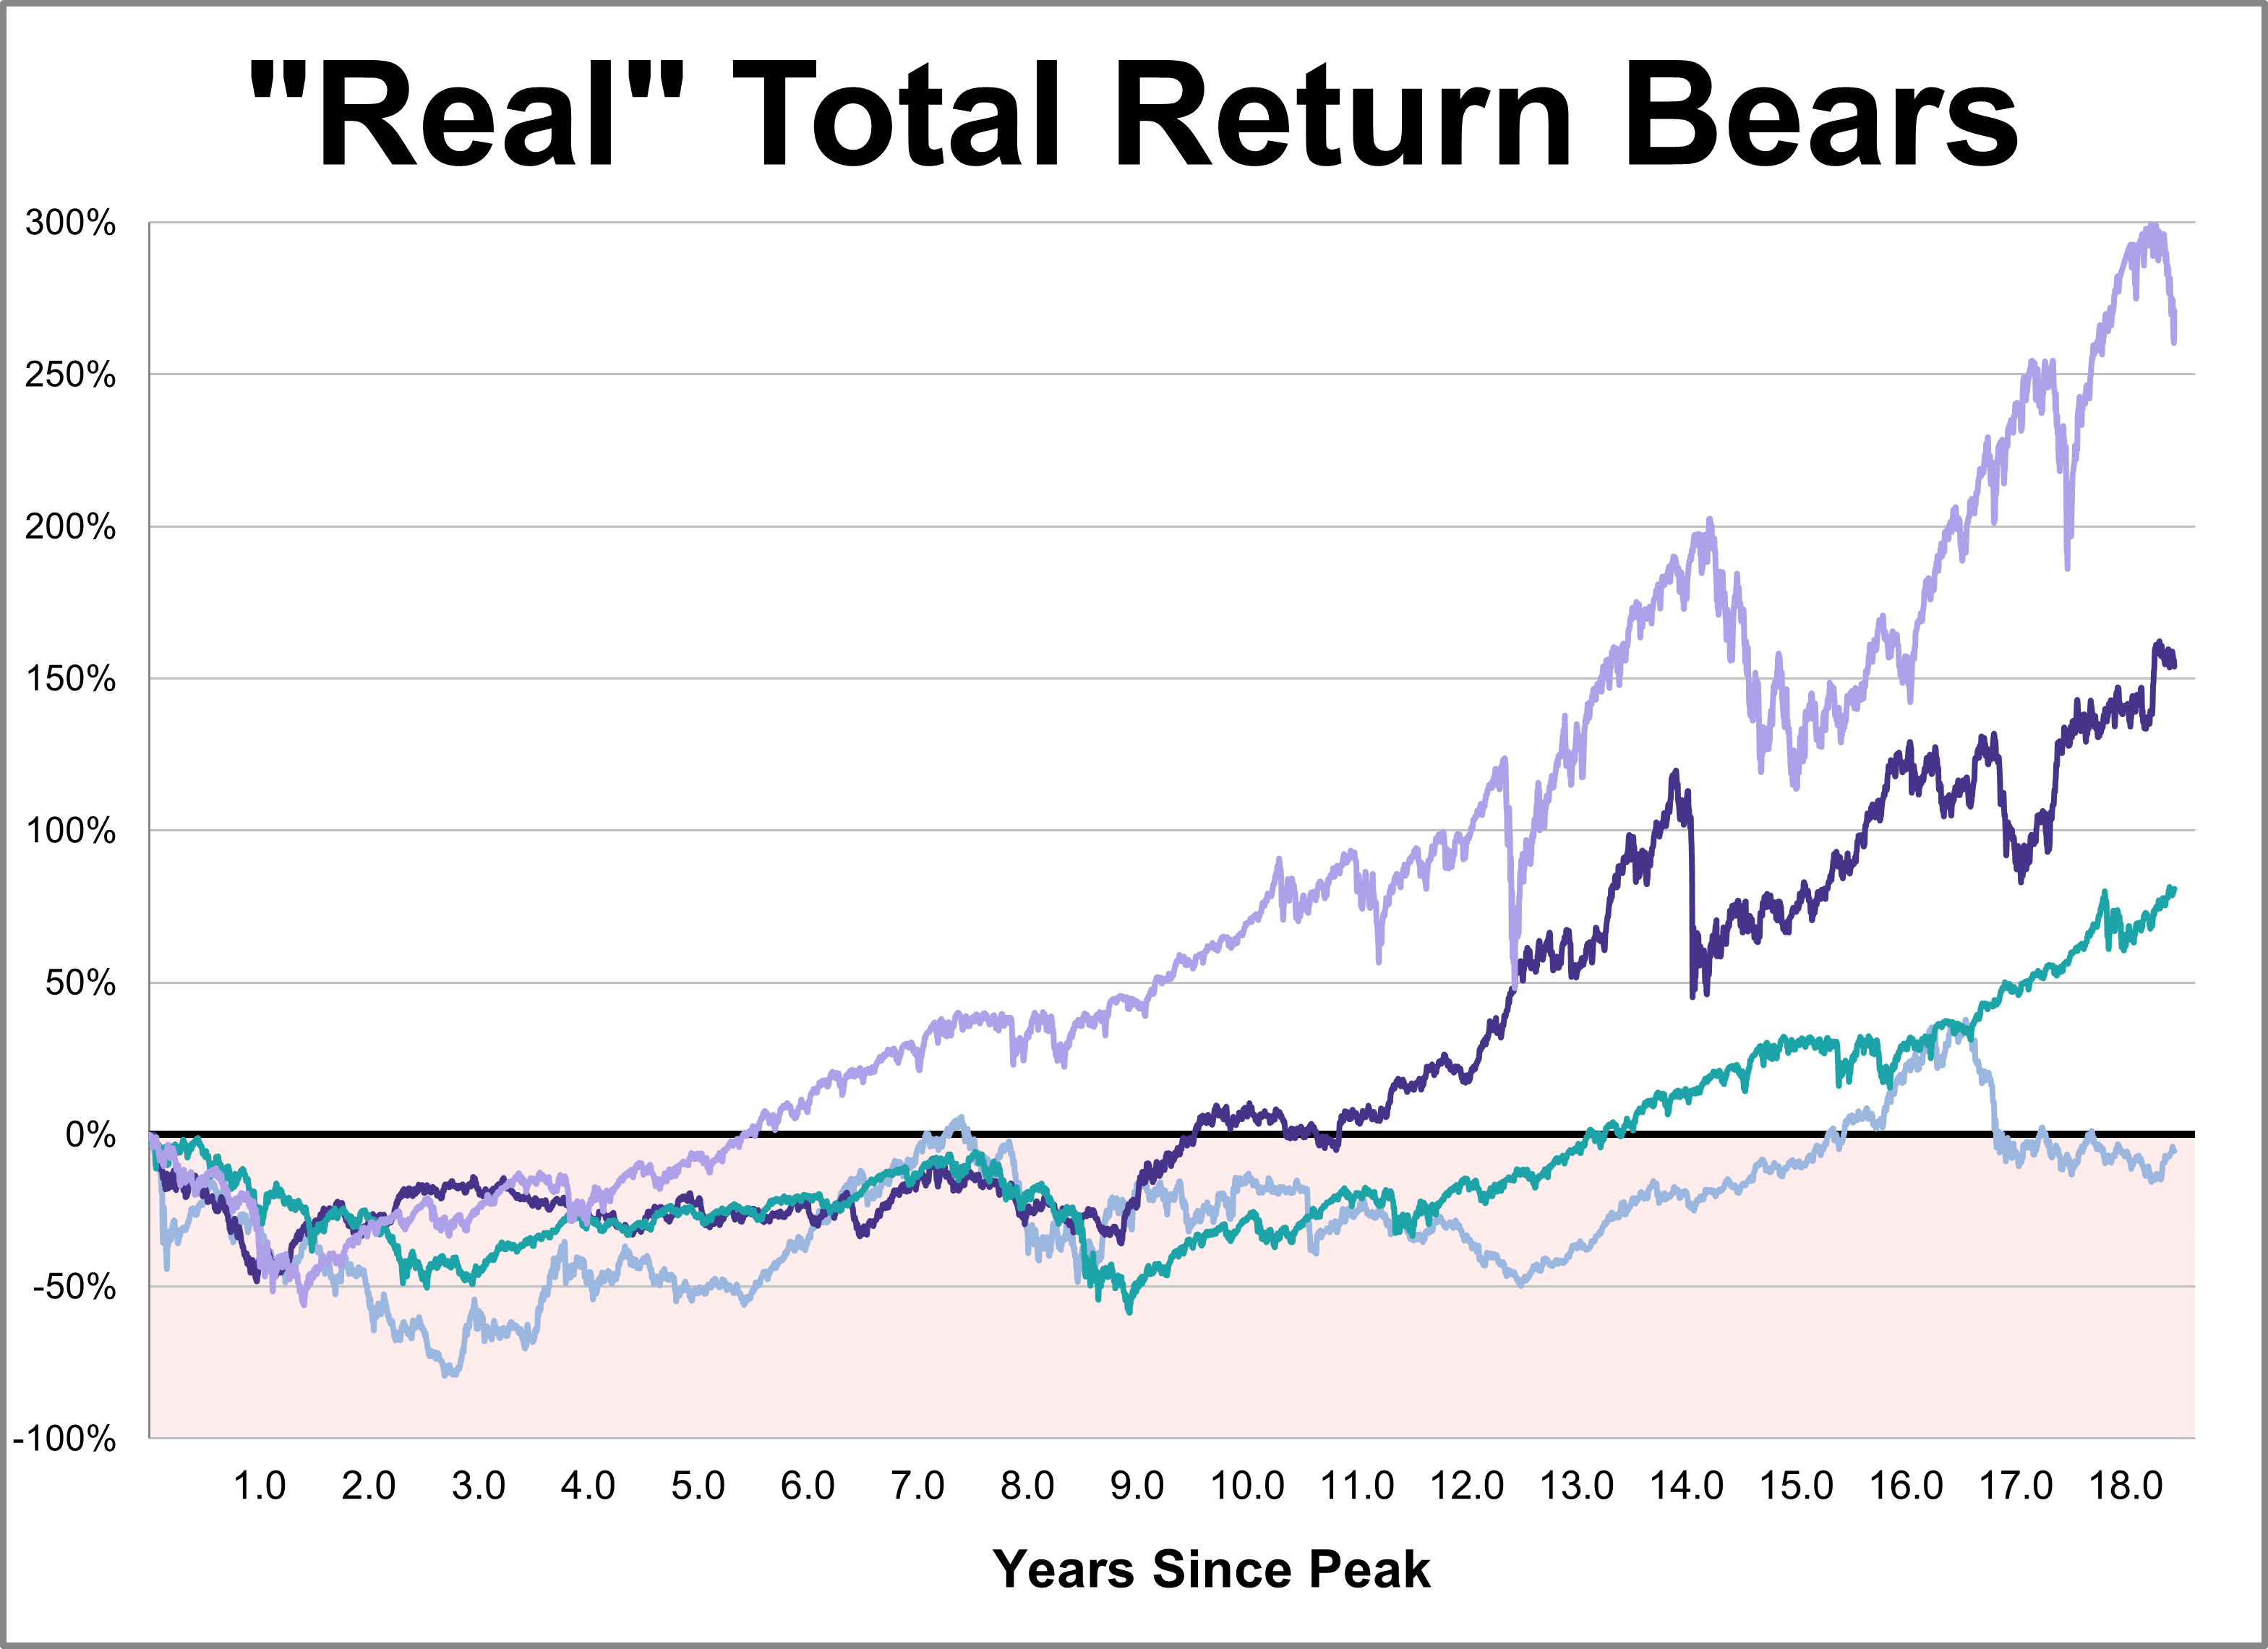
While every market downturn is unique, history offers a crucial lens for understanding recovery. This chart series provides a comprehensive overlay of the Four Bad Bears in U.S. history since the 1929 peak, comparing their recovery paths through the S&P 500's close on March 31, 2026.
Heavily influenced by escalating geopolitical conflicts, last week's economic snapshot reveals a sharp erosion of confidence among consumers and investors alike.
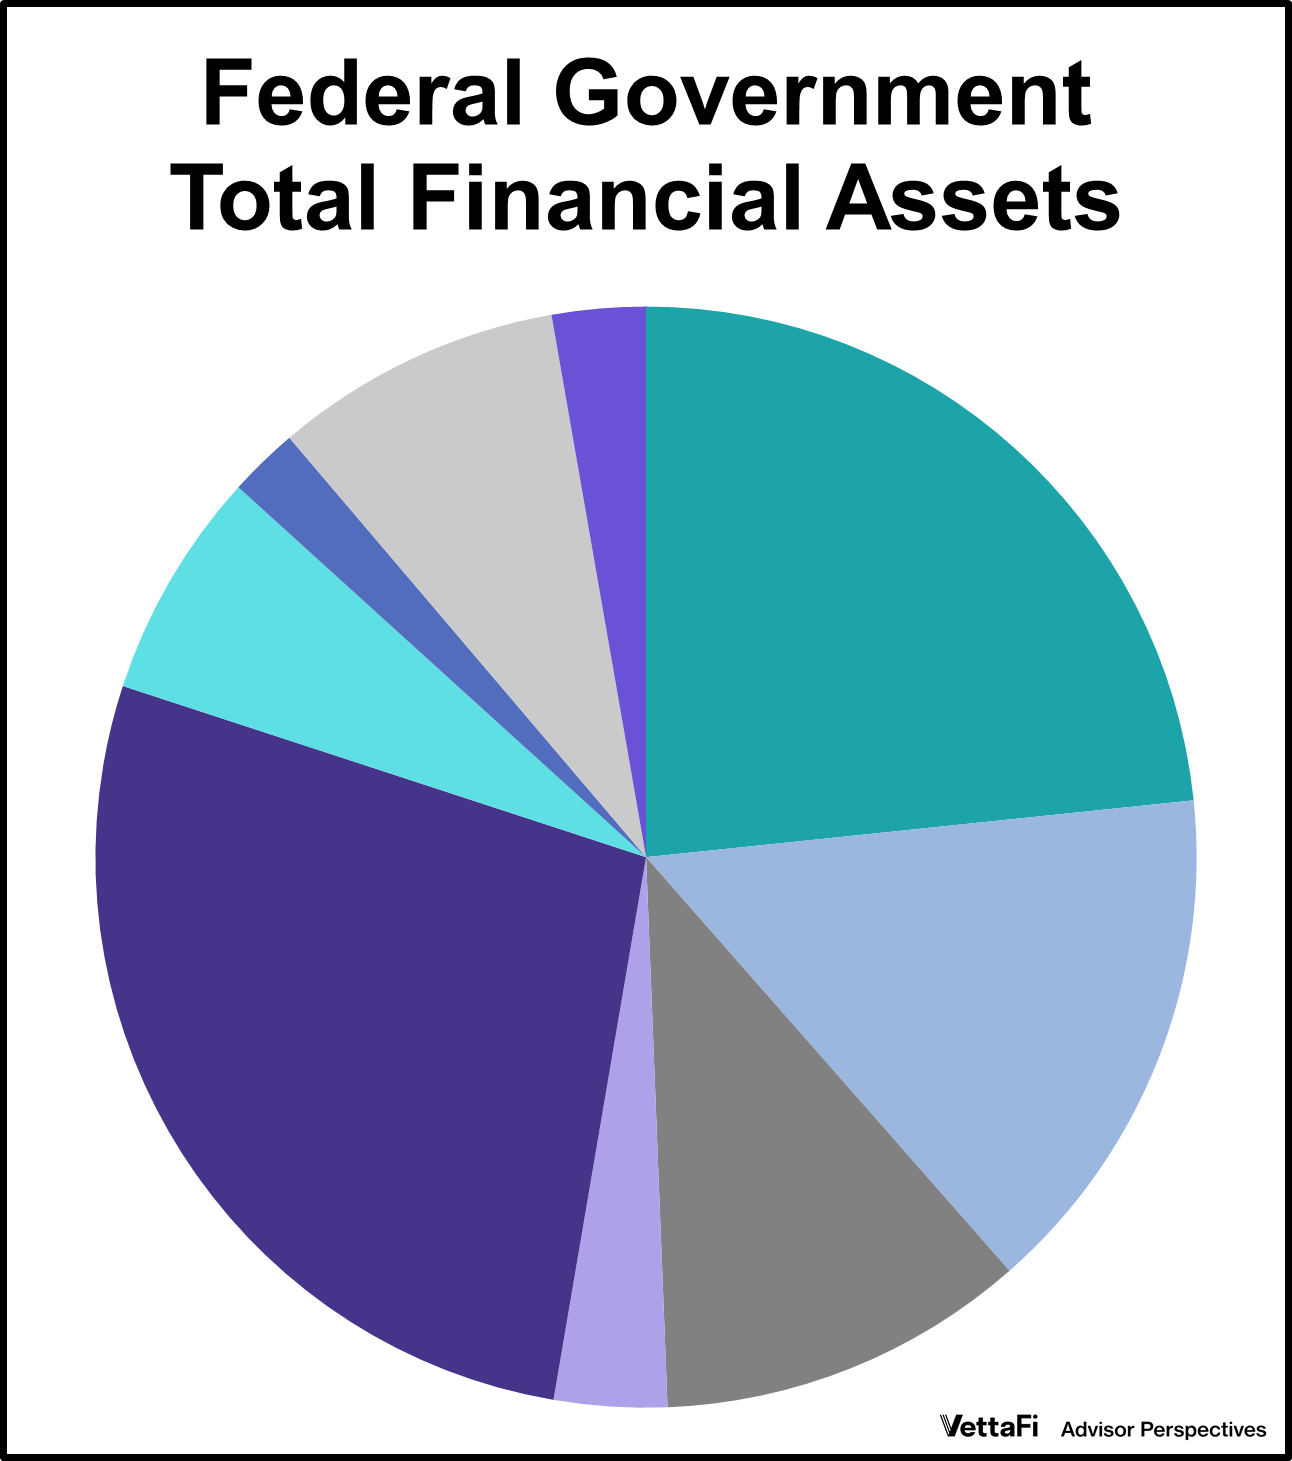
When we think of the U.S. government's finances, we often focus on the massive debt. But what about the assets? What does Uncle Sam actually own, and which asset is the largest?
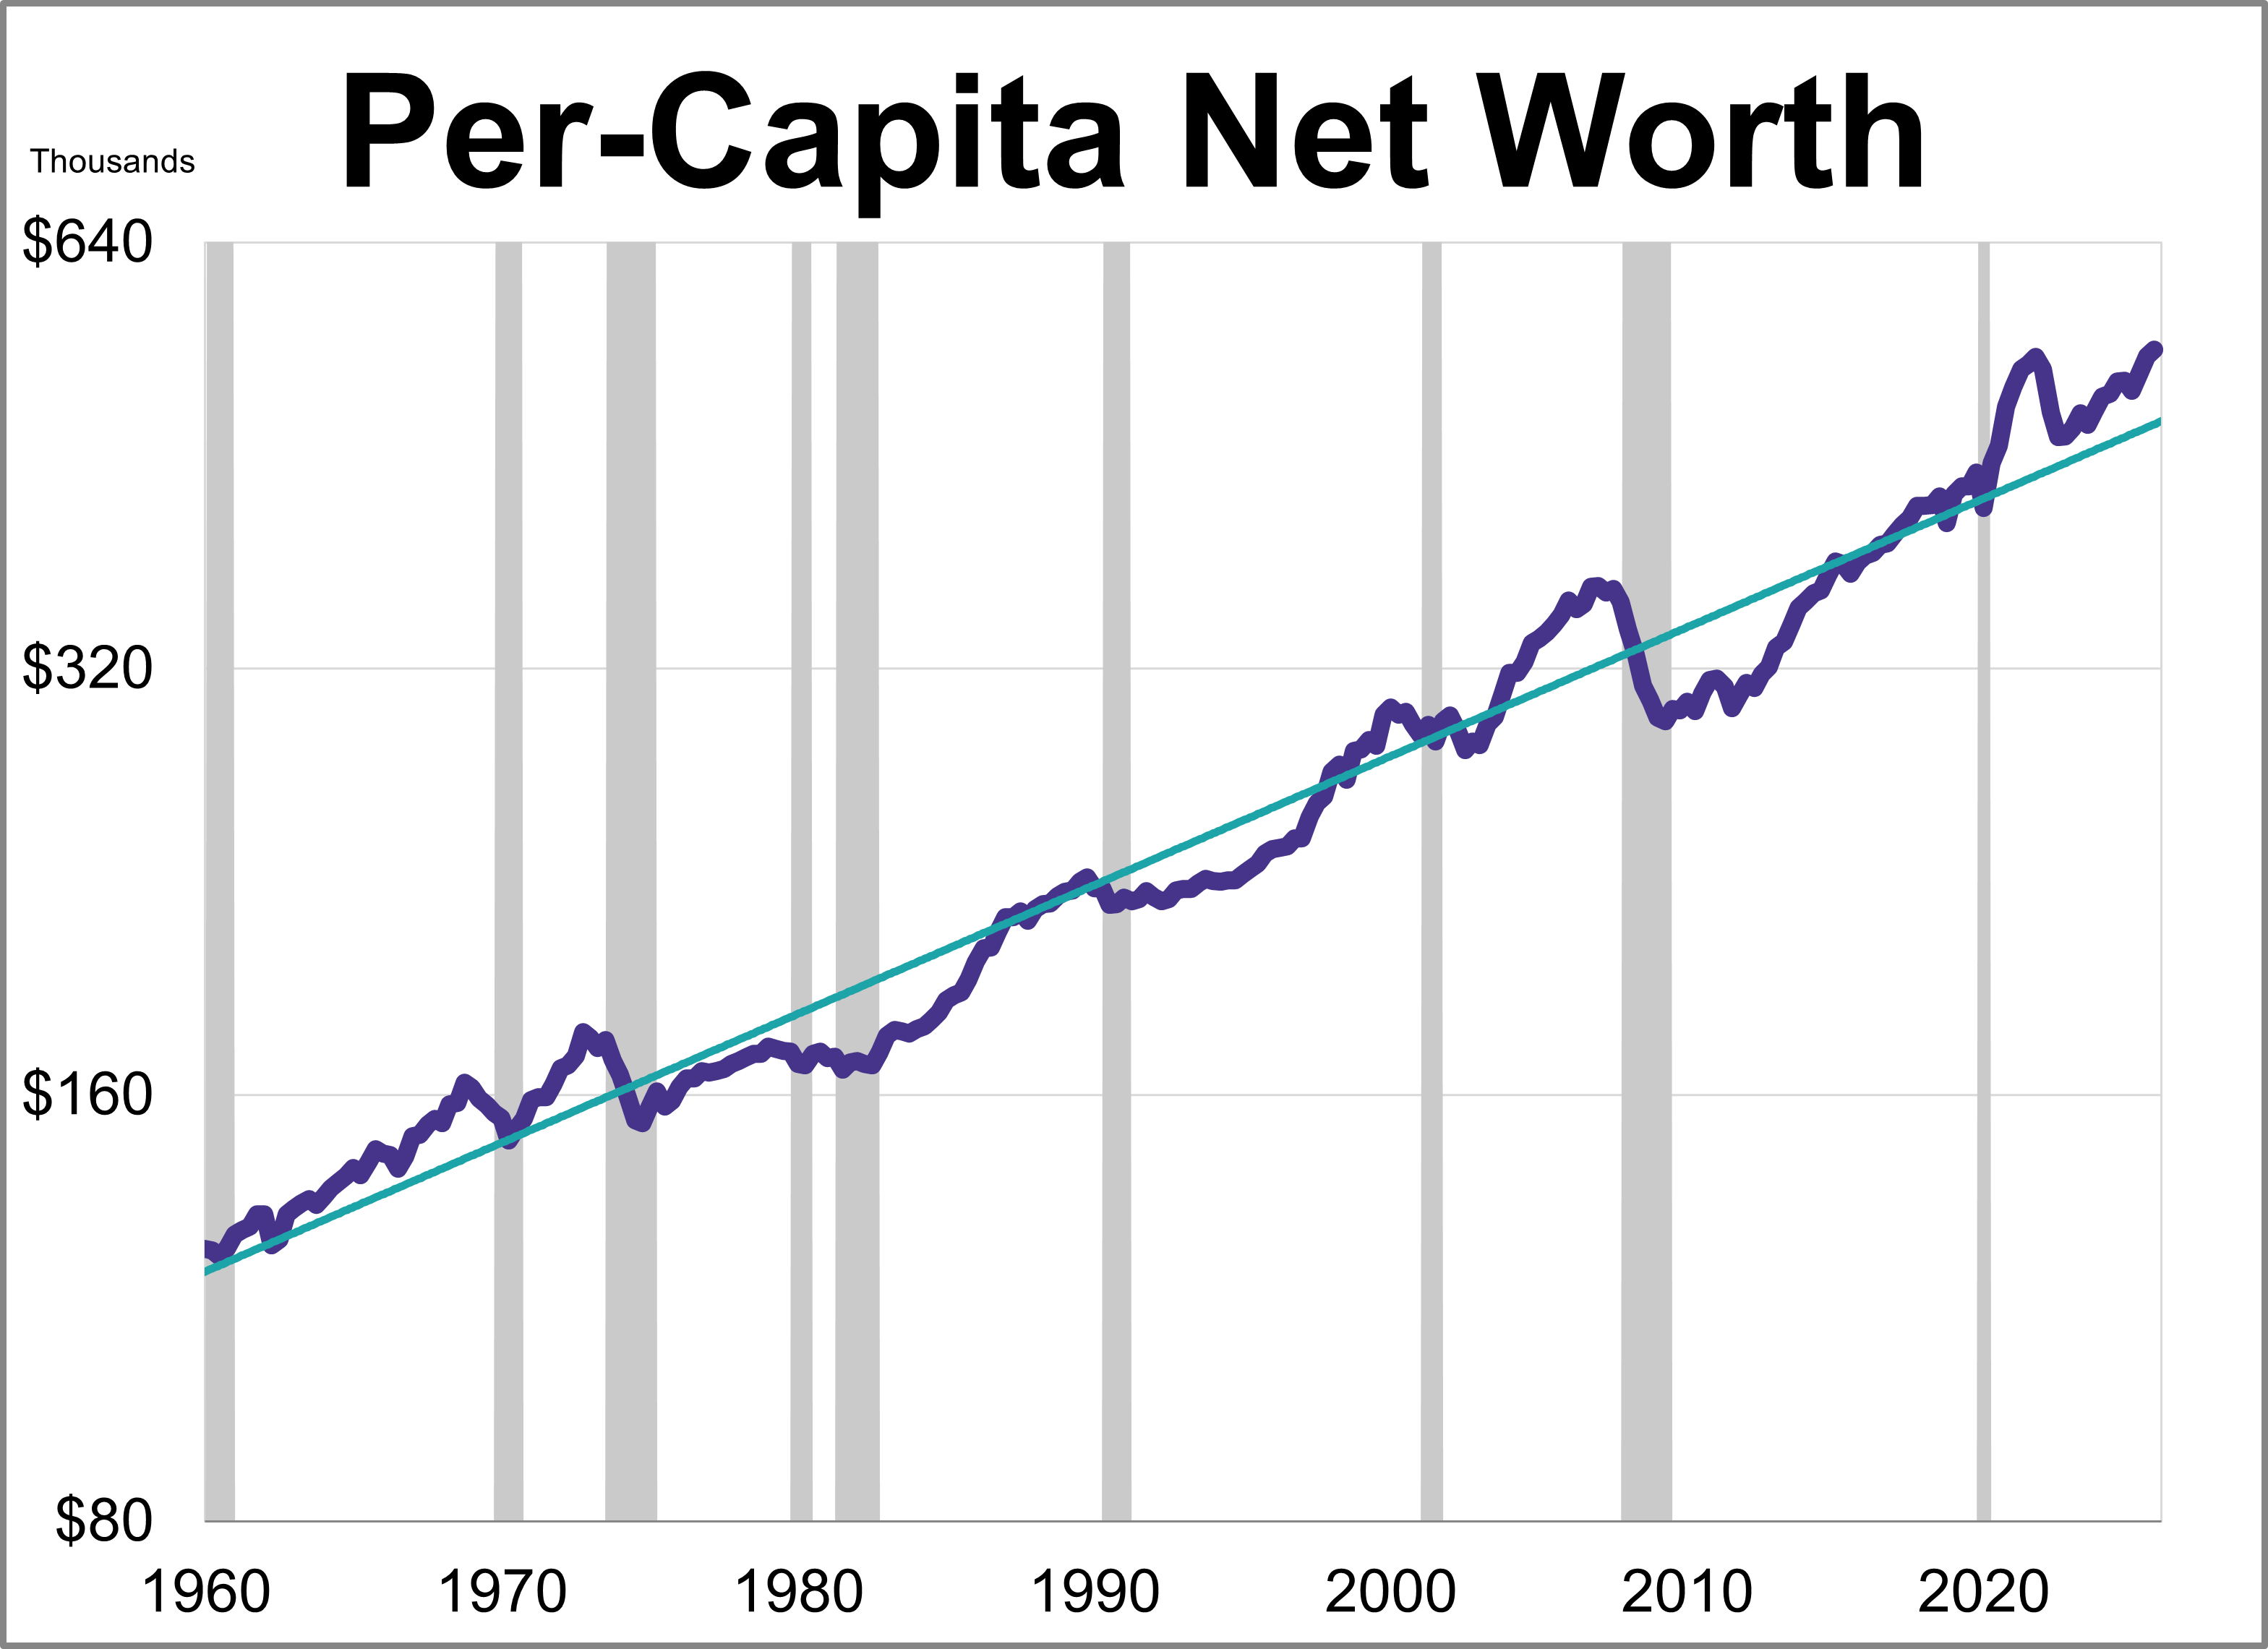
How much wealthier are Americans since the Great Recession? While a look at the headlines shows a staggering 211% increase in household net worth since 2009, adjusting for inflation tells a much different story.
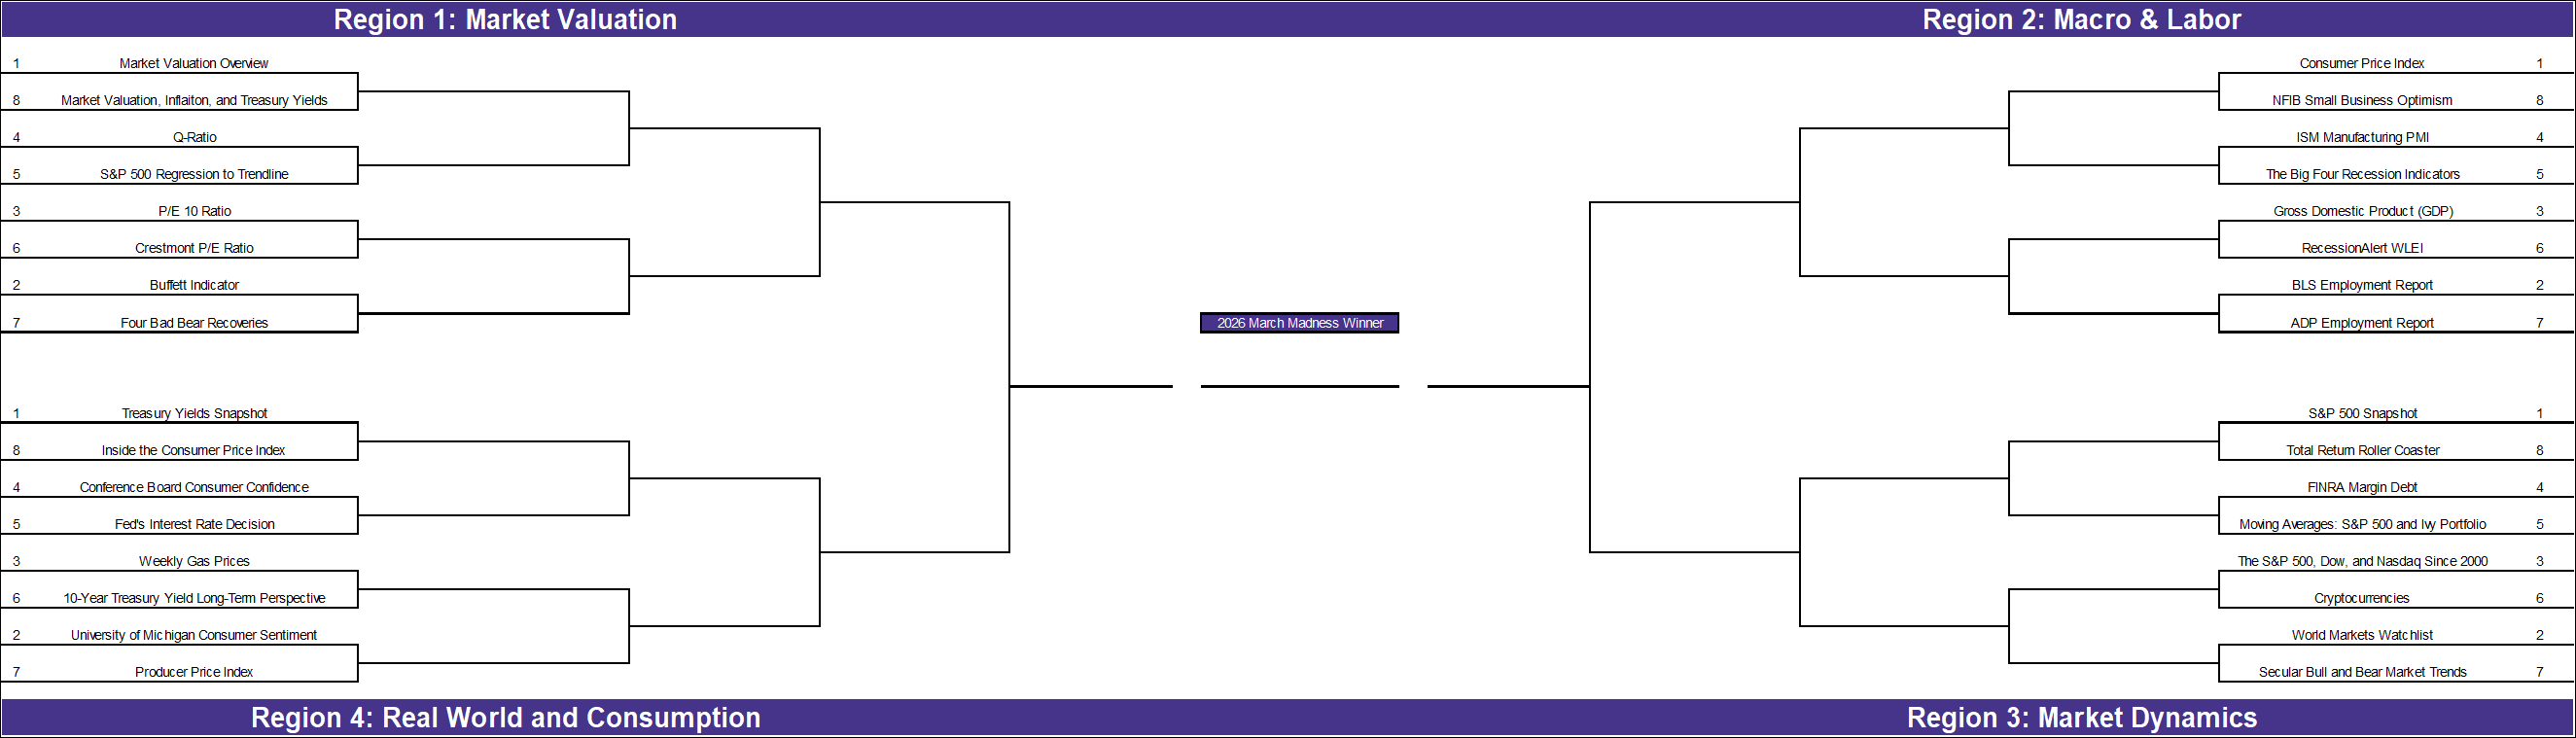
With the NCAA tournament beginning in just a few days, we’ve applied the bracket format to our own research. While economic theory often dictates what should be most important to investors, our reader engagement reveals which topics truly commanded investor attention over the past year.