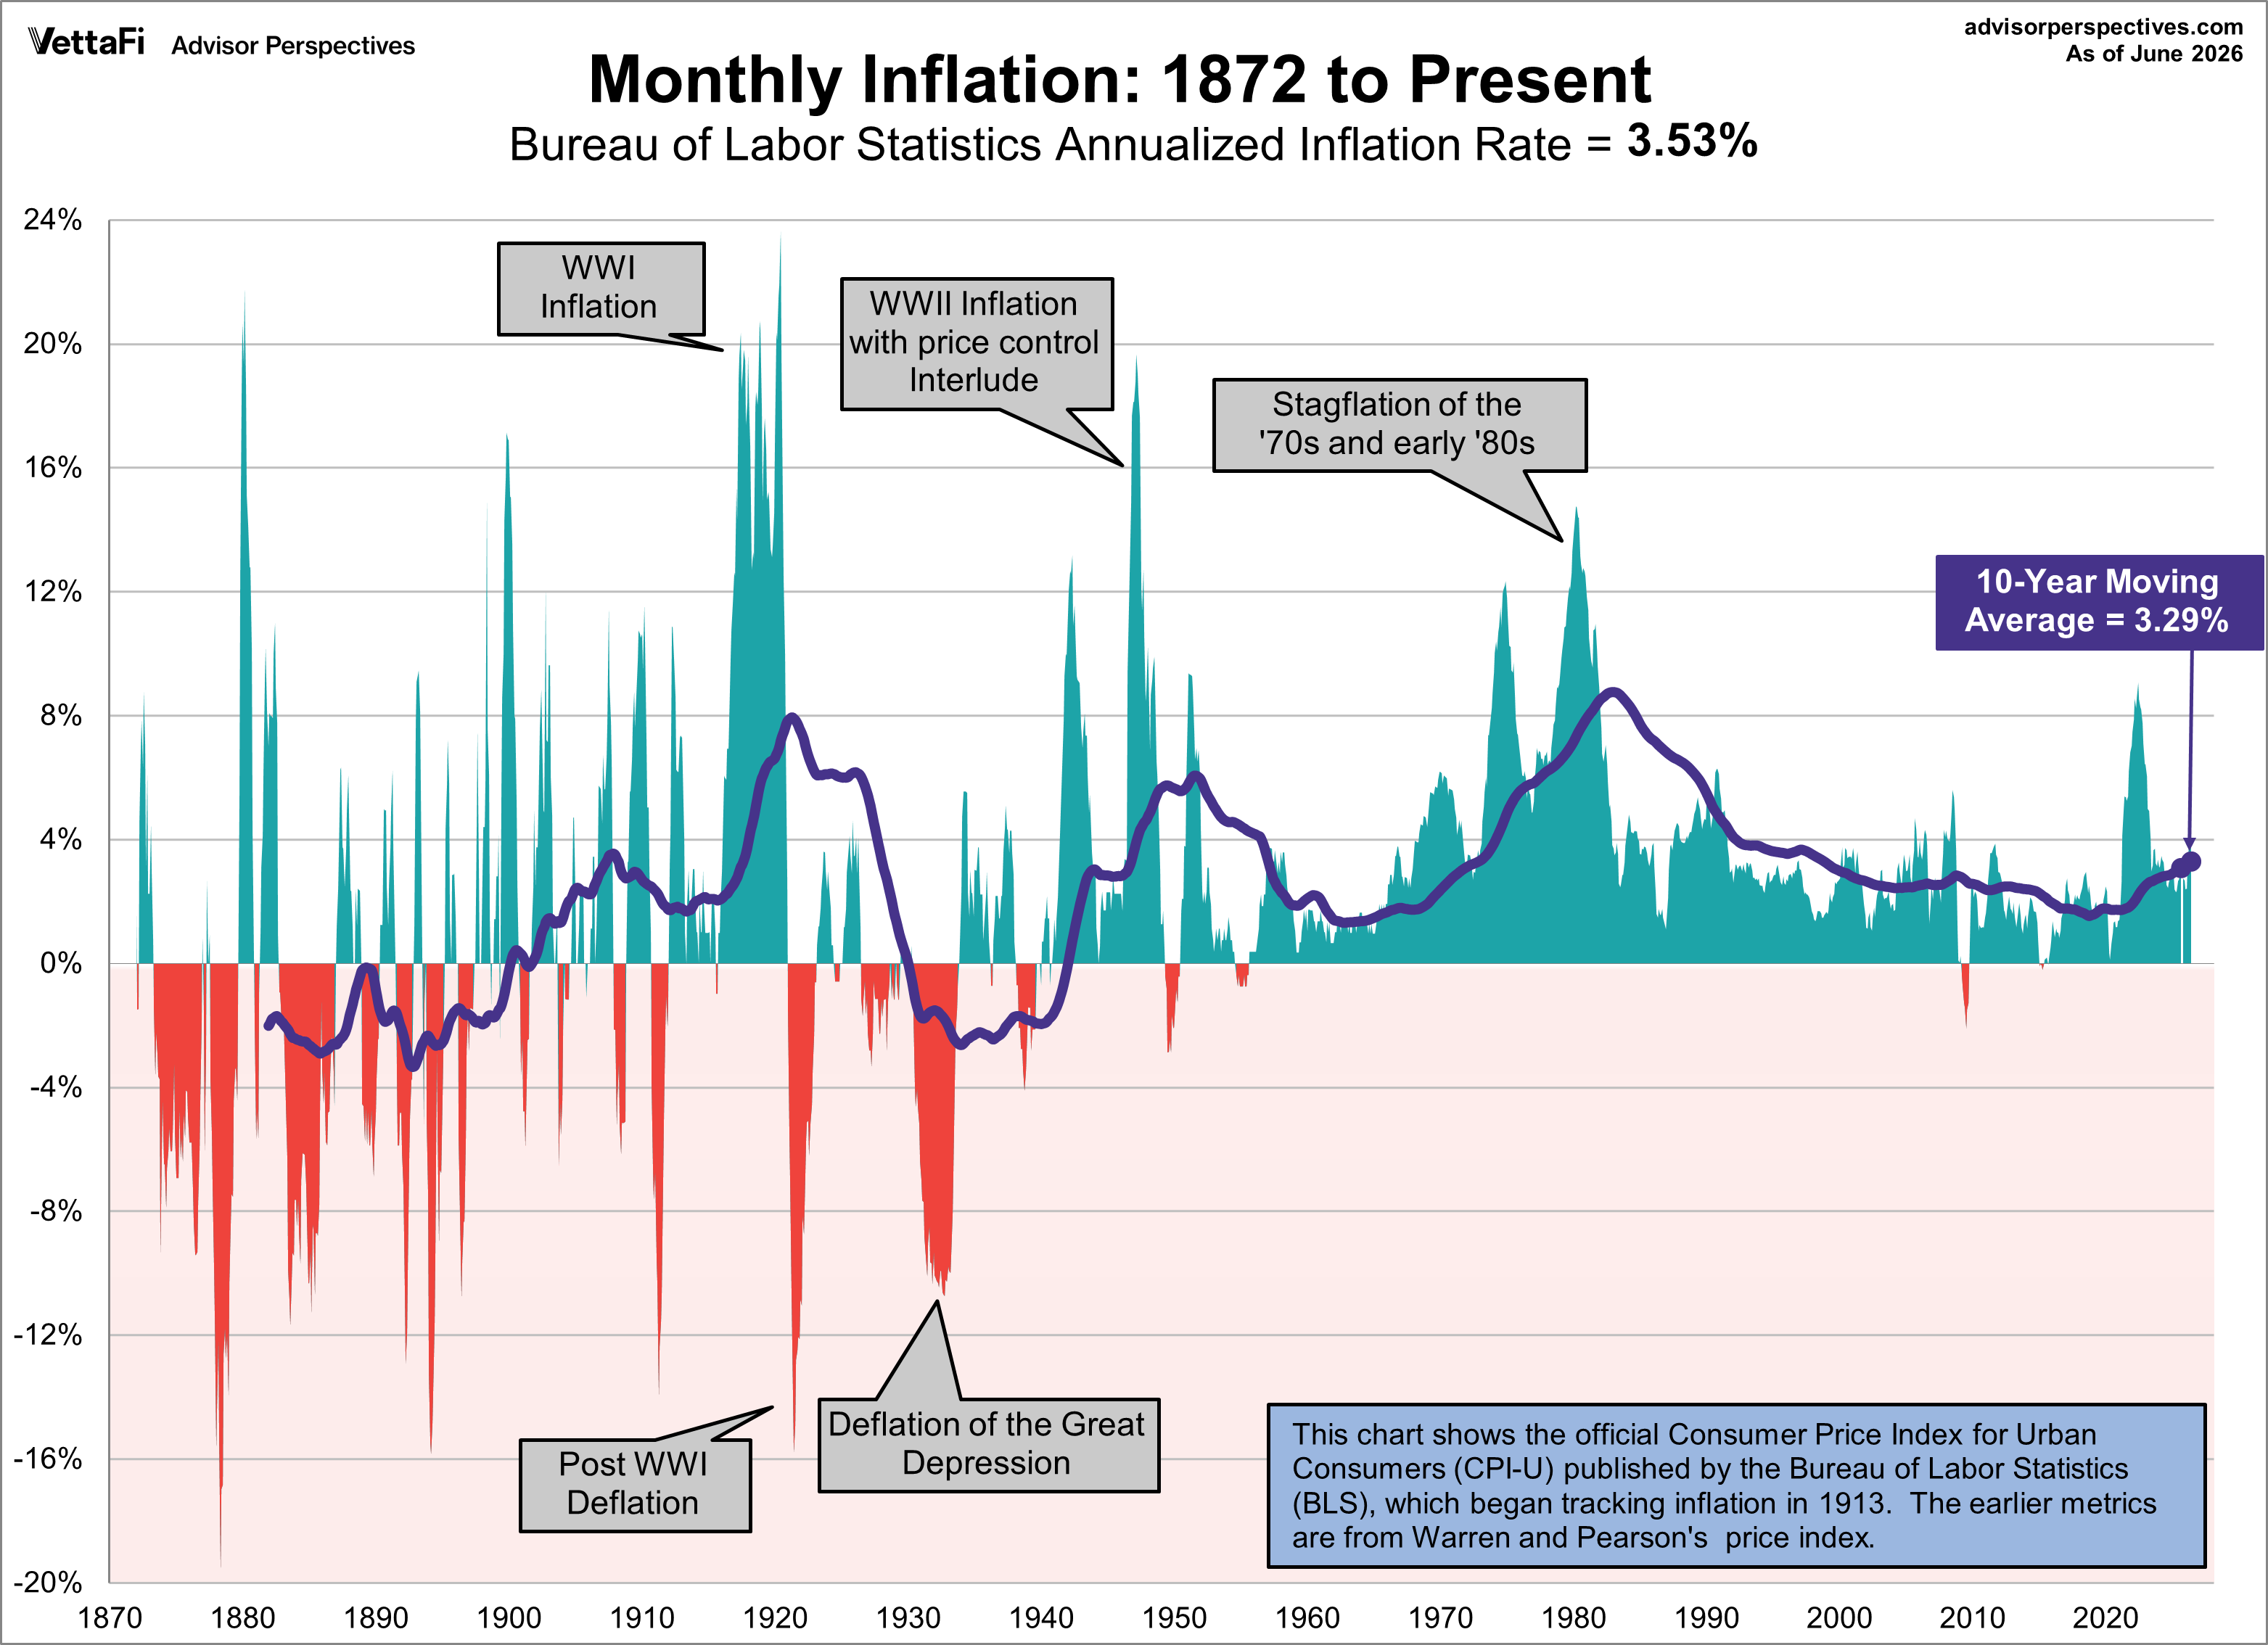
The June release of the Consumer Price Index for Urban Consumers (CPI-U) places the year-over-year inflation rate at 3.53%. This pushes inflation back below the post-WWII average of 3.72% for the first time since March. Meanwhile, this marks the fourth consecutive month that the current rate is above the 10-year moving average, which currently sits at 3.29%.
- For a comparison of headline inflation with core inflation, which is based on the CPI excluding food and energy, see this monthly update.
- For a better understanding of how CPI is measured and how it impacts your household, see our Inside the Consumer Price Index update.
A Century of Context: 1872 to Present
While the Bureau of Labor Statistics (BLS) official tracking began in 1913, we can extend our view back to 1872 by integrating Warren and Pearson’s price index (sourced via Robert Shiller).
Historical Volatility vs. Modern Stability
Looking at the full 150-year timeline reveals a stark contrast:
- Pre-1930s: The economy experienced extreme "oscillations," characterized by violent swings between high inflation and deep deflation.
- Post-Depression: Following the Great Depression, increased government intervention began to "smooth out" business cycles, leading to fewer economic collapses and more stabilized (though persistent) price growth.
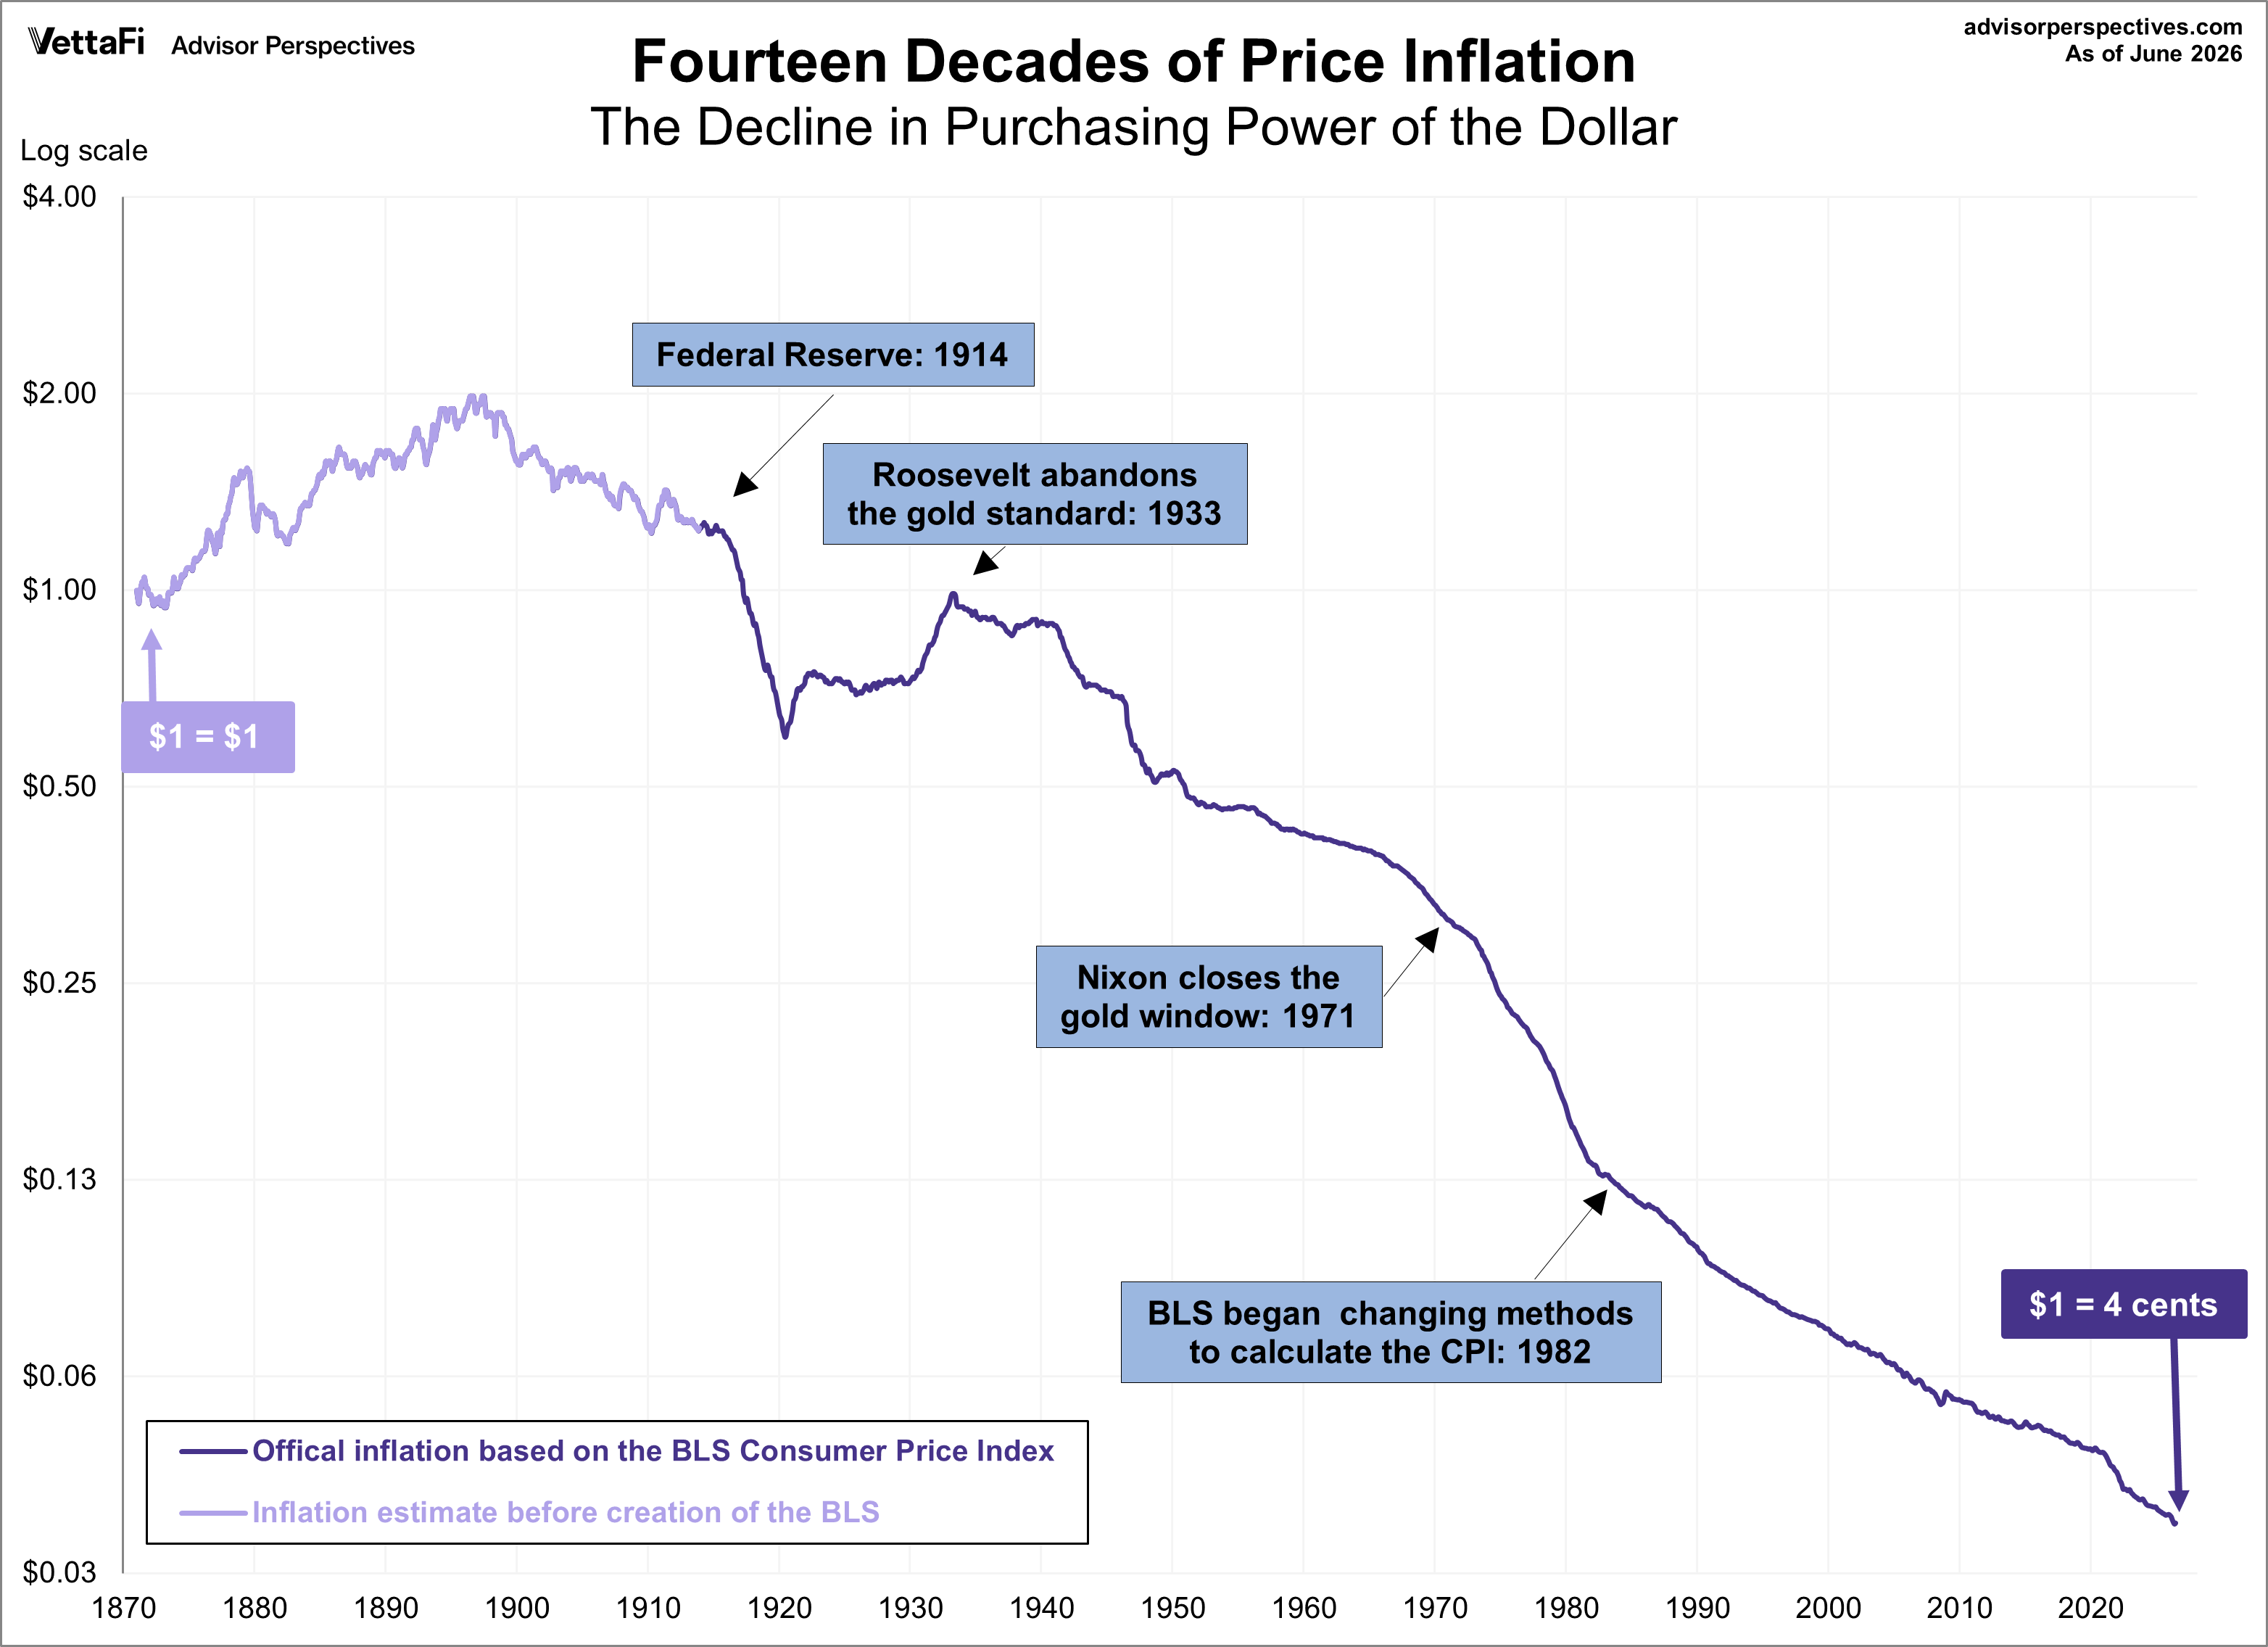
The Declining Power of the Dollar
The long-term cumulative effect of this "smoothed" inflation is best seen through purchasing power. When viewed on a log-scale, the decline is dramatic: $1.00 today has the same buying power as just $0.04 in 1872.