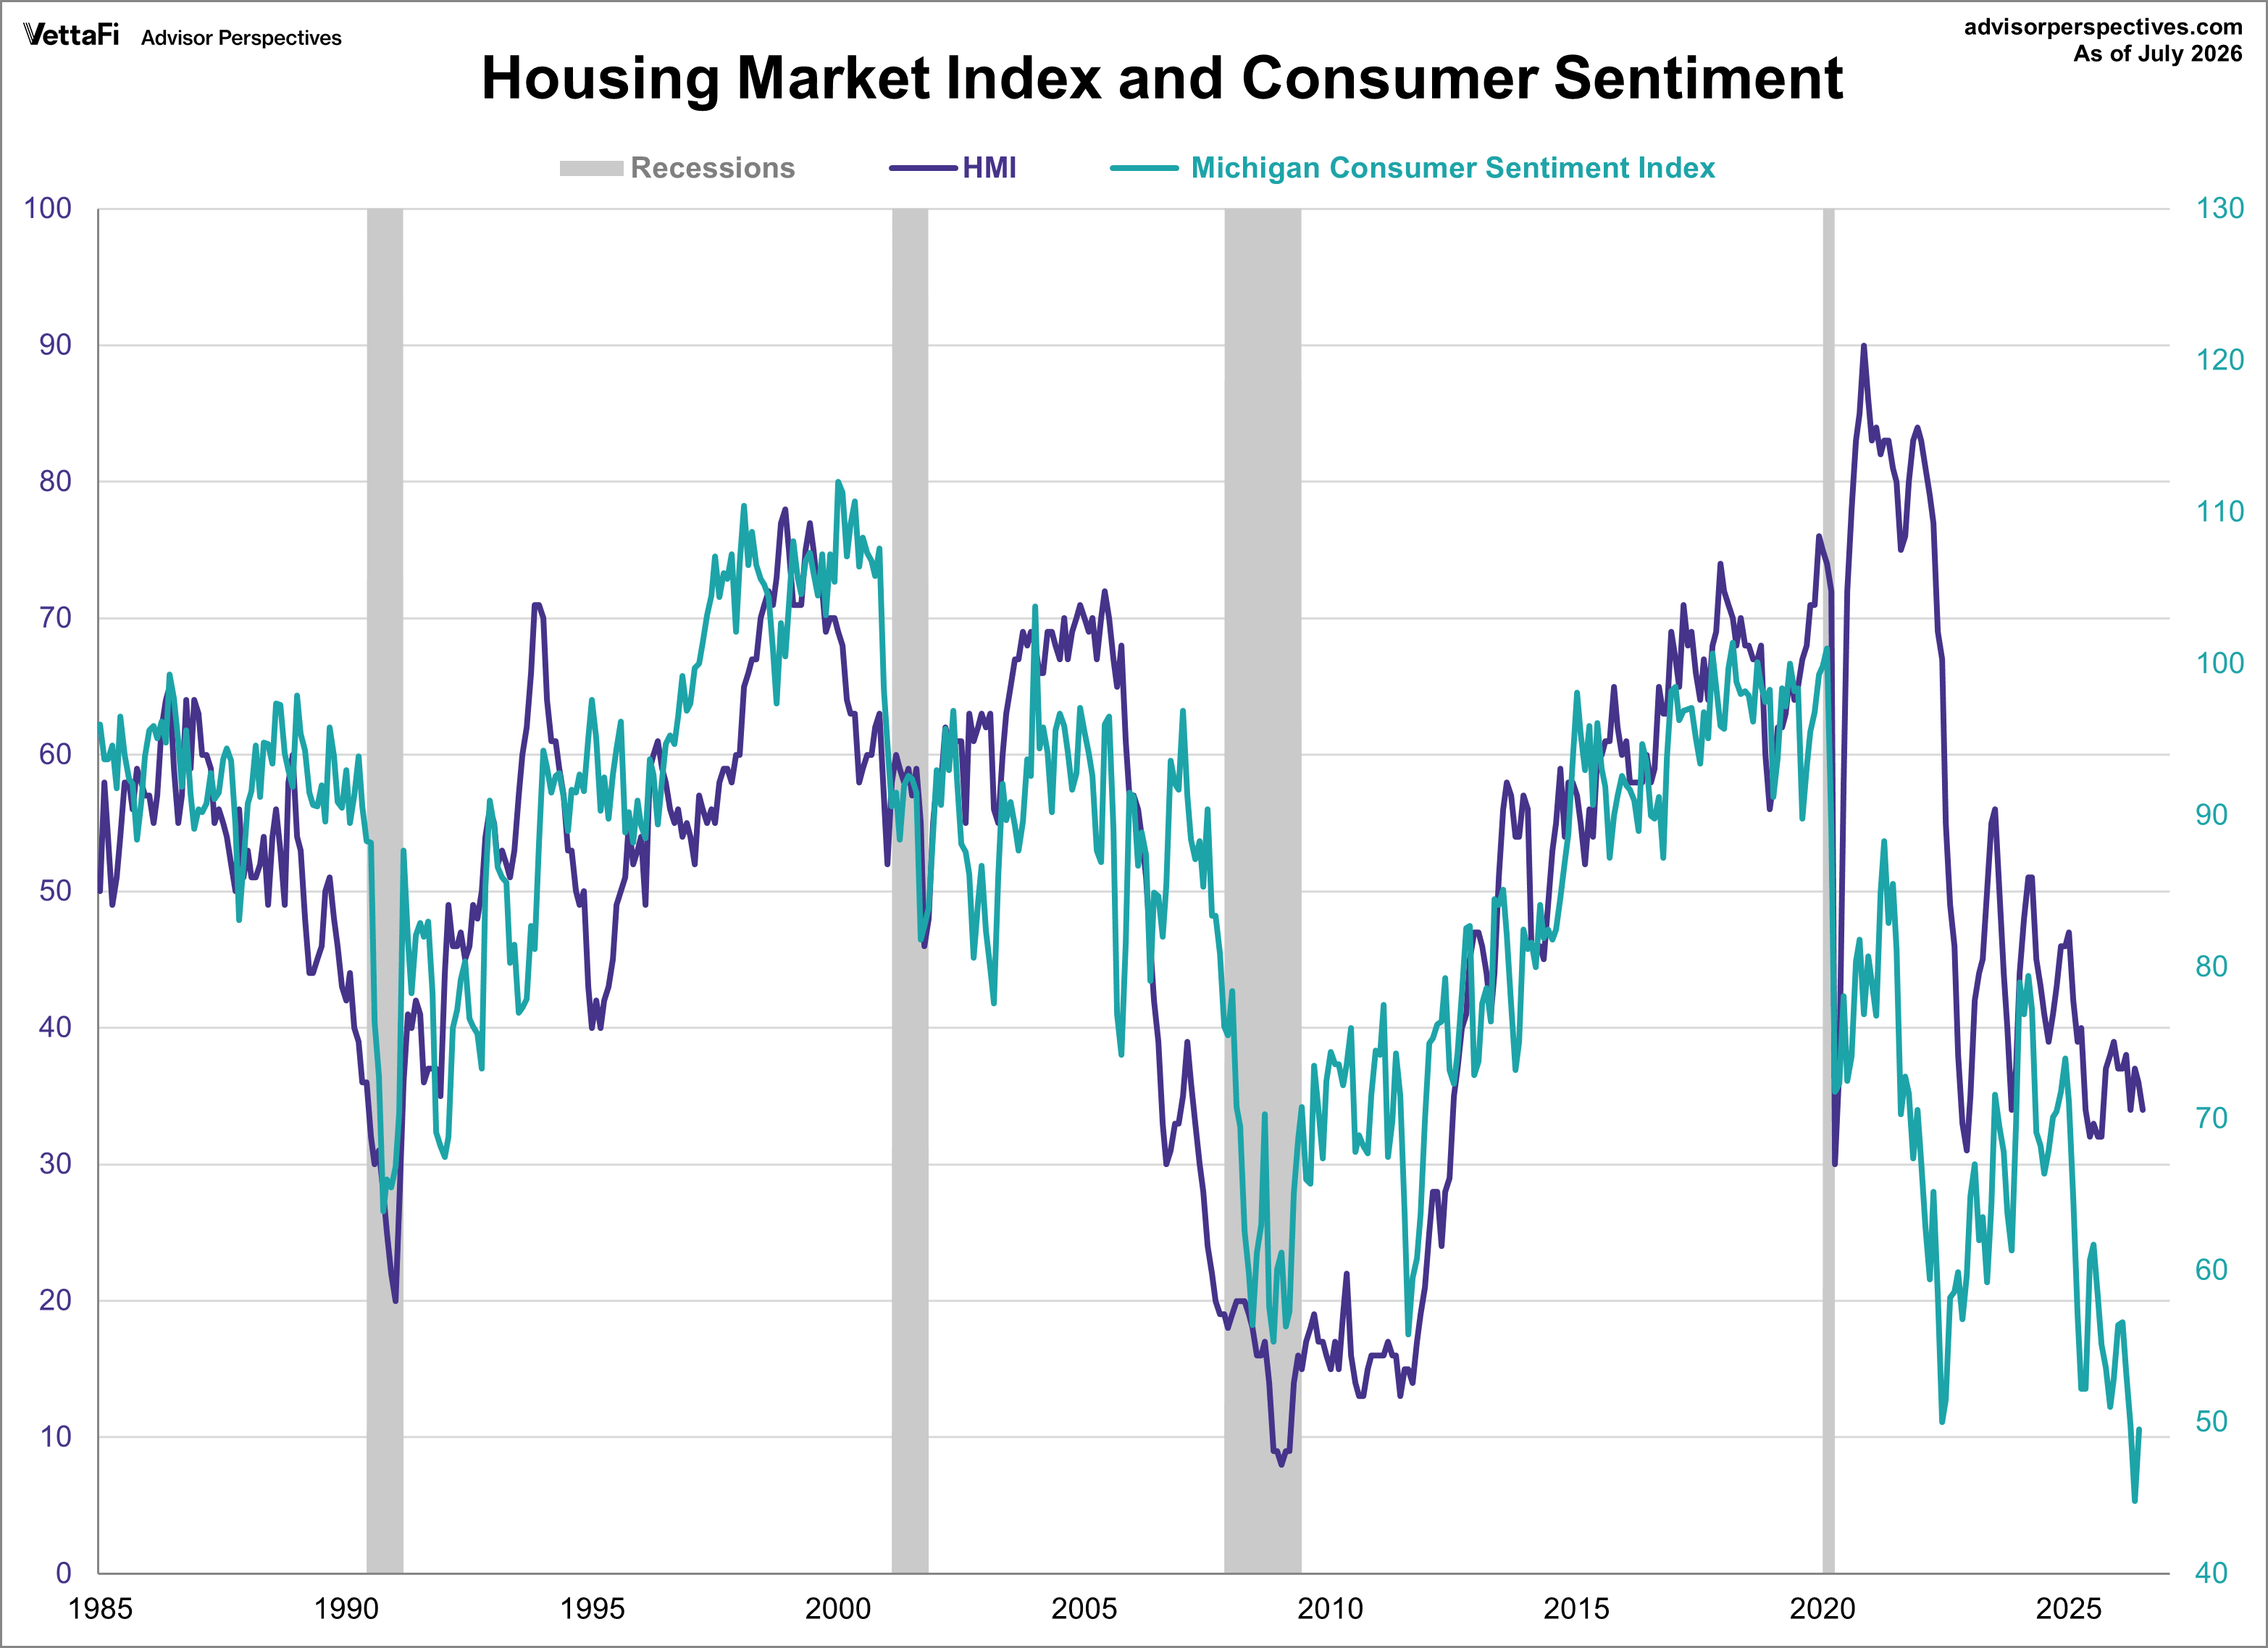
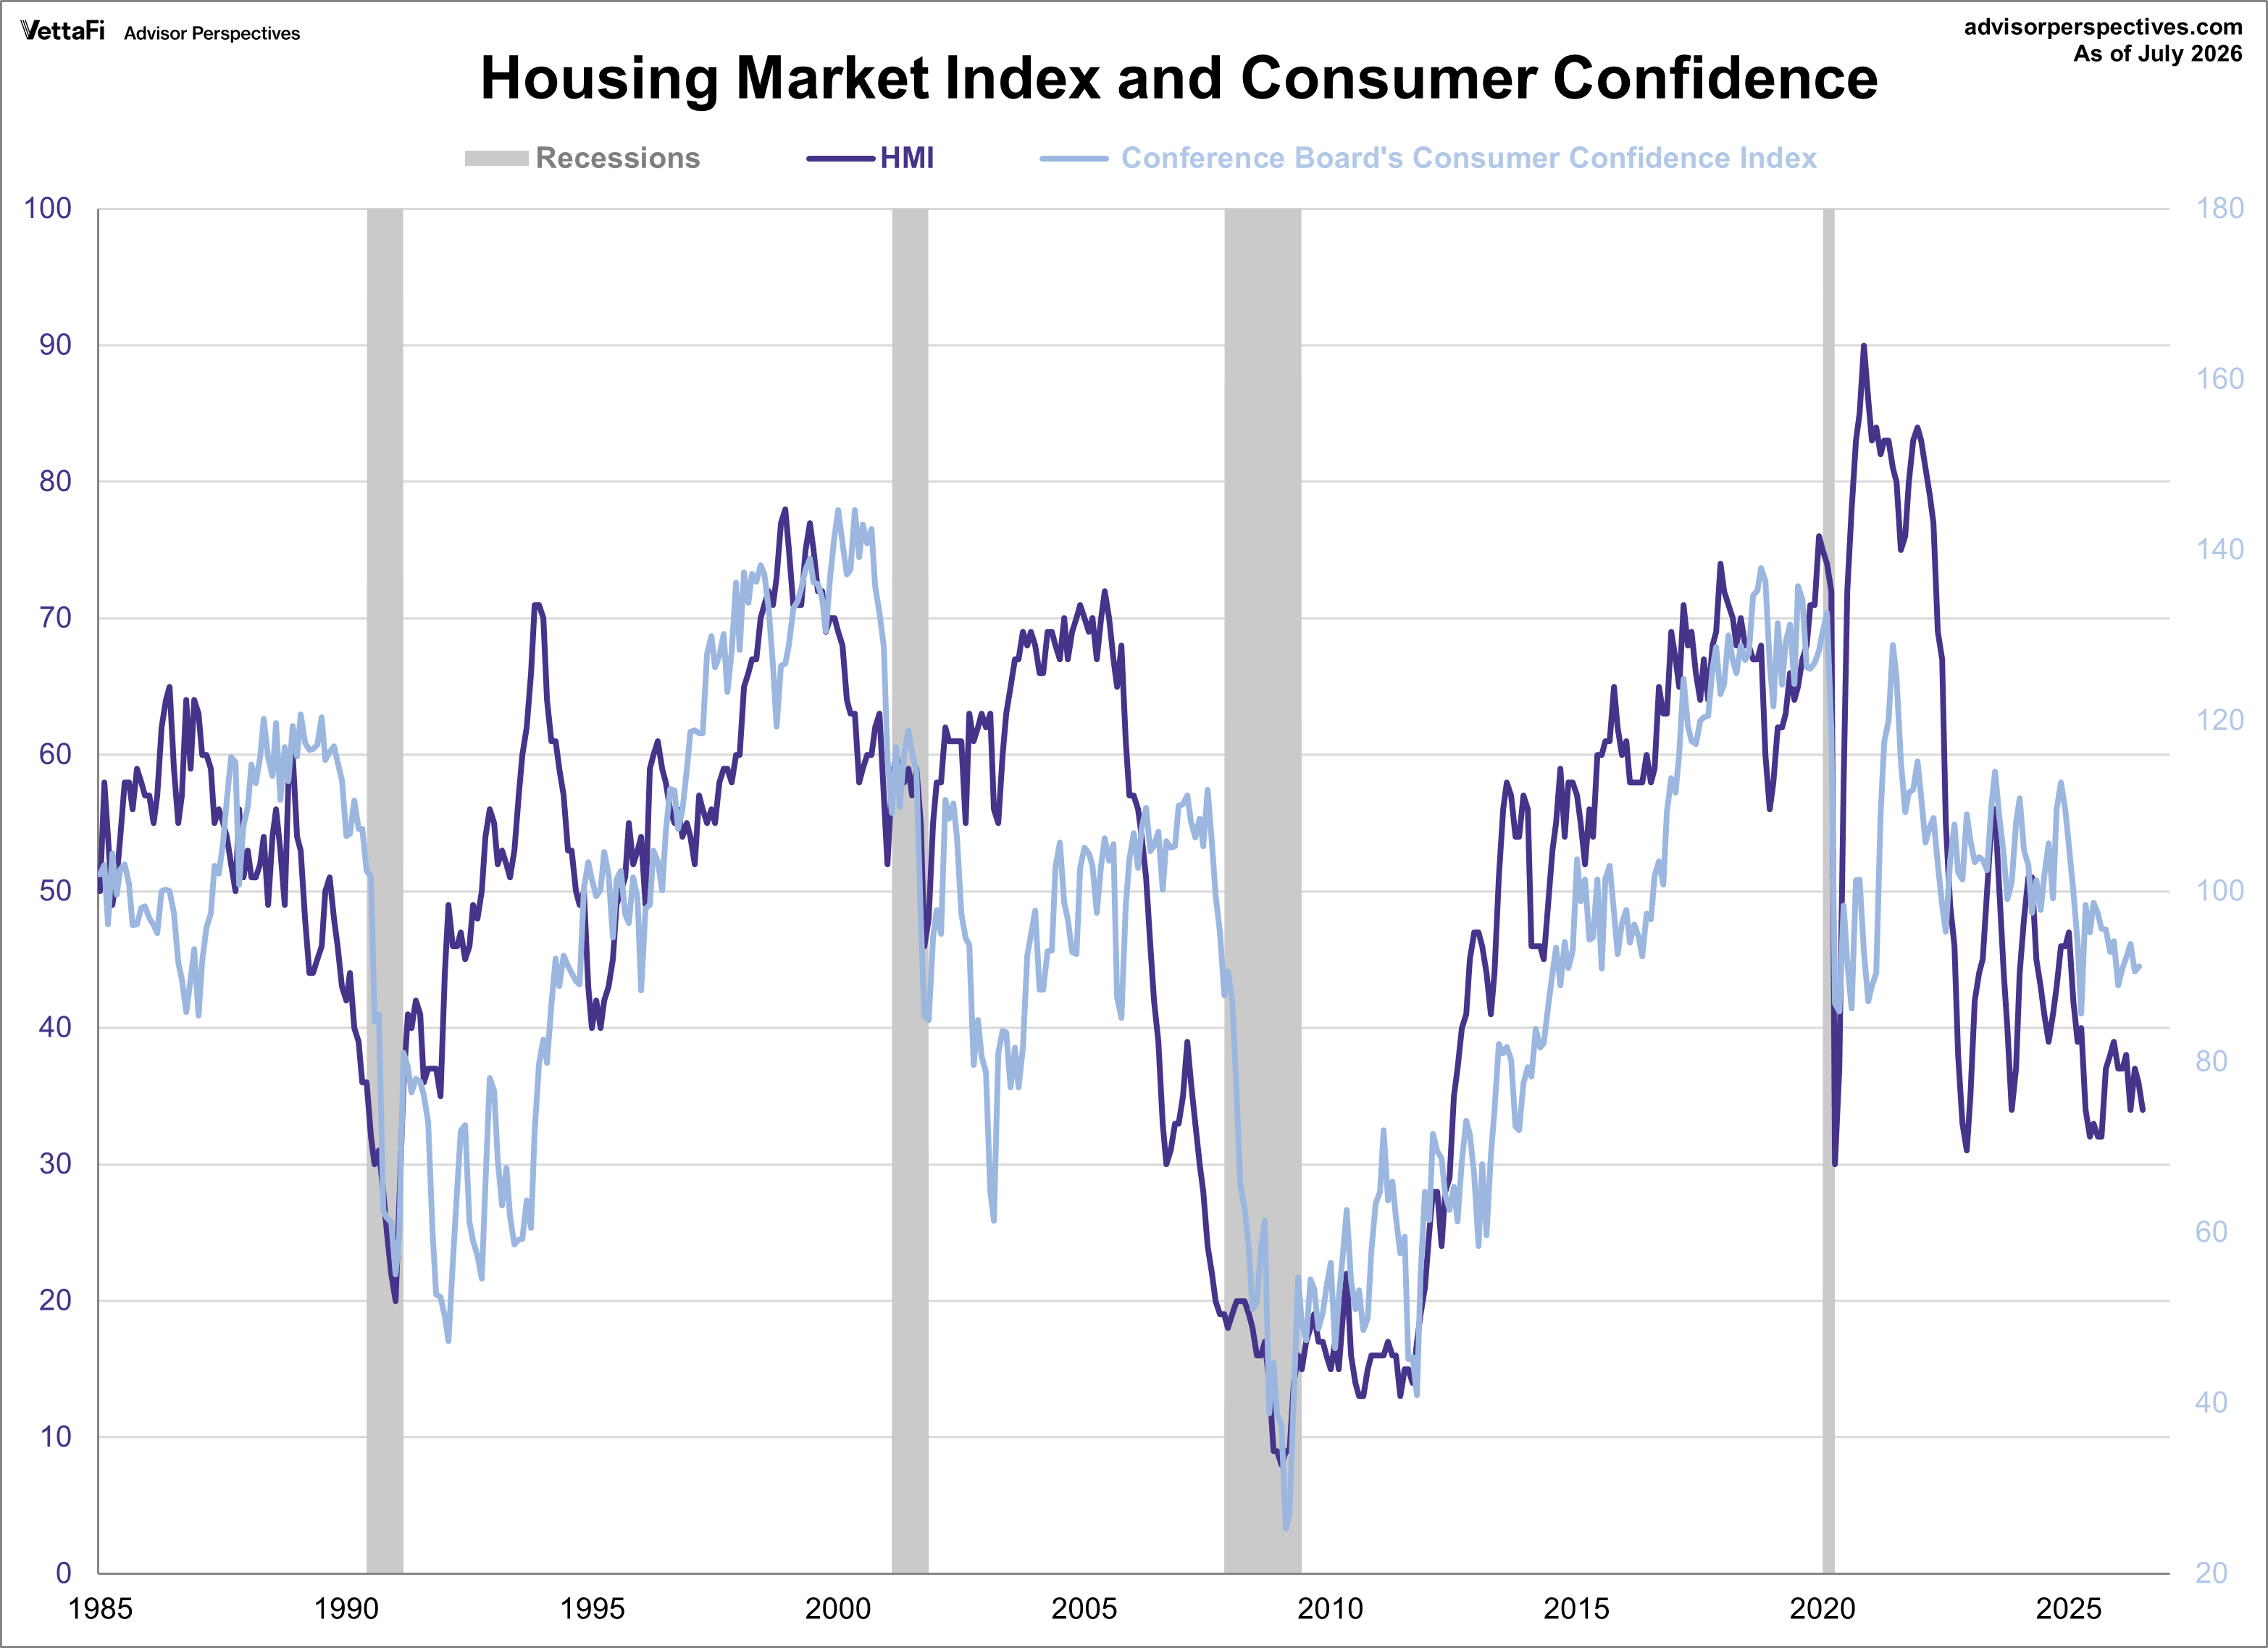
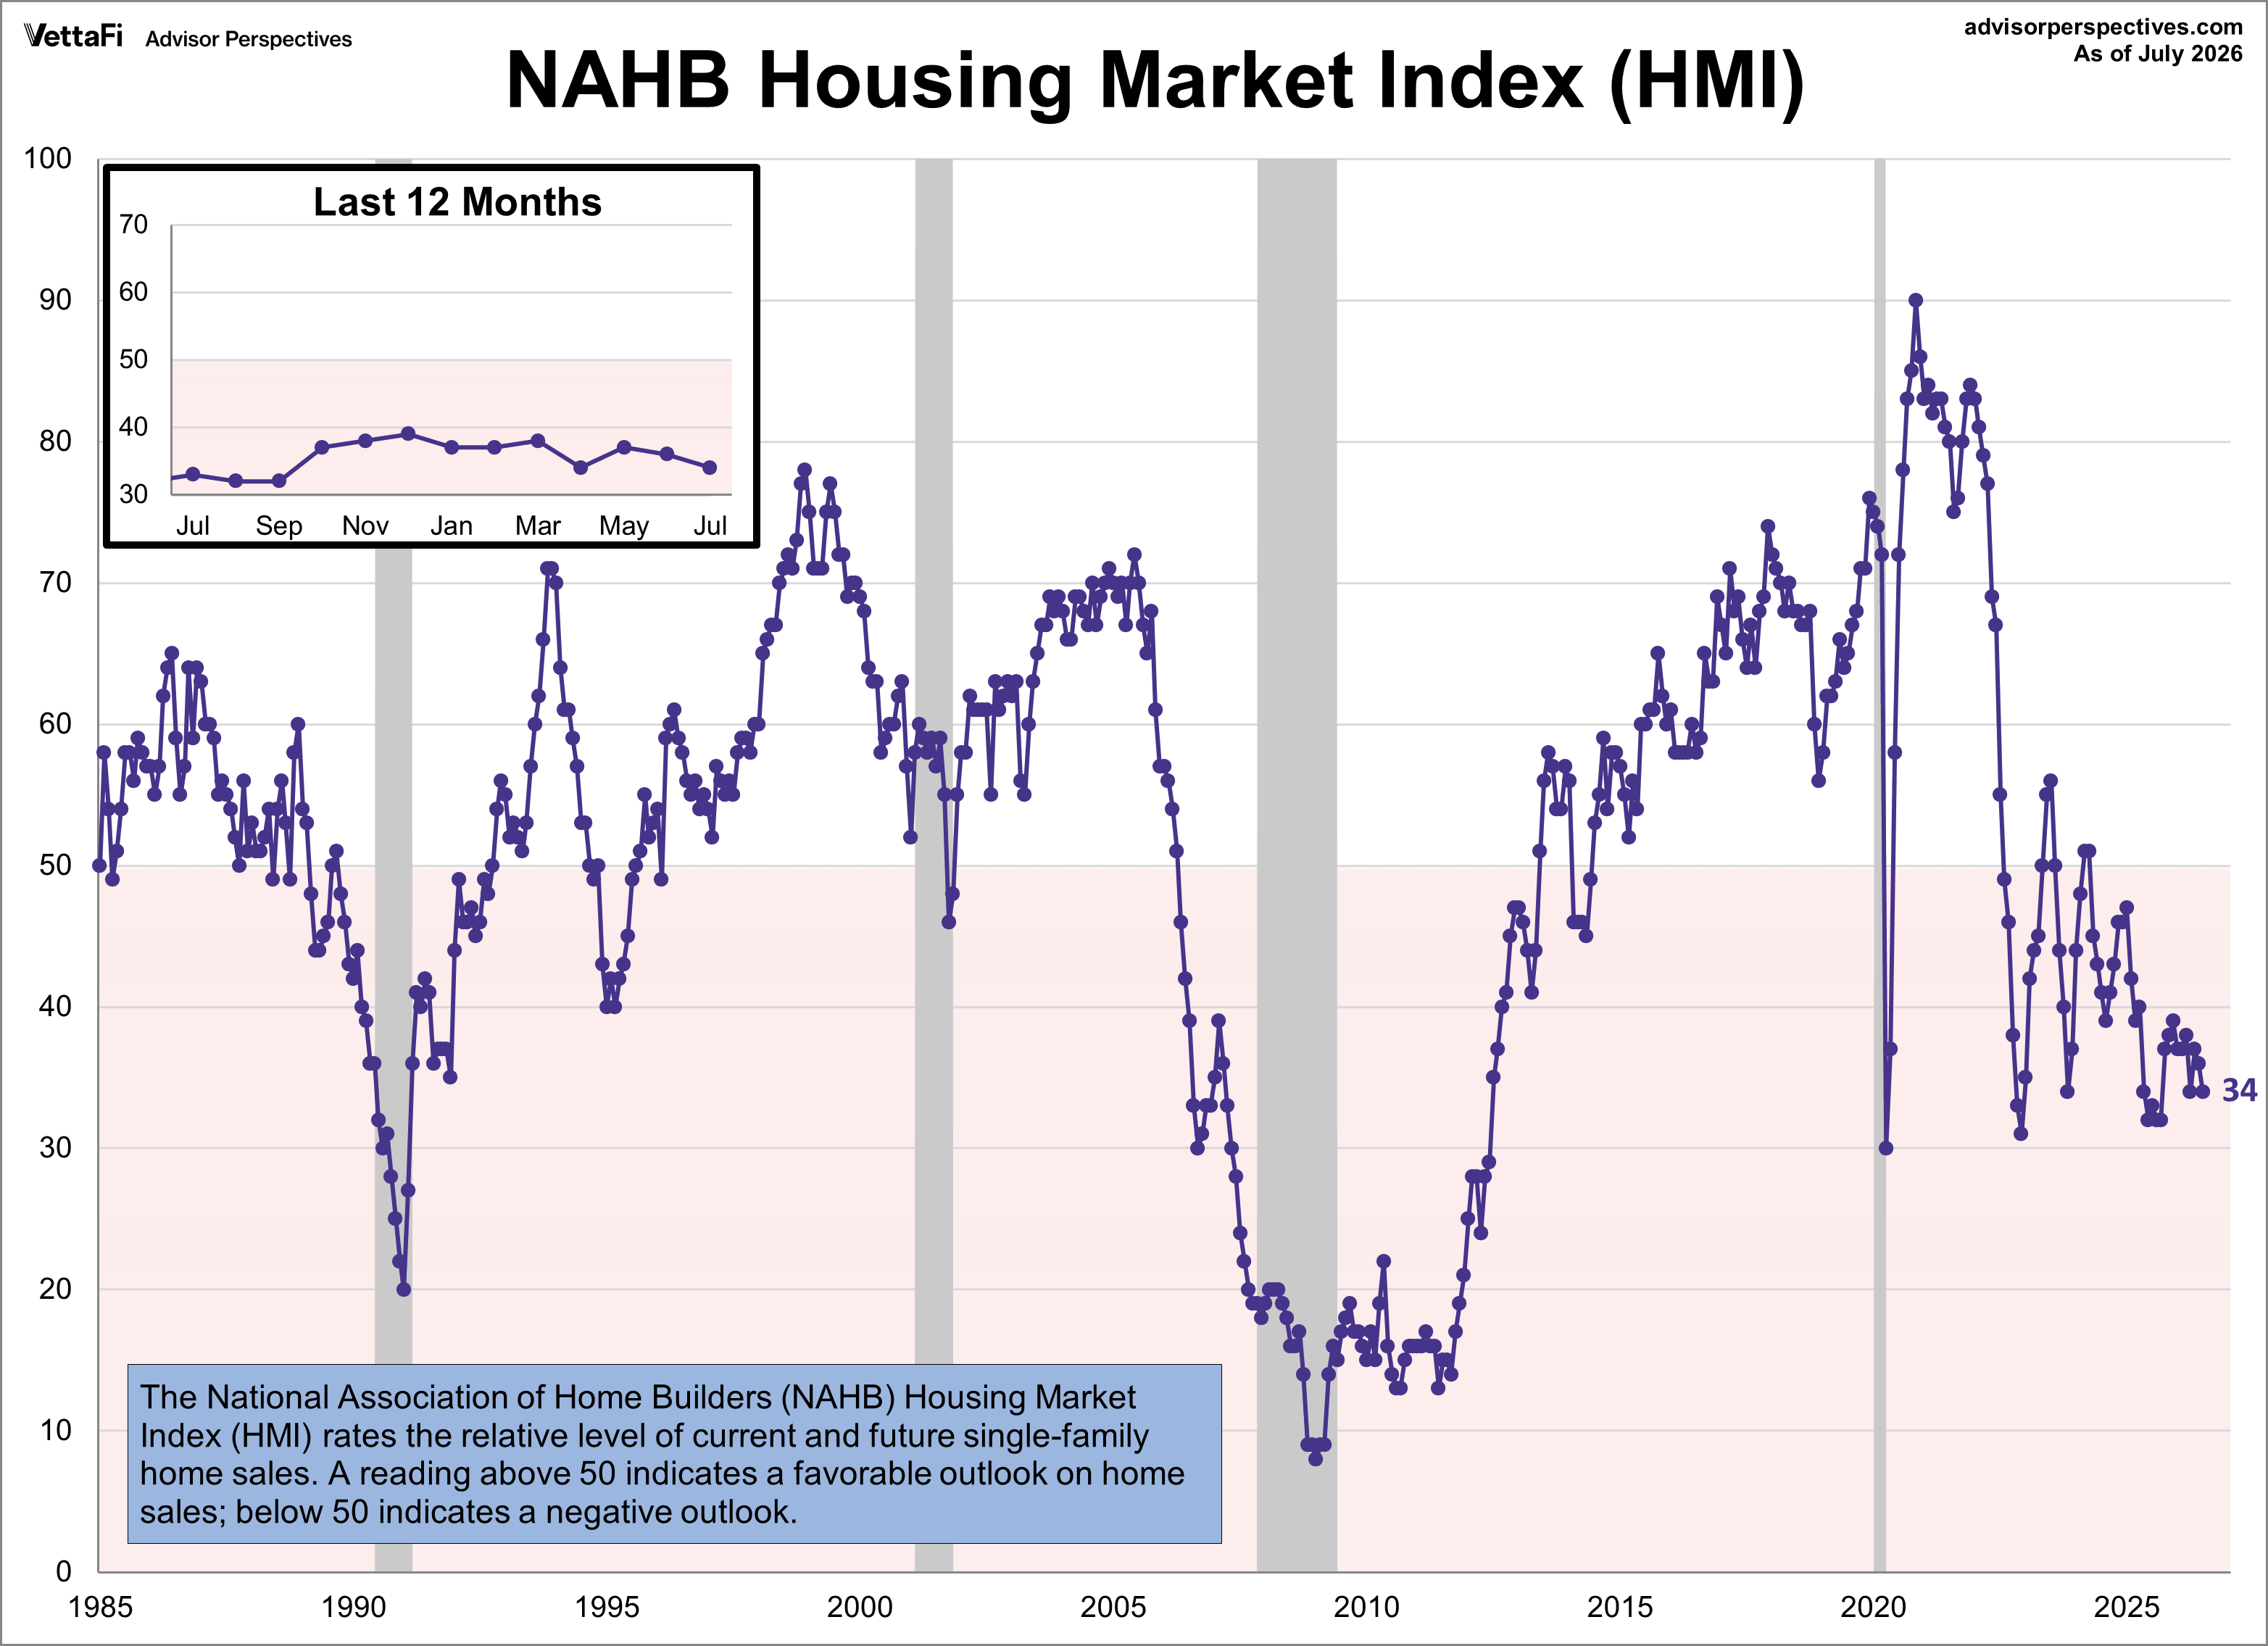
Builder confidence edged lower in July as ongoing affordability challenges continue to affect the housing market. The National Association of Home Builders Housing Market Index fell 2 points from June to 34 this month, marking the 27th consecutive negative reading. The latest reading was lower than the forecast of 35.
“Many potential buyers remain on the sidelines as they wait for lower mortgage rates, more certainty on inflation and a clearer economic outlook,” said NAHB Chairman Bill Owens, a home builder and remodeler from Worthington, Ohio. “The recently enacted 21st Century ROAD to Housing Act contains important provisions on land-use and zoning, regulatory reform and financing tools that address obstacles facing builders and buyers, but these reforms will take time to implement.”
“With the HMI below 40 for 15 straight months, affordability remains the home building industry’s primary challenge, as elevated mortgage rates, costly land, rising material prices, and persistent skilled labor shortages continue to affect the market,” said NAHB Chief Economist Robert Dietz. “Looking ahead, the newly enacted housing law is a positive step that will help expand housing supply and lower overall housing costs, although more policy change is needed at the state and local level.”
Background on the NAHB Housing Market Index
The National Association of Home Builders (NAHB) Housing Market Index (HMI) is a gauge of builder opinion on the relative level of current and future single-family home sales. The data is collected from a monthly survey of about 900 home builders asking respondents to, "rate market conditions for the sale of new homes at the present time and in the next six months as well as the traffic of prospective buyers of new homes." It is a diffusion index, which means that a reading above 50 indicates a favorable outlook on home sales; below 50 indicates a negative outlook.
Here is the historical series, which dates from 1985.
Components of the the NAHB Housing Market Index
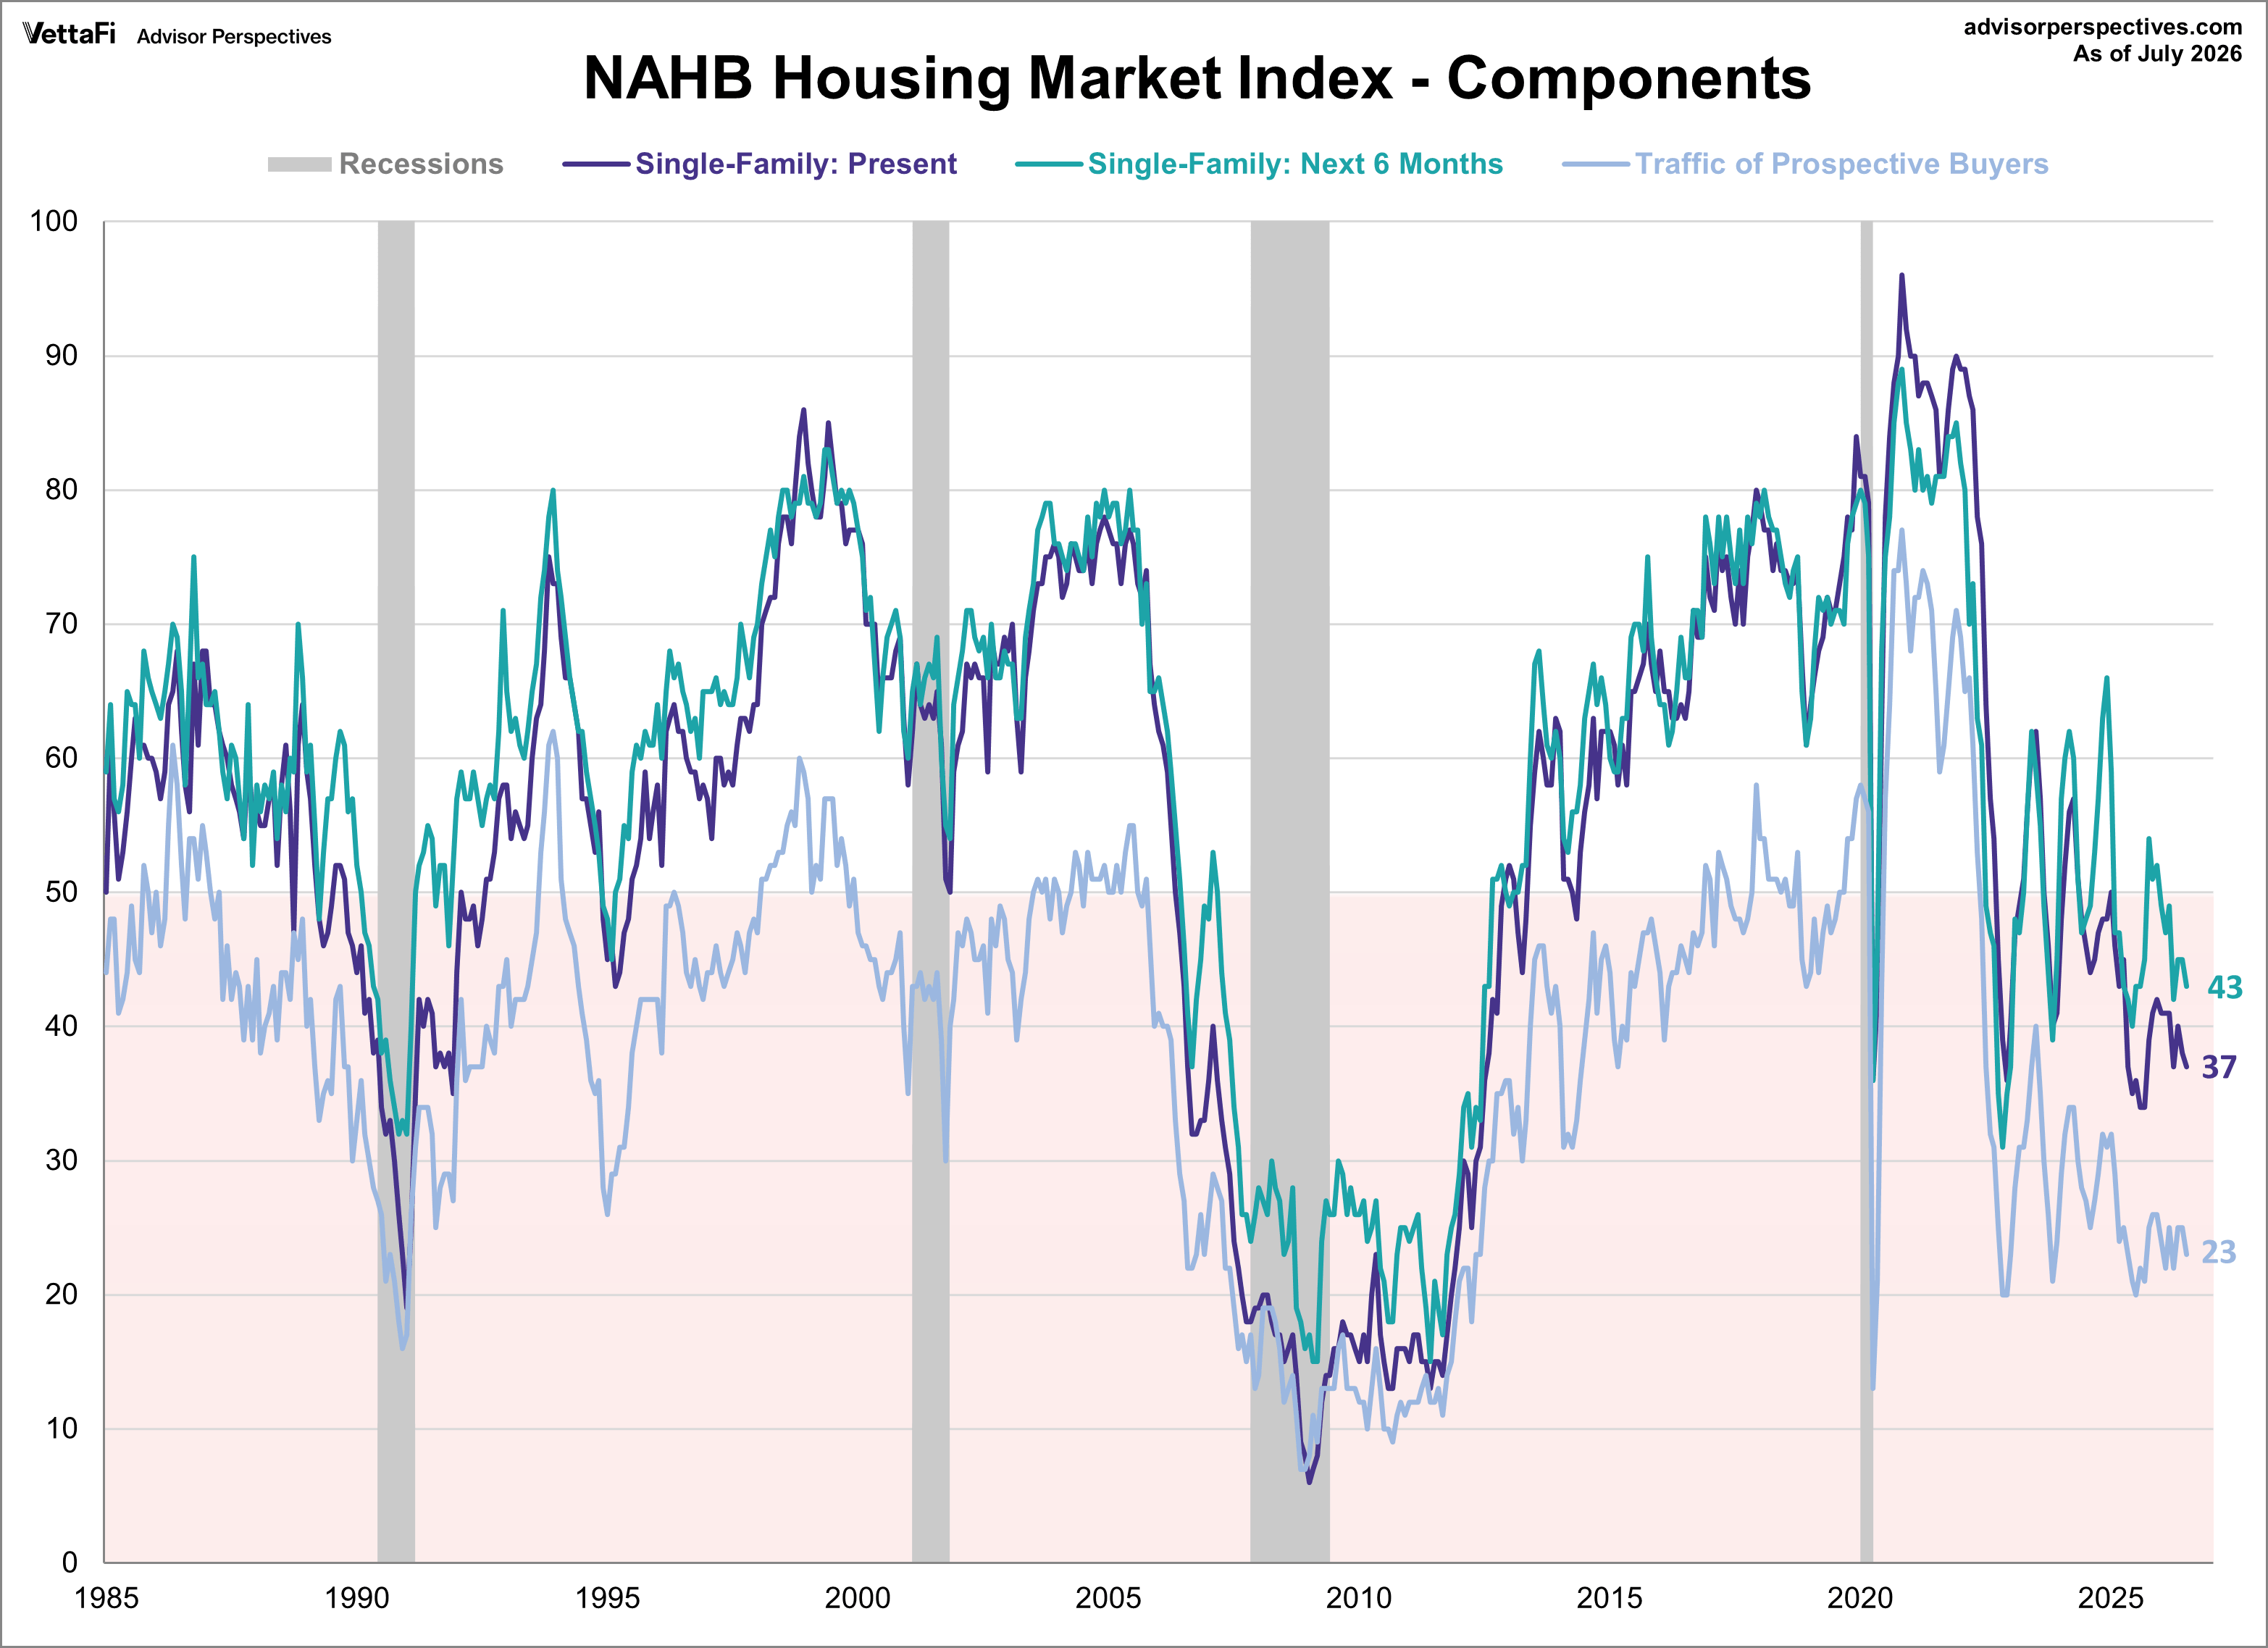
The NAHB Housing Market Index is calculated based off of three components: current sales, expected sales in the next six months, and traffic of prospective buyers. Here are the readings for July:
- Current sales fell one points to 37.
- Expected sales in the next six months dropped two points to 43.
- Traffic of prospective buyers declined two points to 23.
Housing Market Index: Regional Breakdown
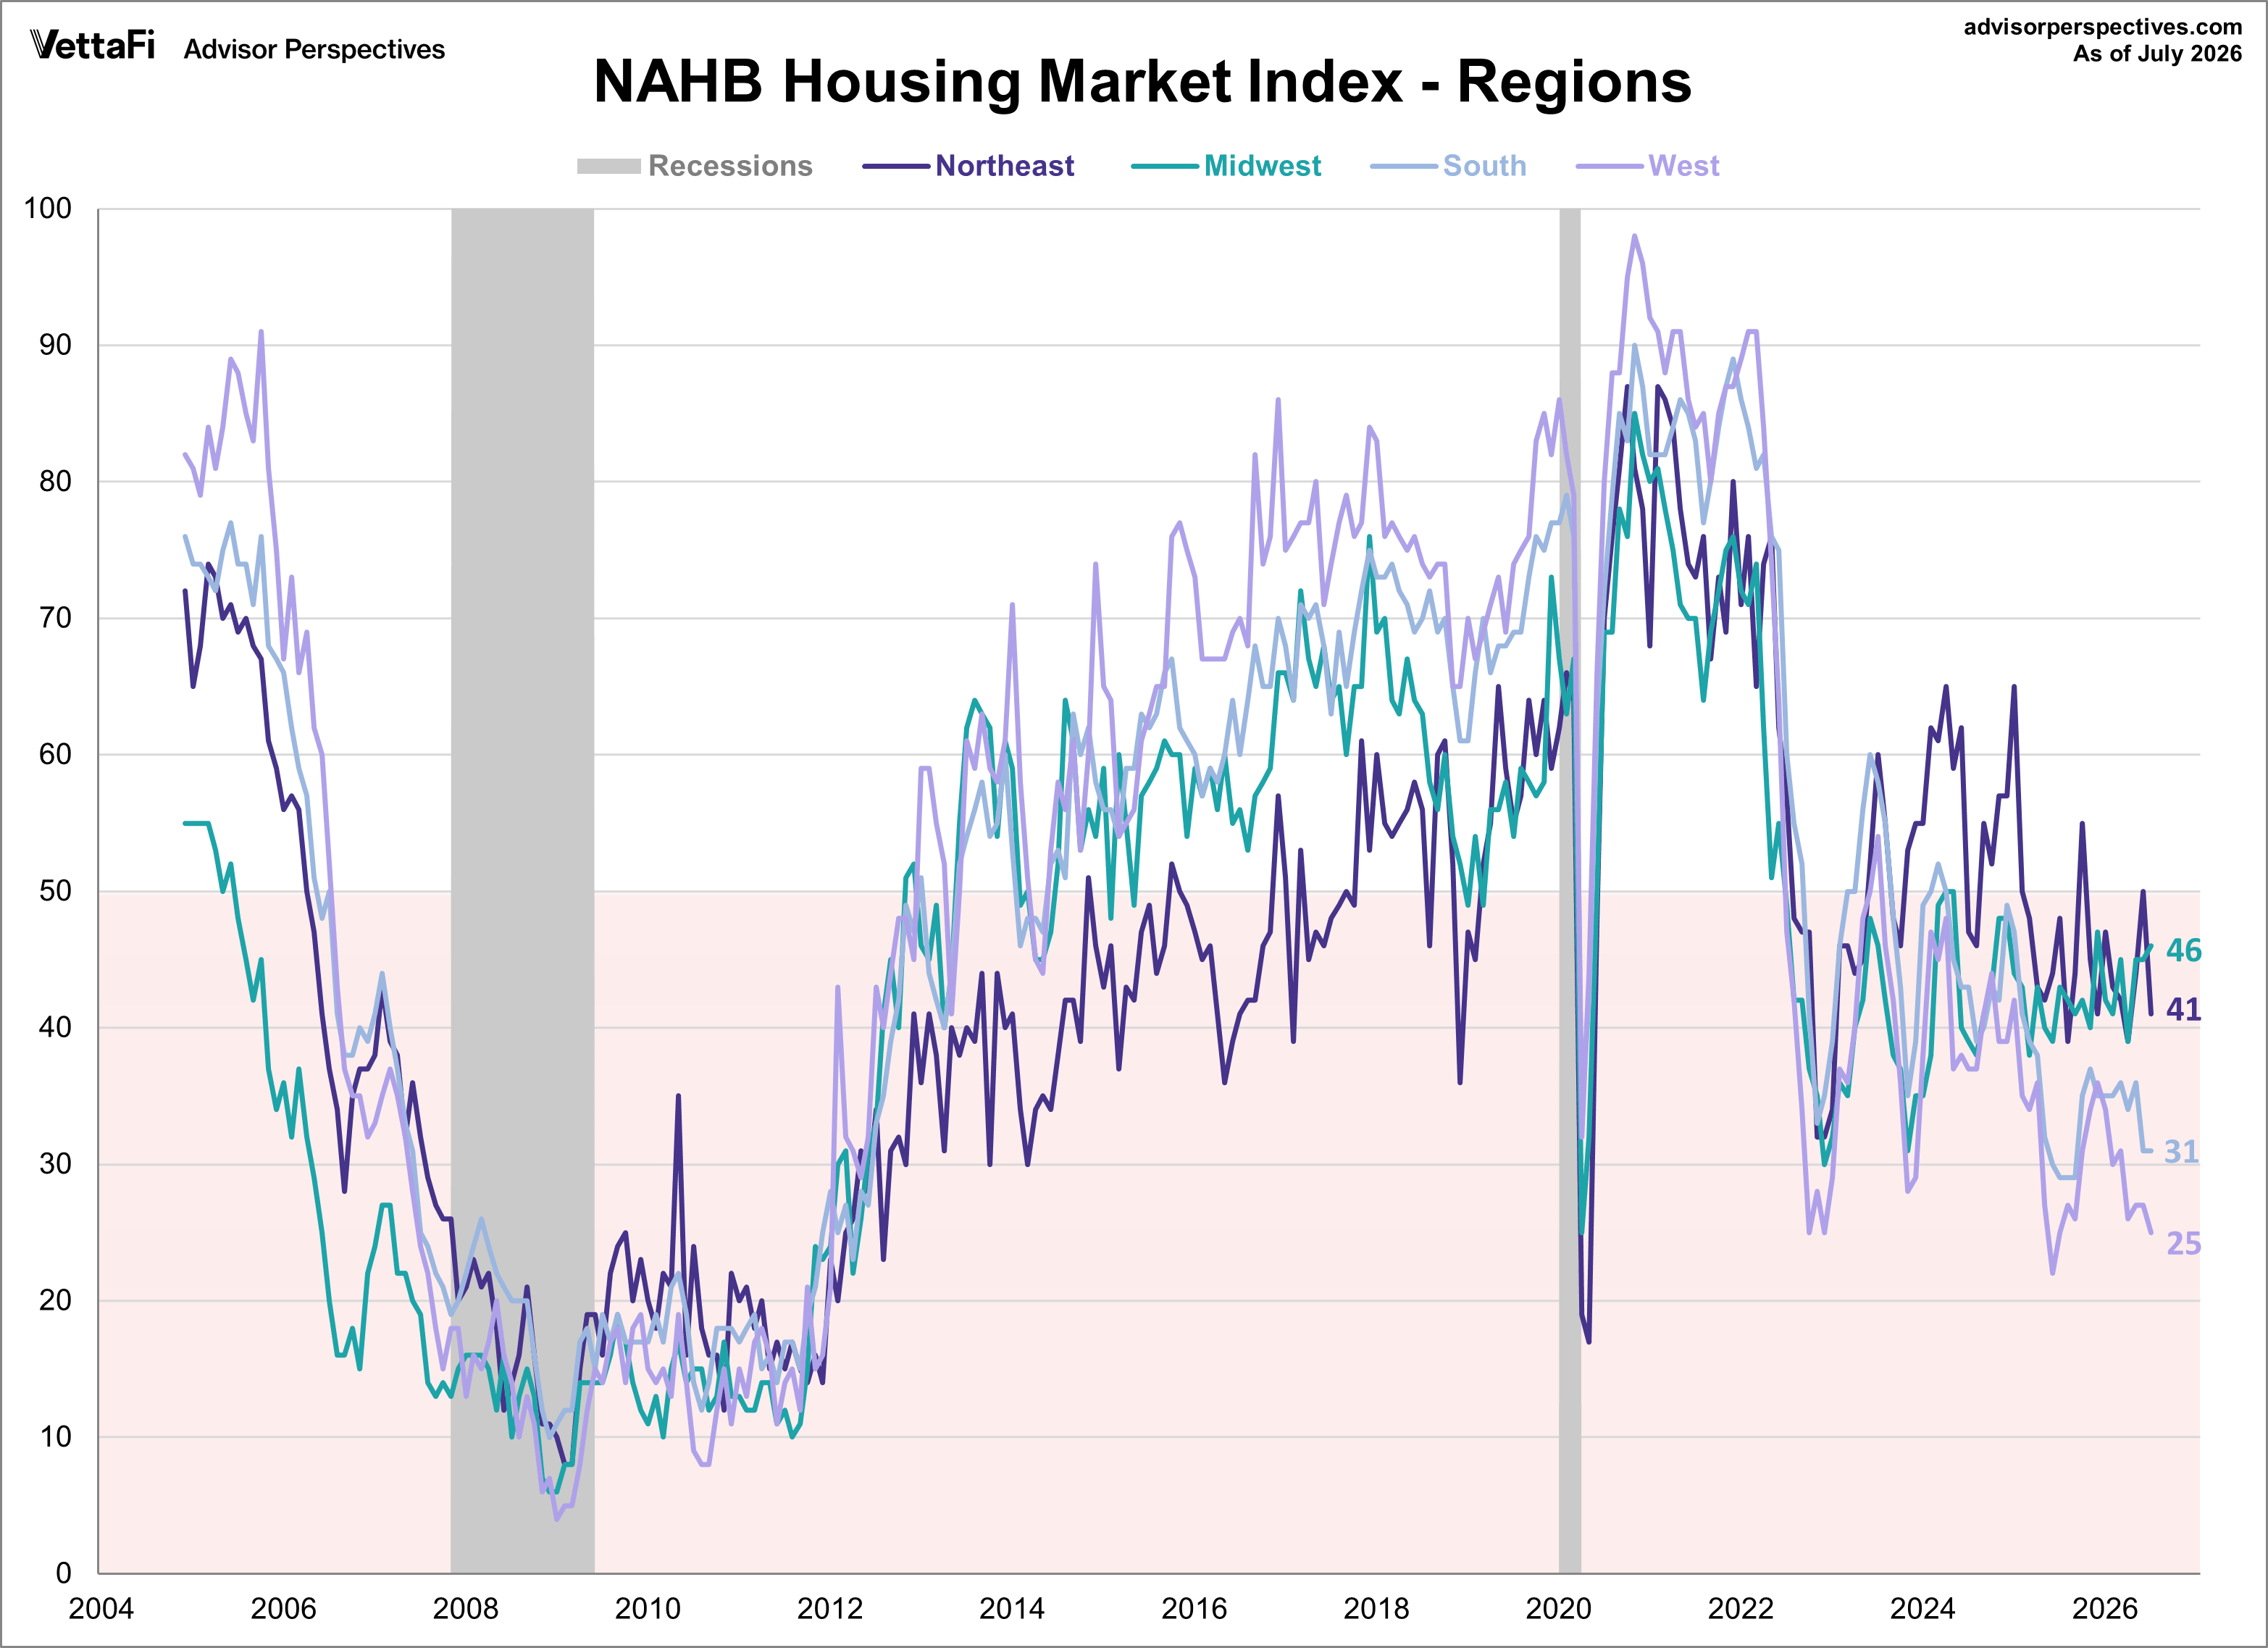
The chart below gives a regional breakdown of the NAHB HMI in four regions of the country: Northeast, Midwest, South, and West. Here are the readings for July:
- The Northeast dropped nine points to 41.
- The Midwest rose one point to 46.
- The South was unchanged at 31.
- The West fell by two points to 25.