This article looks at the 10-year Treasury yield's historical trends since 1962, exploring its relationship with key economic indicators like the Fed Funds Rate (FFR), inflation, and the S&P 500.
Fighting Inflation vs. Stimulating Recovery
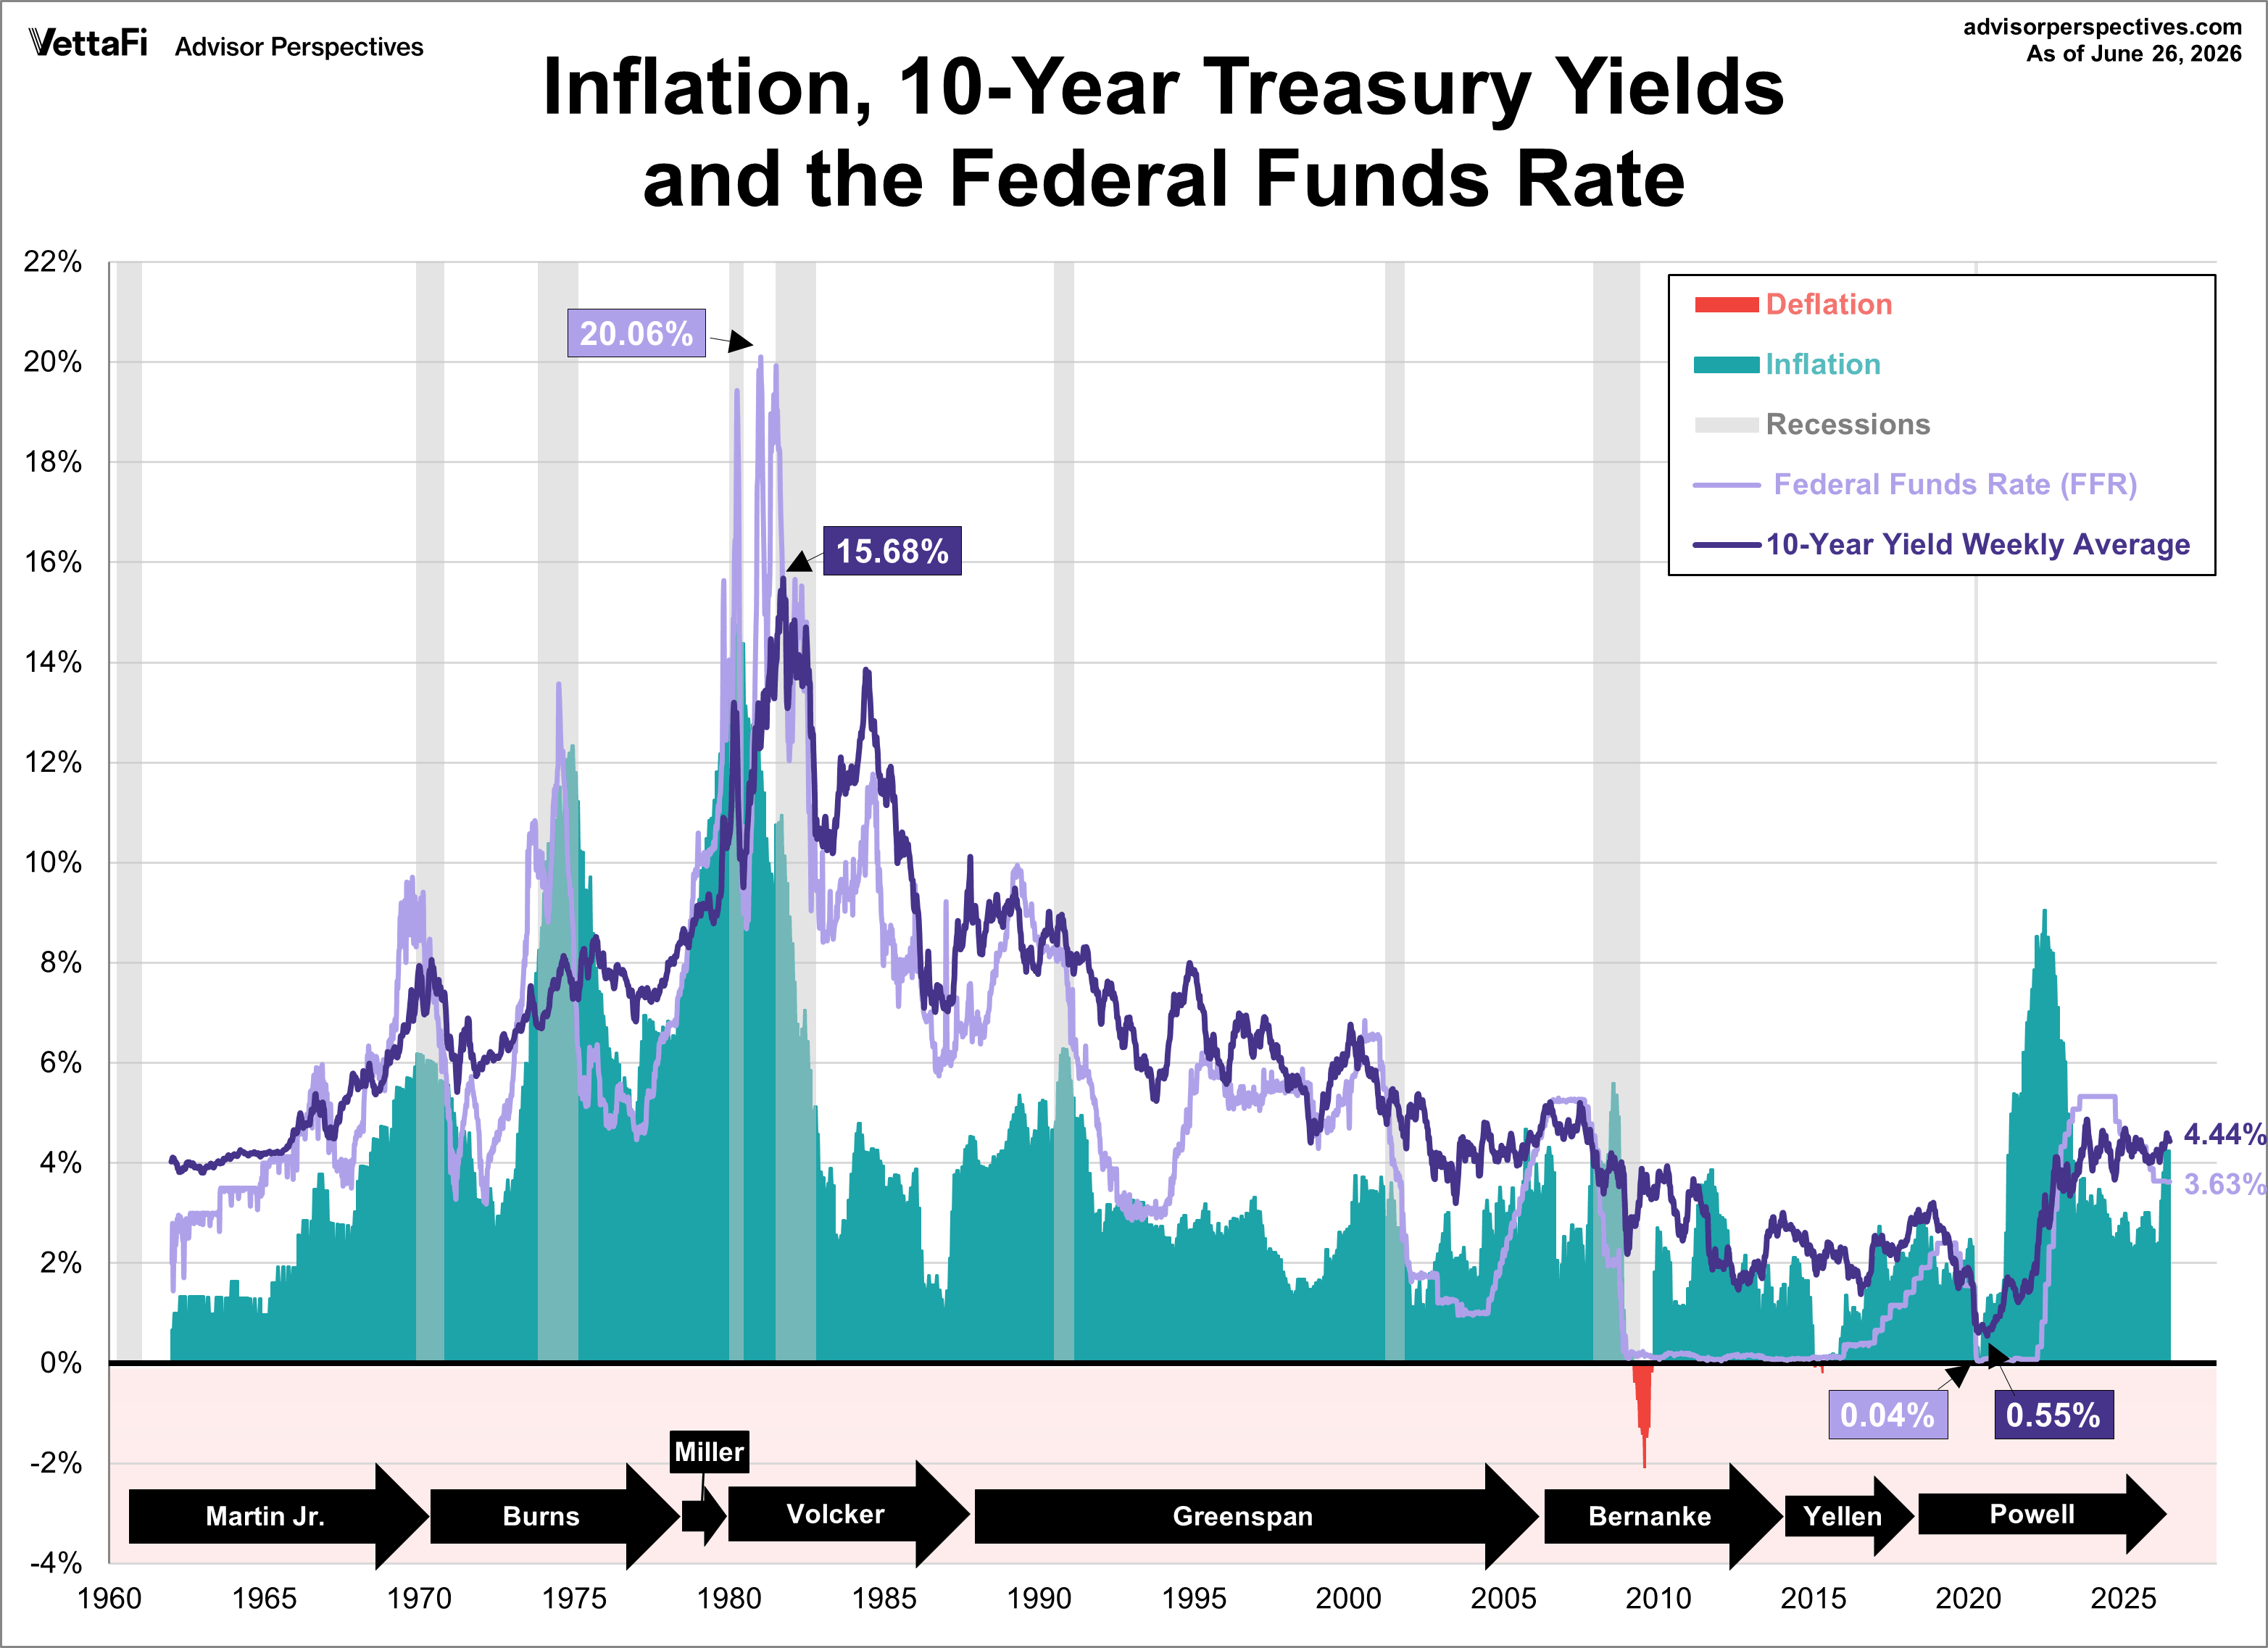
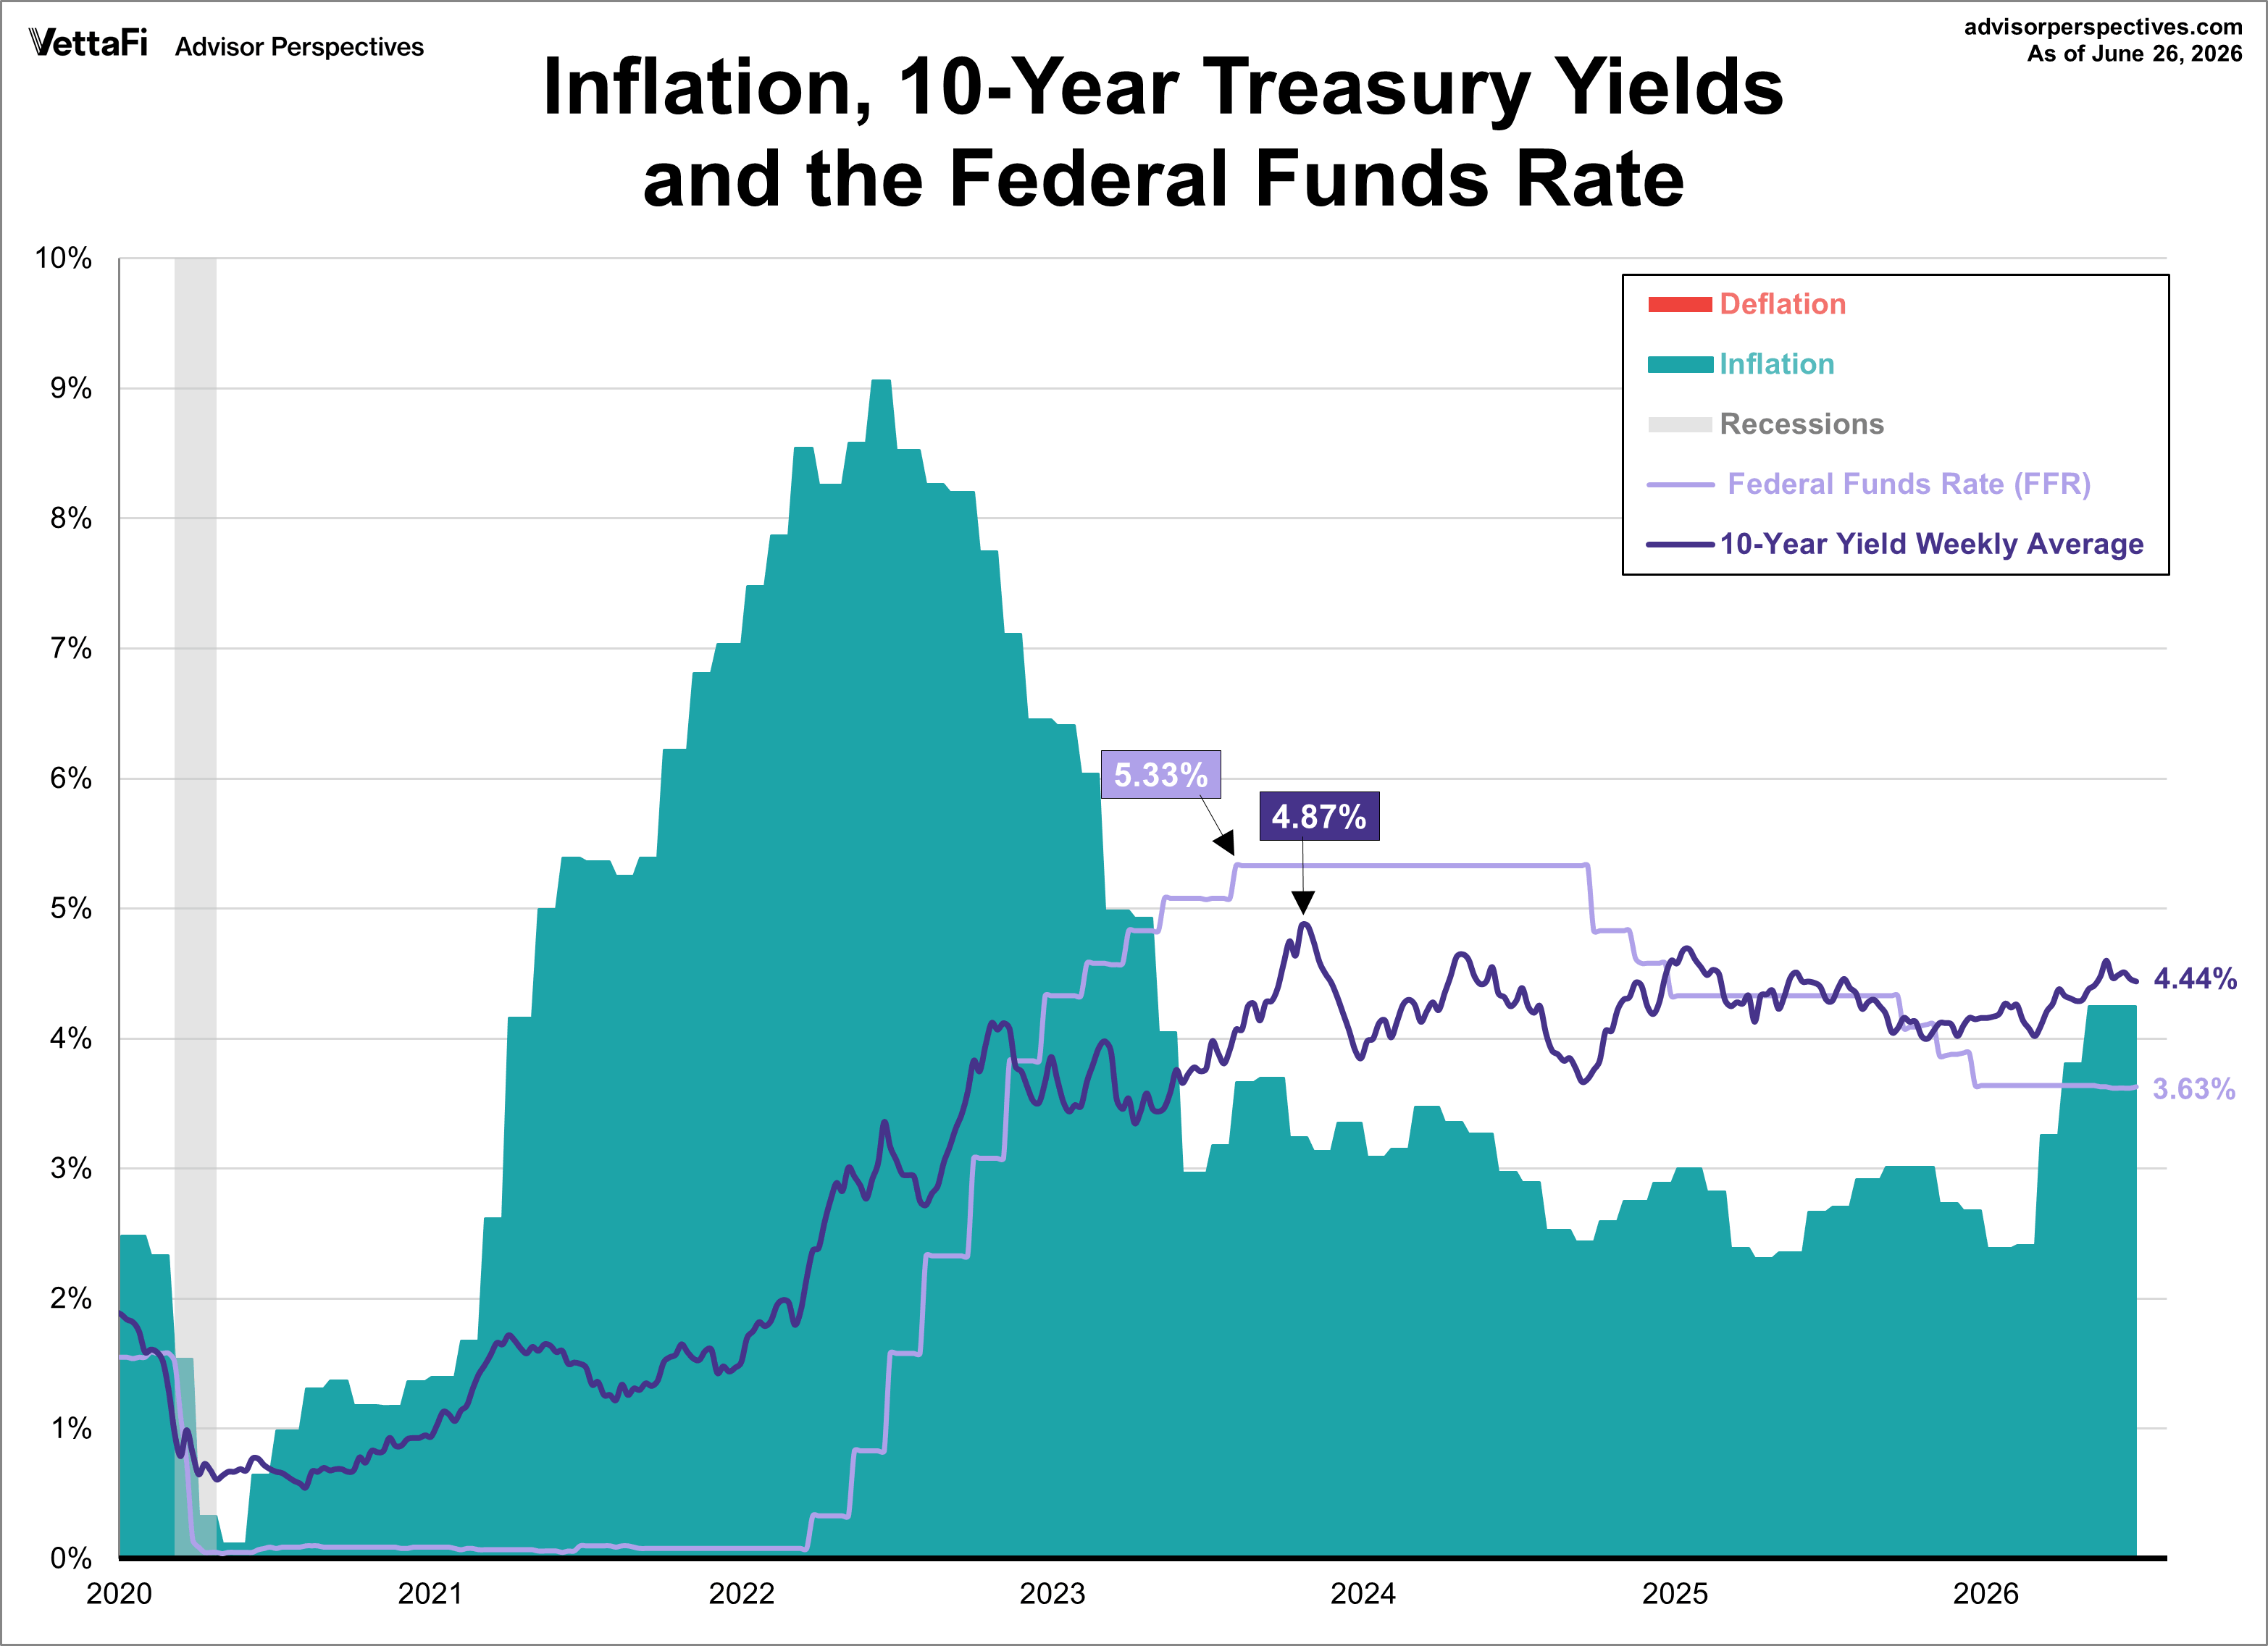
The 10-year Treasury yield has experienced dramatic fluctuations, ranging from a peak of 15.68% in October 1981, during the height of the Volcker era, to a historic low of 0.55% in August 2020, amidst the economic uncertainty of the pandemic. More recently, at the end of June 2026, the weekly average stood at 4.44%.
The stagflation crisis of the late 1970s and early 1980s demanded drastic measures. To combat soaring prices, Federal Reserve Chairman Paul Volcker pushed the Federal Funds Rate (FFR) to a historic high of 20.06% in January 1981. This aggressive tightening of monetary policy was instrumental in curbing runaway inflation, albeit at the cost of a significant economic slowdown. Nine months later, in October 1981, the 10-year yield's weekly average hit a peak of 15.68%.
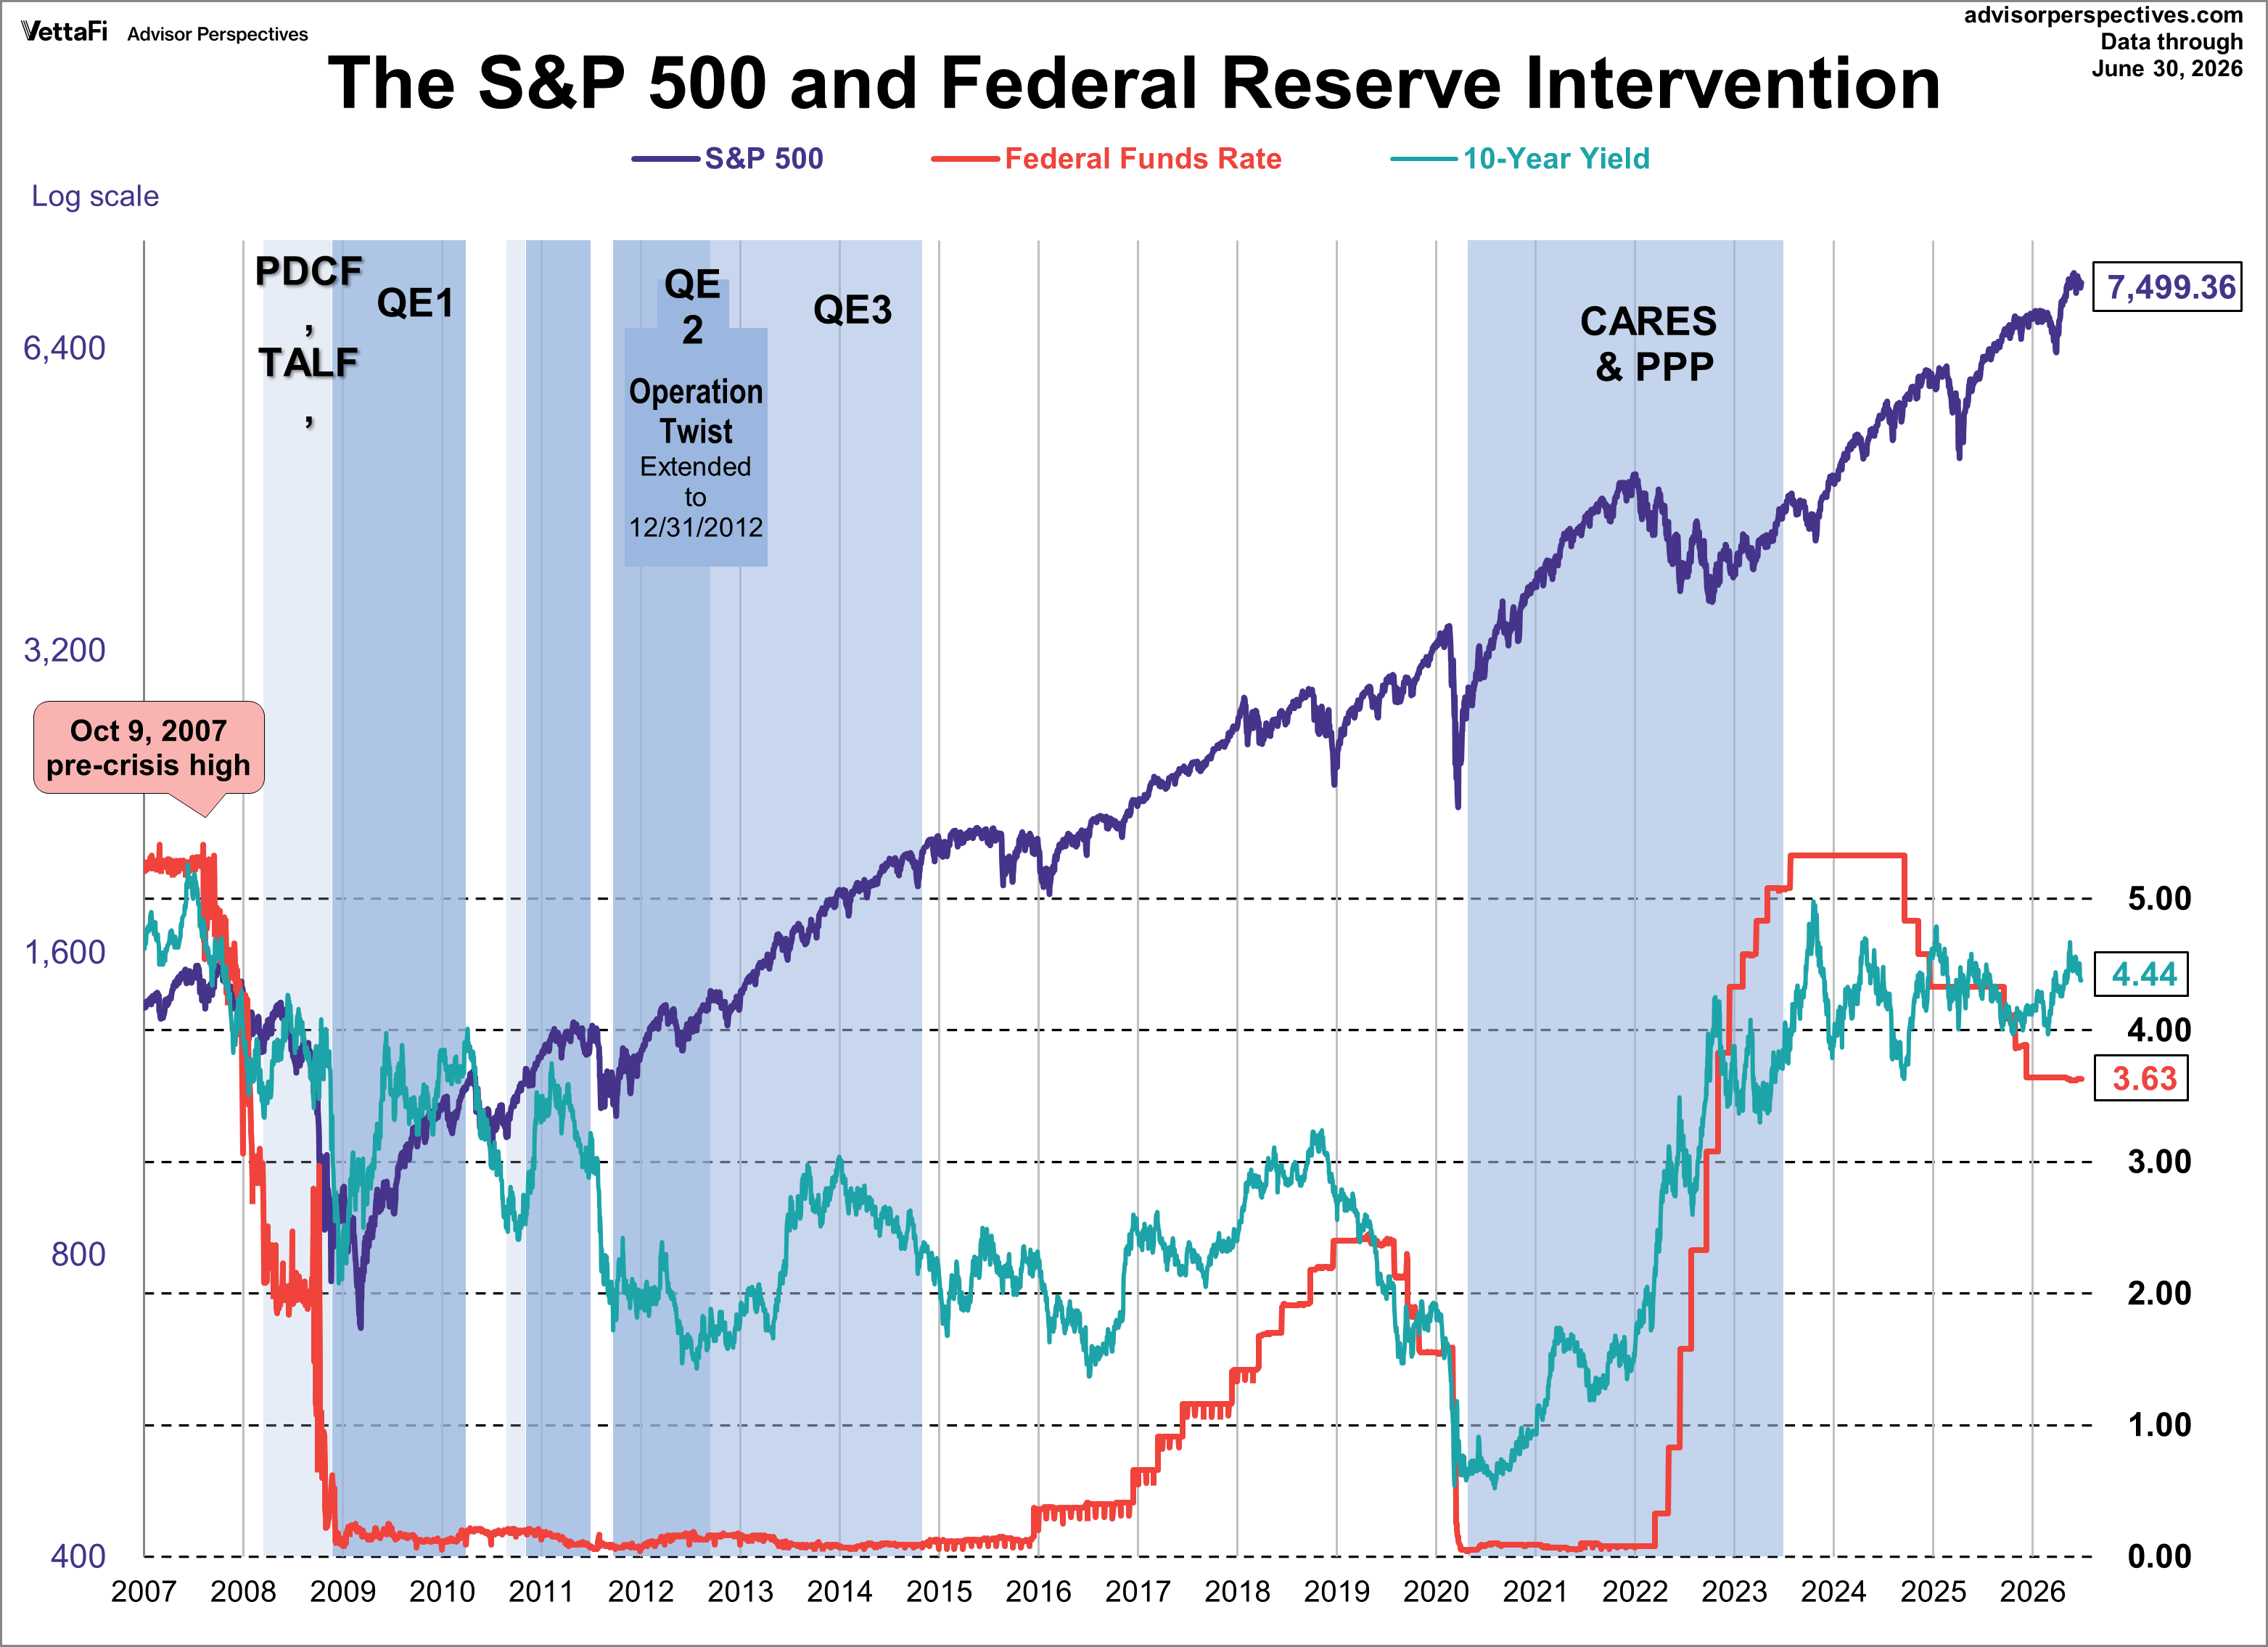
In stark contrast, the FFR was driven to near-zero levels in the aftermath of the 2008 financial crisis and again during the economic turmoil of the 2020 pandemic. Specifically, the FFR reached a record low of approximately 0.04% in May 2020. A few months later, the 10-year yield weekly average fell to a historic low of 0.55% in August. These periods of ultra-low interest rates aimed to stimulate borrowing, investment, and economic recovery.
The Recent Surge and Policy Response
This period of ultra-low rates was followed by inflation reaching its highest levels since the aforementioned stagflation crisis. In response, the Fed began raising rates to fight inflation, though some would argue their efforts were too late. From May 2022 to August 2023, the Fed quickly raised the FFR to its highest level in over 20 years. The 10-year yield moved in similar fashion, tracking the sharp rise in the FFR.
The Fed then held its rate steady for just over a year as inflation cooled from its 2022 peak. However, the central bank shifted course in September 2024, implementing three consecutive rate cuts. Interestingly, while the FFR declined during the back end of 2024, the 10-year yield moved in the opposite direction and inflation remained sticky.
In 2025, the Fed maintained steady rates for the first half of the year before implementing three consecutive rate cuts to close out the year. Meanwhile, the 10-year yield has slowly trended downwards, moving mostly in sync with the FFR. Despite these rate moves, inflation heated up for most of the year, remaining well above the Fed's 2% target. At the end of June, the 10-year yield weekly average stood at 4.44% while inflation was at 4.25%.
At their most recent meeting, the Federal Reserve elected to hold the federal funds rate at 3.50%–3.75%. The decision, which markets had fully priced in, keeps the benchmark rate at its lowest level since November 2022 for the fourth meeting in a row.
In their noticeably shorter statement from the meeting, the Committee noted, "Inflation remains elevated relative to the Committee's 2 percent goal, in part reflecting supply shocks that have driven price increases in certain sectors, including energy." They stated that they will "deliver price stability."
The Fed will meet again at the end of this month where they are expected to hold rates steady. At the time of writing, the CME FedWatch Tool shows a 73% likelihood the Fed will hold rates where they are versus a 27% likelihood of a 25 basis point hike.
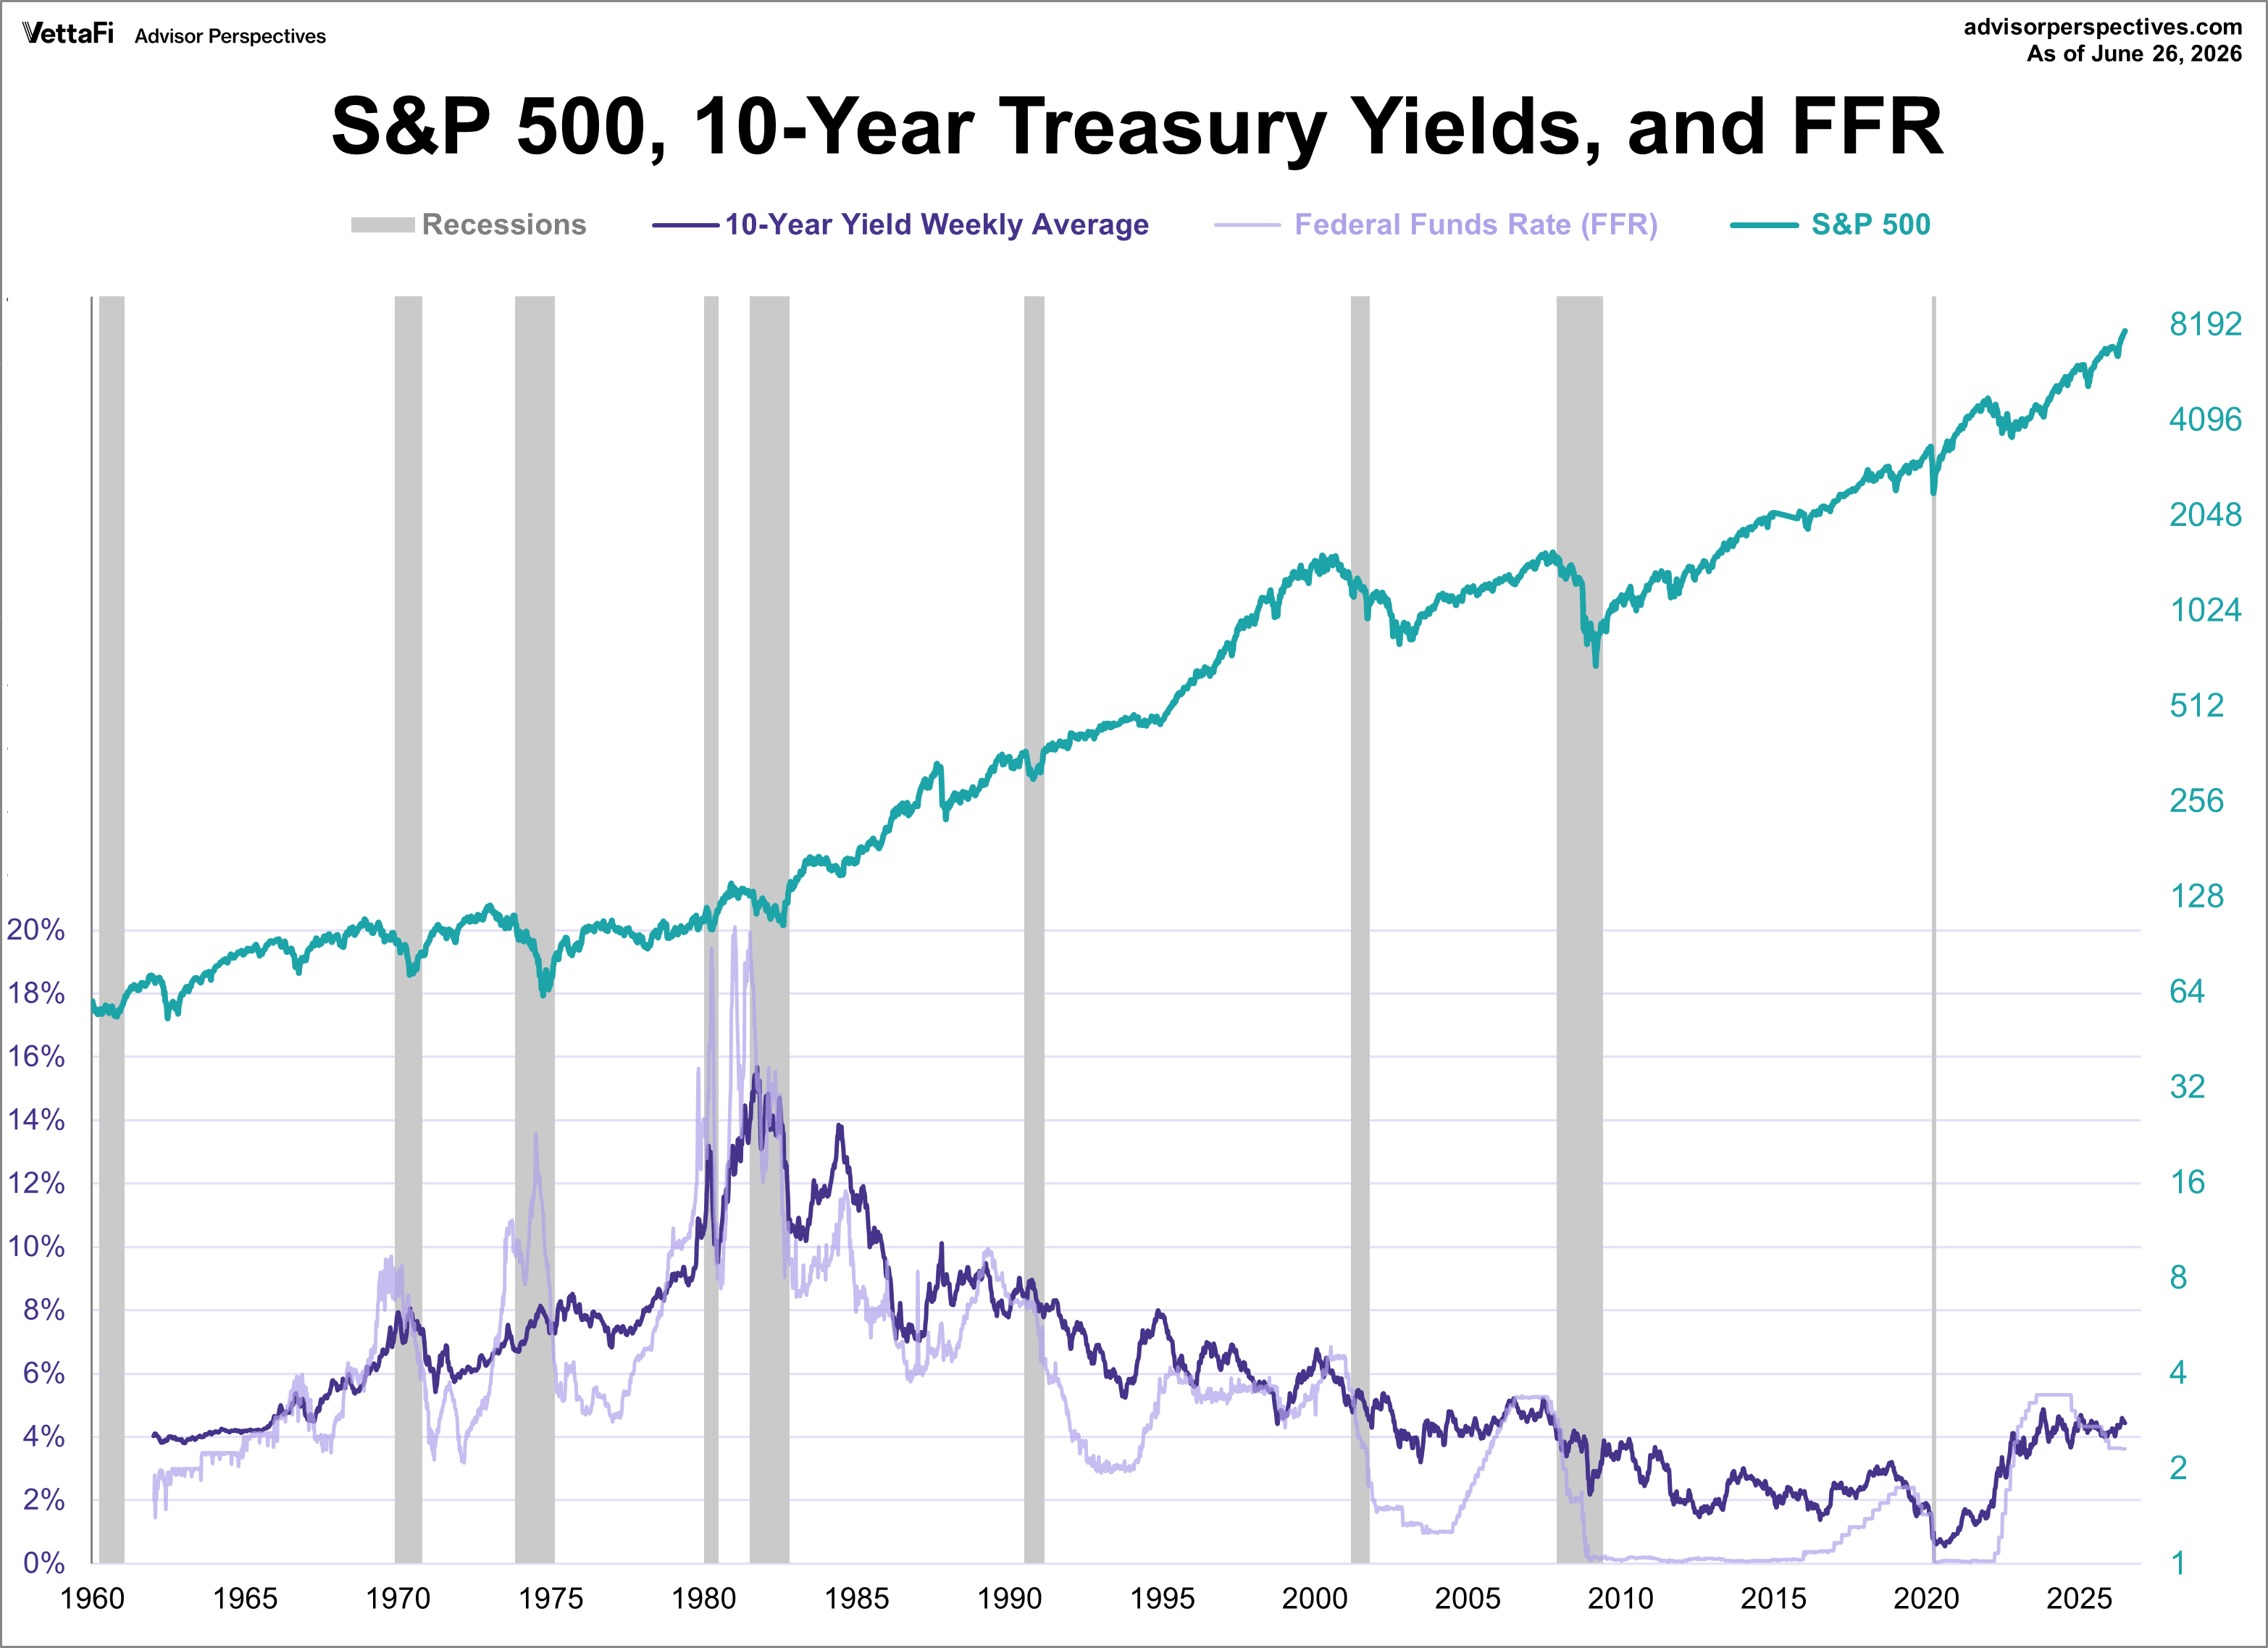
Treasuries vs. Equities
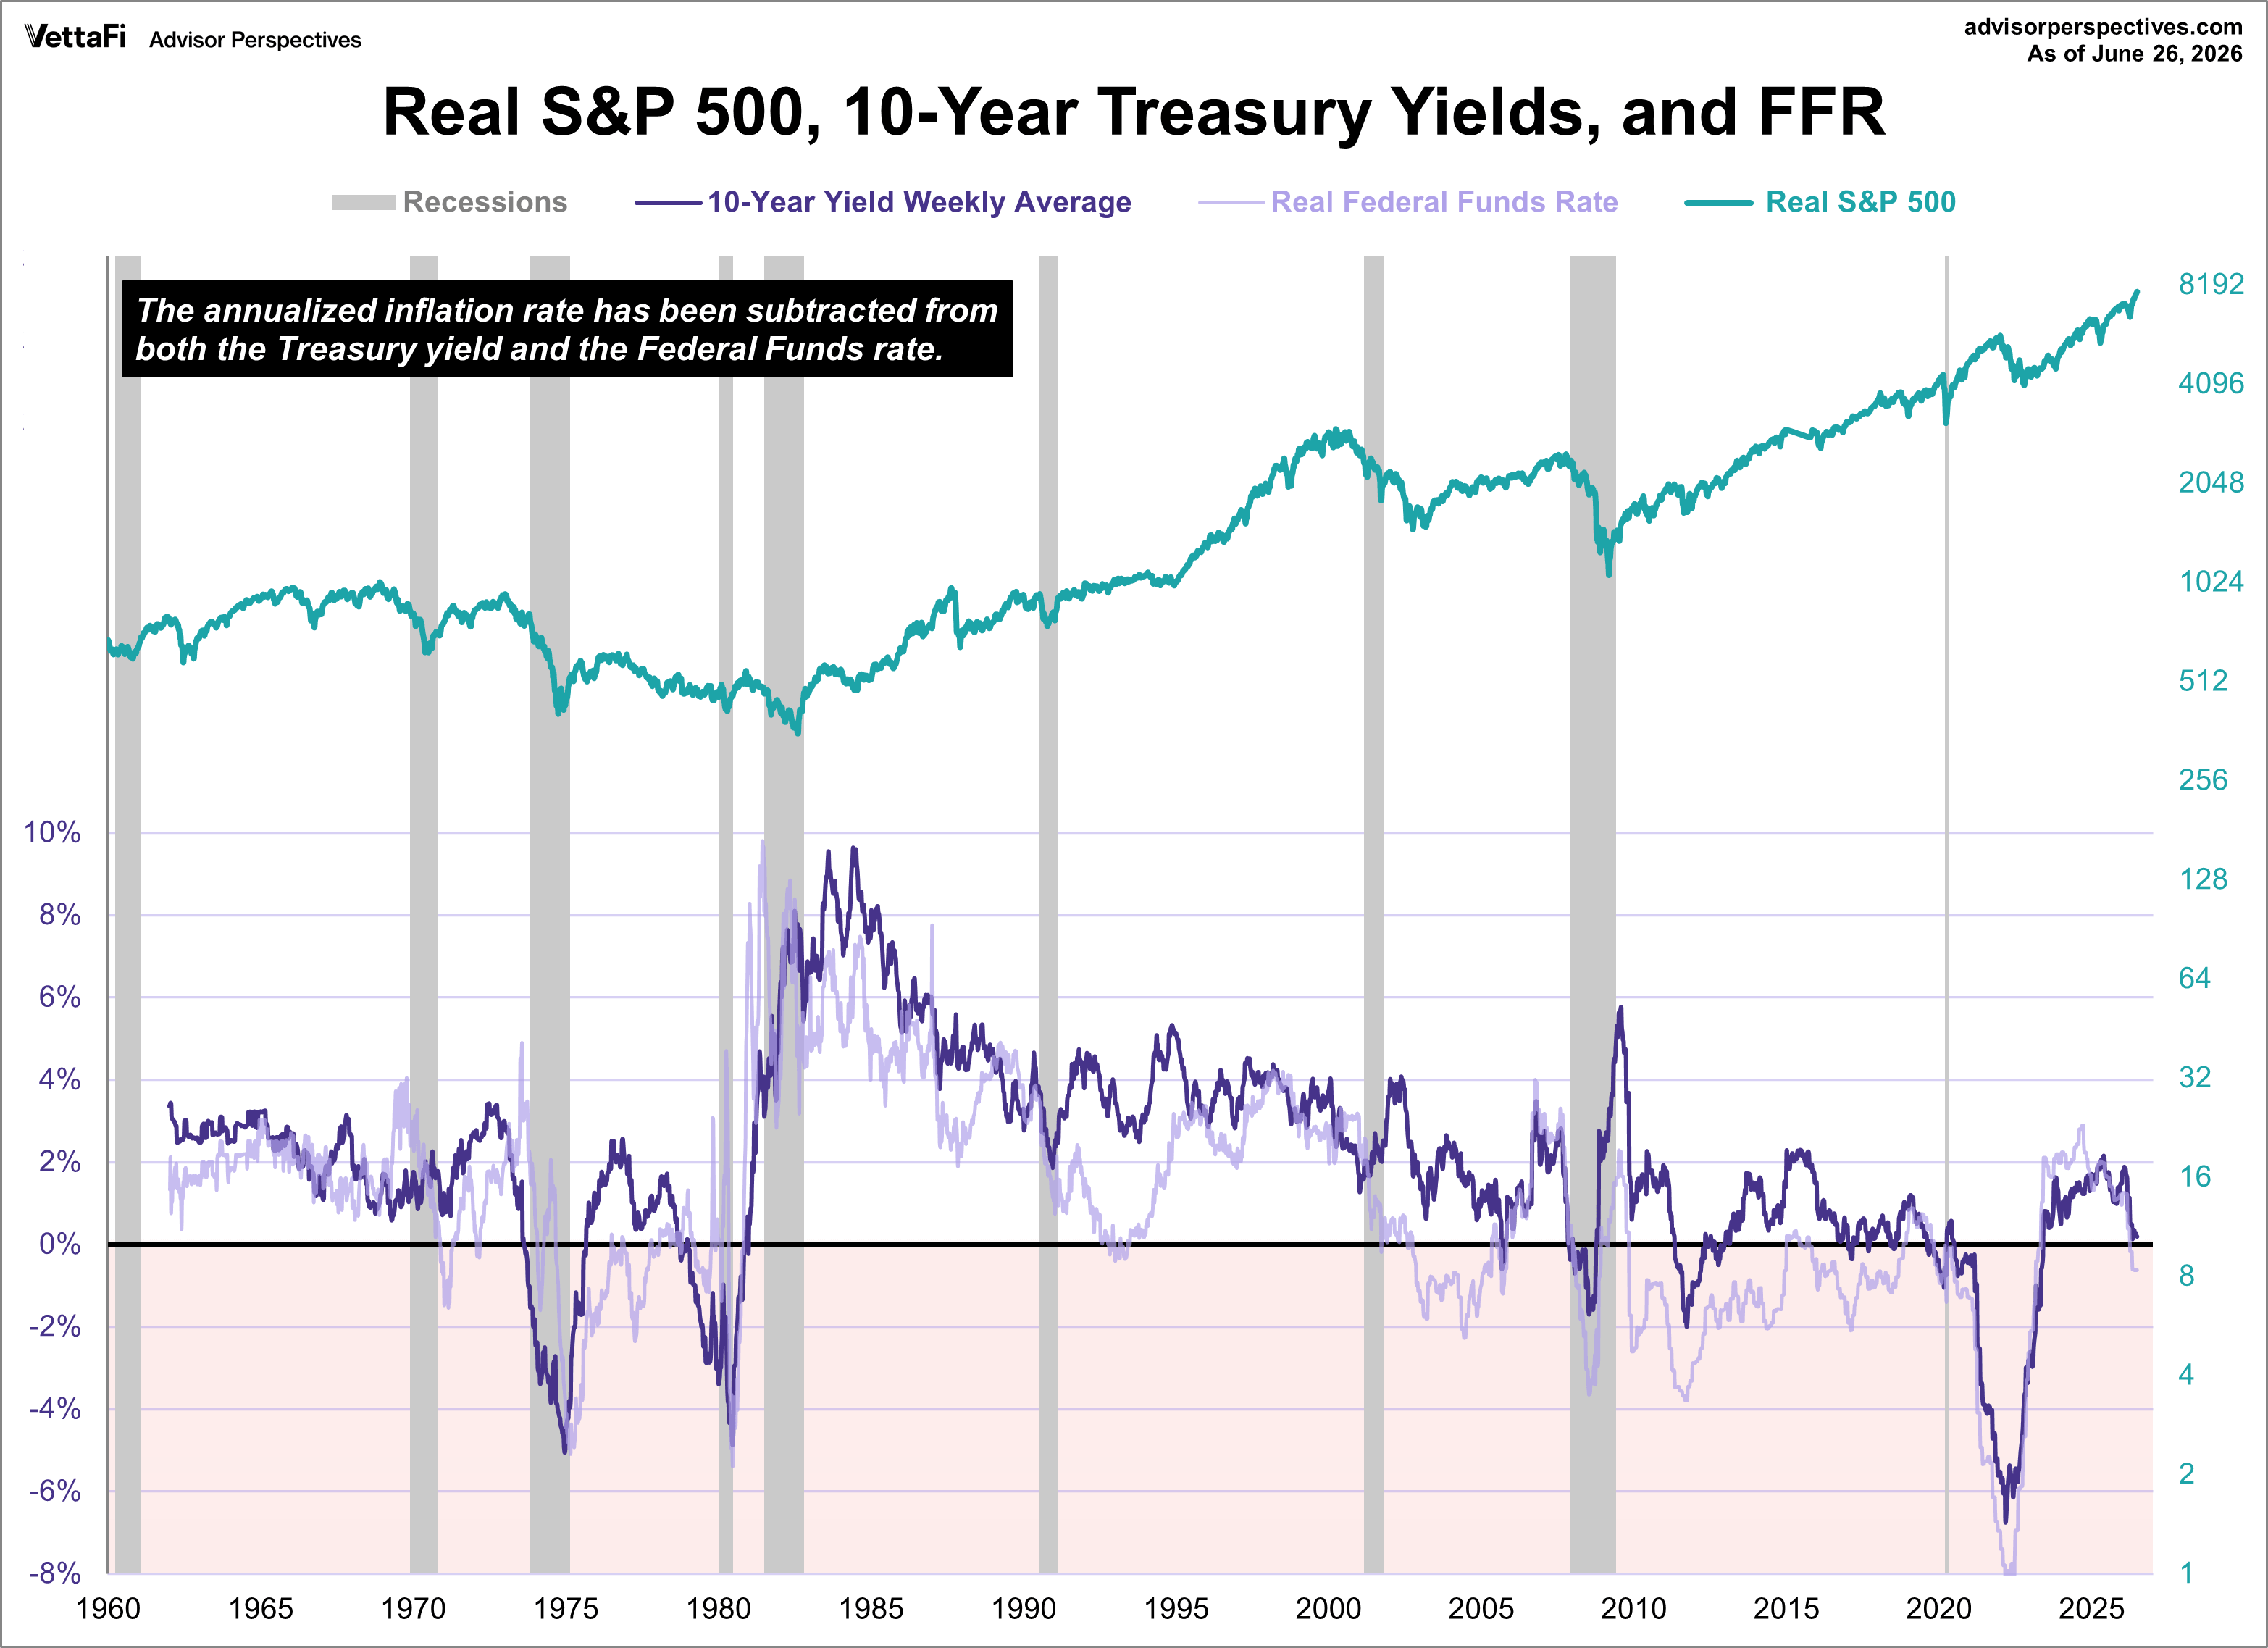
In our next chart, the S&P 500 is overlaid with the 10-year yield’s weekly average and the Fed Funds Rate. Generally, equities and treasuries tend to move in opposite directions. When one goes up; the other goes down. However, that’s not always the case. During inflationary periods, like the past few years, both move in tandem due to the impact of higher interest rates on corporate profits and bond prices. The initial chart presents nominal values, meaning it doesn't account for inflation. This can create a misleading picture of the actual purchasing power of yields and equity returns.