Might Makes Right Is Back. Are Markets Already Adjusting?
Membership required
Membership is now required to use this feature. To learn more:
View Membership BenefitsThis past week, I had the privilege of attending the 2026 Harvard Presidents’ Seminar alongside some of the nation’s top executives and thought leaders. One of the most compelling speakers was Ambassador Kevin Rudd, former prime minister of Australia.

Rudd spoke with clarity and, yes, concern about the shape of the world we’re heading into. The post-World War II, rules-based order—the one that gave us globalization, multilateralism, NATO, the World Trade Organization (WTO), etc., is likely over. What comes next appears to be a return to 19th century-style governance, characterized by “might makes right” and spheres of influence.
I wouldn’t call Rudd a doomsayer. He’s more of a realist who believes, as I do, that a strong U.S. is good for the world. Conversely, a weak U.S. creates dangerous power vacuums that China and Russia are all too eager to fill.
A New World (Dis)order?
During the 80-year period following World War II, the U.S. took a dominant role in shaping global norms, from open markets and free trade to the expansion of democracy and the U.S. dollar as the world’s reserve currency. We enjoyed relative peace.
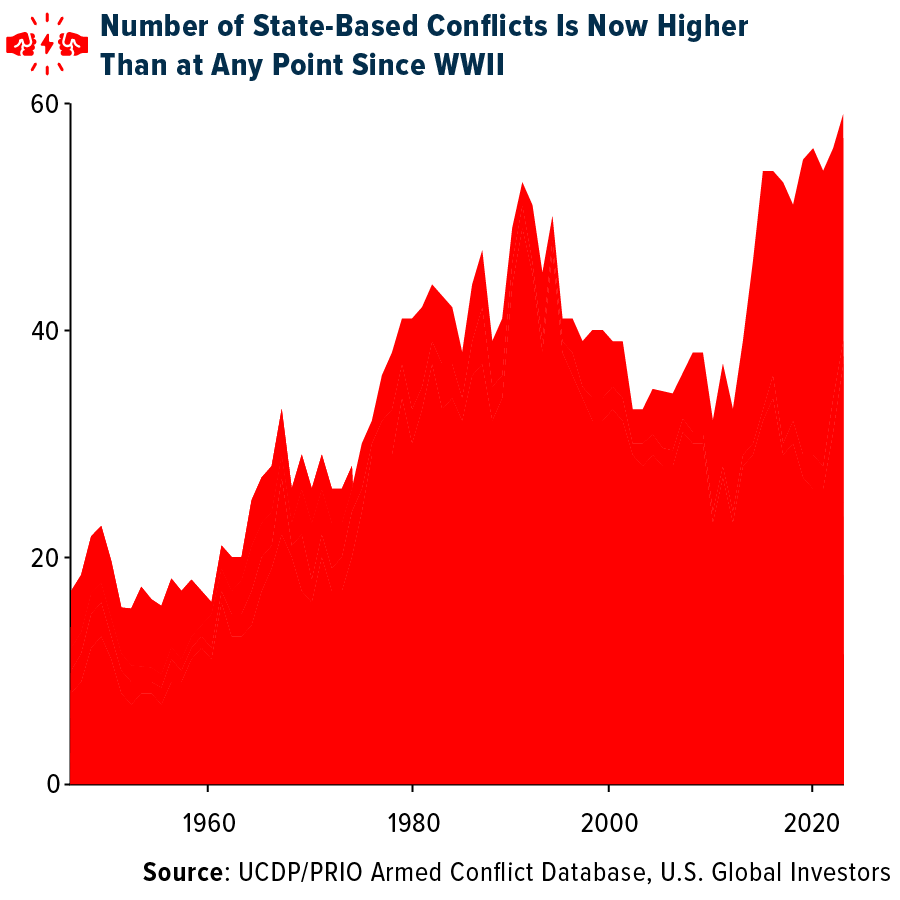
That era, Rudd suggests, may be coming to an end. Democracy appears to be in decline across the globe, while the number of armed conflicts is at its highest level since World War II.
China and Russia aren’t hiding their ambitions. Just this week, Xi Jinping and Vladimir Putin affirmed their deepening ties, pledging mutual support on economic, military and ideological fronts. And with the expiration of the New START treaty this month, the last vestige of nuclear arms control between the U.S. and Russia is gone.
Rewriting the Rules
Rudd, author of two major books on Xi, warned us that the current Chinese leader is no pragmatist in the vein of Deng Xiaoping, the former leader who jumpstarted the country’s ascendancy in the 1970s through meaningful market reform. Instead, Xi can better be described as a Marxist-Leninist nationalist.
Under Xi, China has shifted from playing by the rules to rewriting the rules. The Chinese Communist Party (CCP) is executing a comprehensive strategy across every conceivable domain, including military modernization, industrial dominance, energy independence and much, much more. In October, I shared with you my belief that China’s world-spanning Belt and Road Initiative (BRI) is a Trojan Horse.
Xi’s government sees economic power and national security as one and the same, and nowhere is that more apparent than in energy and technology.
China’s Massive Energy Buildout
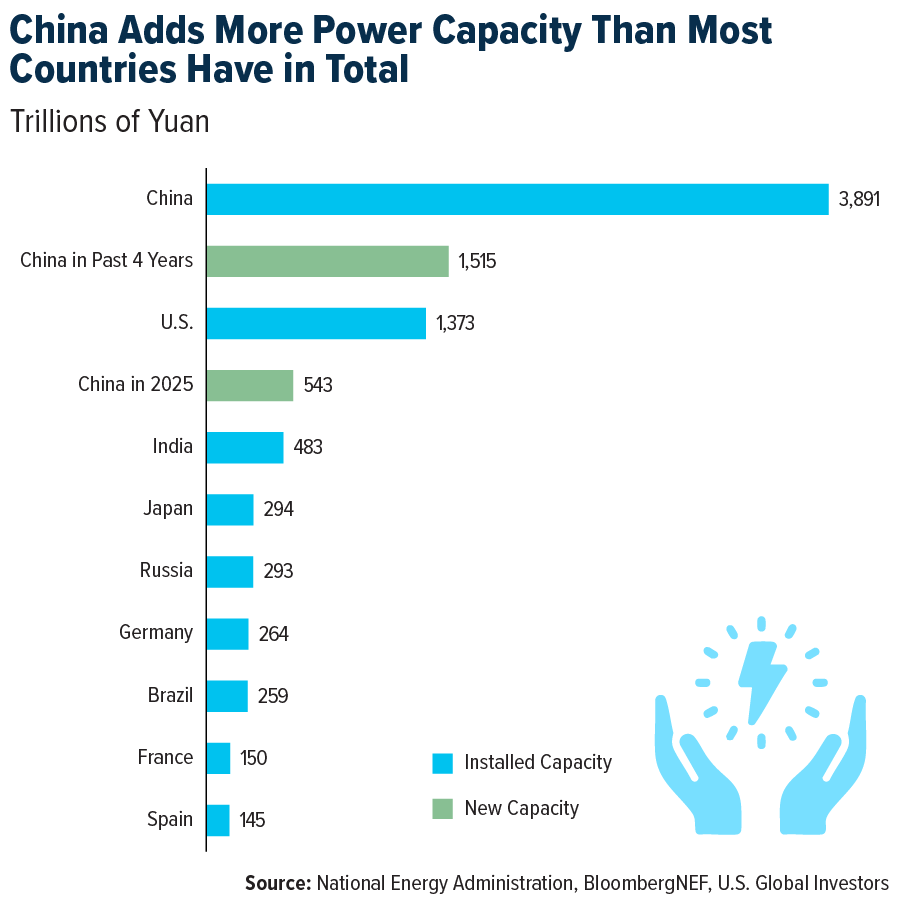
While the U.S. goes back and forth on energy policy, China has been building. Since 2021, the country has added more power capacity than the U.S. has in its entire 250-year history.
Read that again. In four years, they’ve eclipsed our entire power infrastructure.
Last year alone, China installed 543 gigawatts of new capacity, an unimaginable amount. That includes solar, wind, coal, nuclear and gas. And according to BloombergNEF, the country will add another 3.4 terawatts of new capacity over the next five years, nearly six times the amount the U.S. is forecast to add.
The goal? To ensure that China’s next-generation industries, like artificial intelligence (AI), robotics and advanced manufacturing, aren’t held back by energy shortages.
Clean Energy Is the New Growth Engine
As I’ve shared with you before, Elon Musk and NVIDIA chief Jensen Huang have both warned that China’s monumental power surplus will give it a huge advantage in AI compute.
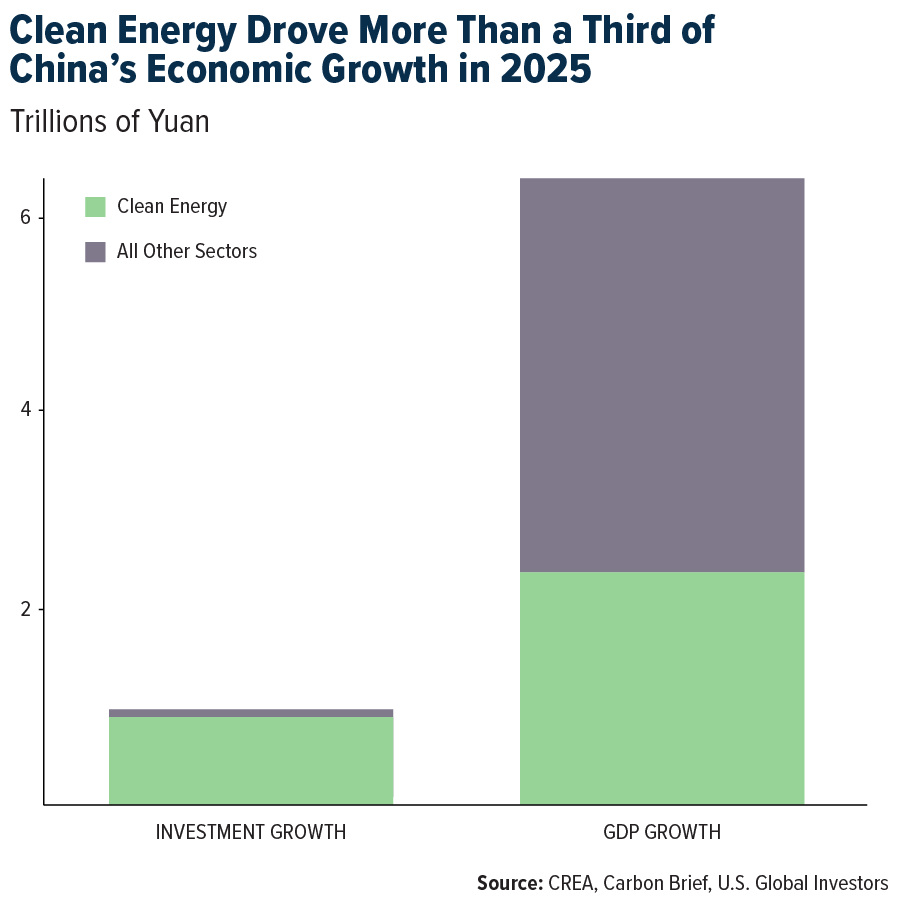
From what I’ve heard and read, I have to agree. The numbers are simply staggering. In 2025, clean energy drove over a third of China’s GDP growth, accounting for more than 90% of investment increases. Sectors like solar, electric vehicles (EVs) and battery tech contributed over $2.1 trillion to the nation’s economy, roughly equivalent to the size of Canada or Brazil’s GDP.
If China’s clean energy sector were its own country, it would be the eighth-largest economy in the world.
Meanwhile, in Washington…
Contrast that with the U.S., where political gridlock and partisanship have hampered large-scale energy buildouts. China is thinking long-term, whereas officials in the U.S. are too often thinking only about the next election.
In fact, according to a recent report by the Information Technology and Innovation Foundation (ITIF), China is on track to surpass the U.S. across a broad swath of what it calls “national power industries.”
These include military industries (guided missiles and tanks, for instance), dual-use industries (electronic displays and semiconductors) and enabling industries (automobiles and heavy construction equipment).
To its credit, the U.S. is committed to spending big on defense. Congress just passed a $839 billion bill, which is $8 billion more than the Pentagon even requested. Funds are set to flow to critical platforms like the F-35, B-21 bomber and Sentinel intercontinental ballistic missile (ICBM) systems. More than $13 billion is earmarked for space and missile defense under President Trump’s Golden Dome program.
What It Means for Investors
Equity markets may be the first to have recognized that a new investment cycle is underway.
In January, small-cap, domestically focused stocks began to take leadership. While the S&P 500 reached new highs, gaining roughly 1.4% for the month, the Russell 2000 Index surged 5.4%, significantly outperforming its large-cap peers. Small caps notched a 15-day winning streak against the S&P, the longest such stretch since May 1996.
I don’t believe this is a one-off. The Russell 2000 is now right in line with, if not slightly outperforming, the S&P 500 since the start of Trump’s second term. These companies are generally less exposed to tariffs and may benefit over the long-term in a less globalized, interdependent world.
I urge you to do your due diligence before investing, however. An estimated 40% of all Russell 2000 companies are unprofitable right now.
With precious metal prices down from their extraordinary highs, now might also be the time to consider buying the dip. I always recommend a 10% weighting in gold, split evenly between physical bullion and high-quality gold mining stocks. Remember to rebalance on a regular basis.
Want more information on how to diversify with our precious metals? Email GOLD to [email protected].
Airlines and Shipping
Strengths
- The best-performing airline stock for the week was Frontier, up 40.5%, on the back of rumors of a potential Spirit liquidation. According to Morgan Stanley, 60% of consumers are planning to travel over the next six months, an increase from 58% in the prior survey. The outlook for leisure travel remains optimistic, as the AlphaWise forecast for travel intentions continues to trend higher over time. The forecast points to travel intentions ticking up to 66% in March before reaching 69% in the spring.
- Maersk’s decision to resume its shipping service via the Suez Canal, citing “improved stability in the Red Sea,” supports Bank of America’s view of a full return of traffic through the strait in the second quarter of 2026. Red Sea transits rose 2% year-over-year (YoY) in January, though volumes remain well below pre-crisis levels.
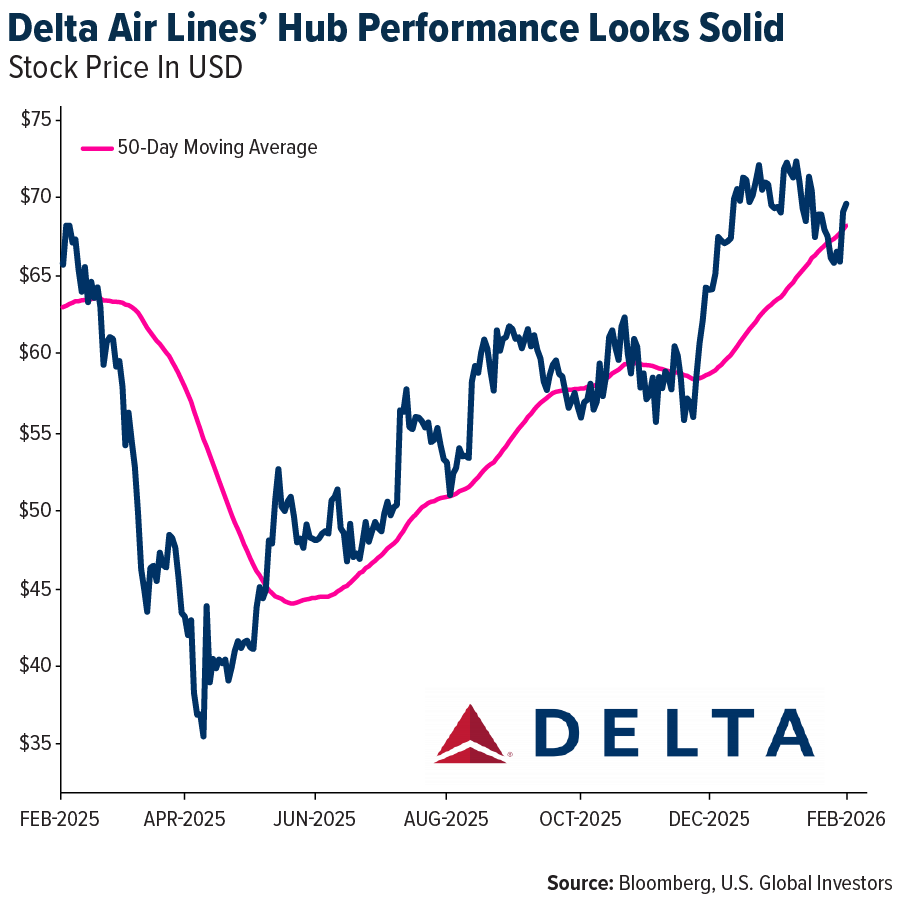
- Data at Delta’s hubs appear solid, with volumes outpacing supply at Detroit and Seattle and keeping pace with supply at Atlanta, Los Angeles, and Boston. Volumes are trailing supply at JFK, LaGuardia, and Minneapolis. TD suspects Fern is driving the weakness at the company’s Northeastern hubs.
Weaknesses
- The worst-performing airline stock for the week was Booking.com, down 10.9%. According to Morgan Stanley, American had the highest percentage of cancellations for the second week in a row, with 21.5% of scheduled flights canceled. During fourth-quarter earnings, American’s management noted that the winter storm had caused over 9,000 flight cancellations as of January 27, marking the most significant weather-related operational disruption in American’s history.
- Ocean spot rates declined in January, dropping 21%, with a smaller fall of 16% on the Europe-Asia trade lane. This reflects typical seasonality following December’s pre-Chinese New Year surge. Europe futures suggest a 34% decrease by the end of April. There are no signs of capacity discipline, as liners have not cut back capacity and charter rates remain robust, according to Bank of America.
- Thai Air management guided for 2025 operating margin to be around 21%, which sits at the low end of the guidance range, with mid-teen operating profit margin in fourth-quarter 2025. Group passenger traffic fell 4% year-over-year (YoY) in fourth-quarter 2025 due to weakness in Australian and European routes, while yield was guided to be up 7% quarter-over-quarter (QoQ), implying a mid-single-digit decline on a year-over-year (YoY) basis, according to UBS.
Opportunities
- United Airlines added 90 basis points of domestic capacity growth, according to Bank of America. United’s additions come after last week’s announcement that it would add flights to Chicago, which has increased O’Hare domestic capacity to 16% in the second quarter of 2026 from 12% last week. On the other hand, JetBlue’s growth has been cut by 180 basis points since the start of January, the largest change among carriers.
- SITC sounded cautiously optimistic about the outlook for intra-Asia fundamentals. Recently signed contracts are flattish, while the pre-Chinese New Year peak season has been slightly better than expected. Intra-Asia demand trends are expected to remain robust, while supply looks somewhat constrained given low deliveries and the aging fleet, according to Bank of America.
- For IAG, non-binding offers are due on April 2, with the winner selected over the summer. IAG is trying to push not only for an option to buy a small majority but also quasi-full control of TAP within bidding options put forward by the Portuguese Government. For now, the government is only selling 45% of capital to private airlines, with 4.9% going to employees and management, keeping 50.1% in government hands, according to Morgan Stanley.
Threats
- American Airlines and United Airlines are adding capacity in Chicago. In total, peak Chicago seat capacity is set to increase by 17% year-over-year (YoY) and 19% relative to 2019 levels among U.S. carriers. In contrast, year-to-date Chicago passenger volumes climbed 6% year-over-year (YoY) through November 2025, according to BMO.
- According to Bank of America, the global fleet is expected to expand by 4.6% in 2026, while the order book-to-fleet ratio remains at 34%, the highest since the global financial crisis. They expect container liner earnings to be negative in the fourth quarter of 2026 and for the full year 2026.
- The European Parliament has proposed changes that would allow anyone to bring a 15-pound bag alongside a laptop or rucksack bag for free. The move threatens a high-margin revenue stream for low-cost operators, according to Morgan Stanley.
Luxury Goods and International Markets
Strengths
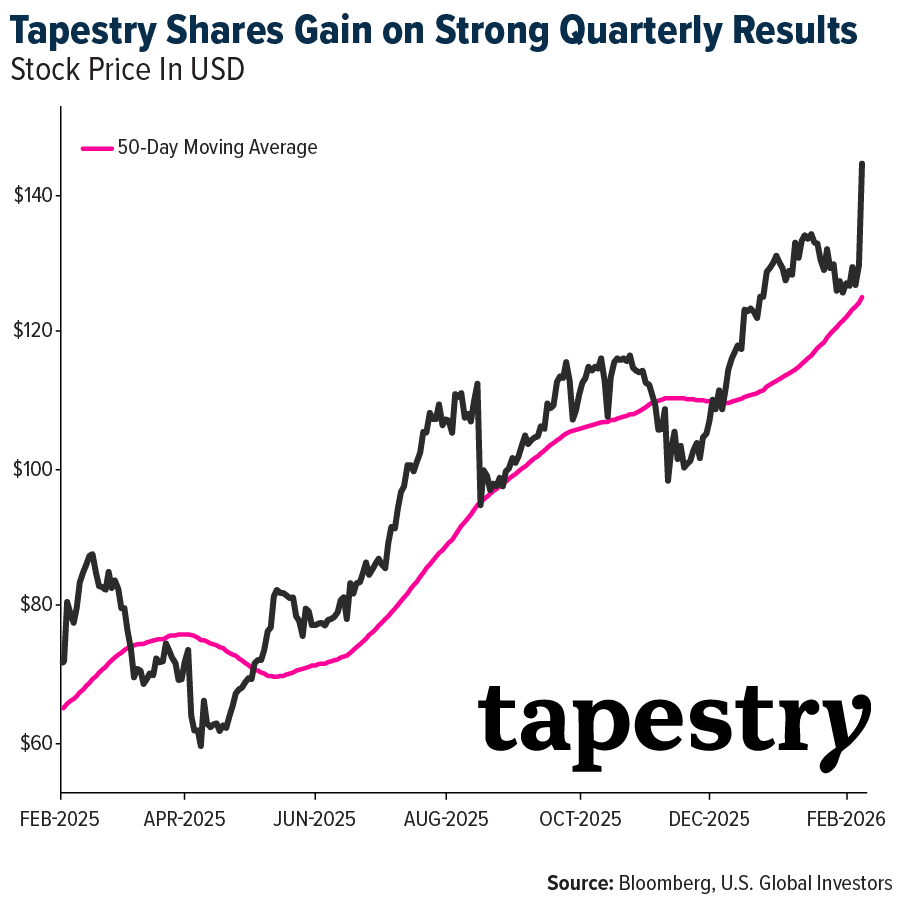
- Tapestry shares gained about 20% this week after the company reported strong quarterly results, with both revenue and earnings beating Wall Street expectations and a raised full-year outlook. The luxury fashion firm posted higher-than-expected sales and earnings per share, driven in part by robust demand for its Coach brand.
- Recent data showed that U.S. manufacturing and services PMIs came in stronger and remained above the 50 level. Readings above 50 signal expansion, suggesting that both factory activity and service-sector demand continue to grow and support overall economic momentum.
- Ermenegildo Zegna was the best-performing name in the S&P Global Luxury Index over the past five days. Shares climbed on strength in its underlying business after the company reported a solid 4.6% increase in organic fourth-quarter revenue, driven by double-digit growth in the Americas and strong direct-to-consumer sales that exceeded expectations.
Weaknesses
- Shares of Watches of Switzerland fell after the company raised its full-year sales outlook but cut margin guidance, signaling that profitability may be under pressure despite continued strong demand in key markets. Higher costs from precious metals, changes in product mix, and one-off acquisition-related charges squeezed expected profit margins, disappointing investors and prompting the stock pullback.
- Tesla shares declined this week partly due to soft sales and delivery trends, including lower U.S. vehicle registrations and slowing demand in key markets, raising concerns about near-term growth and earnings. Investor attention also shifted following Elon Musk’s announcement that SpaceX merged with xAI into a $1.25 trillion-valued private entity, fueling questions about management focus and balancing Tesla’s core auto business with broader AI initiatives.
- Estee Lauder was the worst-performing name in the S&P Global Luxury Index over the past five days. Shares dropped despite a quarterly earnings beat, with adjusted earnings per share (EPS) above expectations, as investors reacted negatively to the results and outlook.
Opportunities
- Several high-quality luxury names, including Hermès and Estée Lauder, have sold off recently amid broader sector weakness rather than company-specific fundamentals. Demand for super-luxury products and premium services remains relatively resilient, supported by high-income consumers and strong brand loyalty. This disconnect between share price performance and underlying demand creates an opportunity for a rebound as sentiment stabilizes and investors refocus on earnings quality and long-term growth.
- Luxury demand in China appears to be stabilizing after a prolonged slowdown, with early signs of improvement across select categories. While spending remains cautious, the pace of decline has moderated, suggesting the market may be nearing a bottom. As consumer confidence gradually improves, analysts see a stronger recovery increasingly likely in the second half of 2026.
- The preliminary University of Michigan Consumer Sentiment Index rose to 57.3 in February from 56.4 in January, marking a third consecutive monthly increase and the highest reading in six months. The improvement was driven largely by higher-income households with significant stock holdings, while one-year inflation expectations eased to around 3.5%.
Threats
- Retail sales in the European Union weakened in December 2025, falling 0.5% month-on-month compared with November, reversing modest gains earlier in the year. On a yearly basis, retail sales were up roughly 1.3% year-over-year, weaker than previous months and expectations, signaling softer consumer demand.
- Ralph Lauren reported earnings that beat expectations, but its shares declined as investors focused on weaker regional performance. Sales in Europe were flat year-over-year, highlighting softer demand in the region, while North America performed better, with store sales rising 7%. The contrast raised concerns about uneven growth.
- In its “So Far…” report, published by Bank of America, the broker reviewed results from five luxury names that have already reported fourth-quarter earnings, signaling that industry growth slowed by about two percentage points in the fourth quarter versus the third quarter. Jewelry remains the strongest-performing category, continuing to show solid growth, while soft luxury stays under pressure. Soft luxury refers to fashion-led, non-hard goods such as apparel, handbags, shoes, and accessories, which are more discretionary and sensitive to weaker consumer spending compared with hard luxury items like jewelry and watches.
Energy and Natural Resources
Strengths
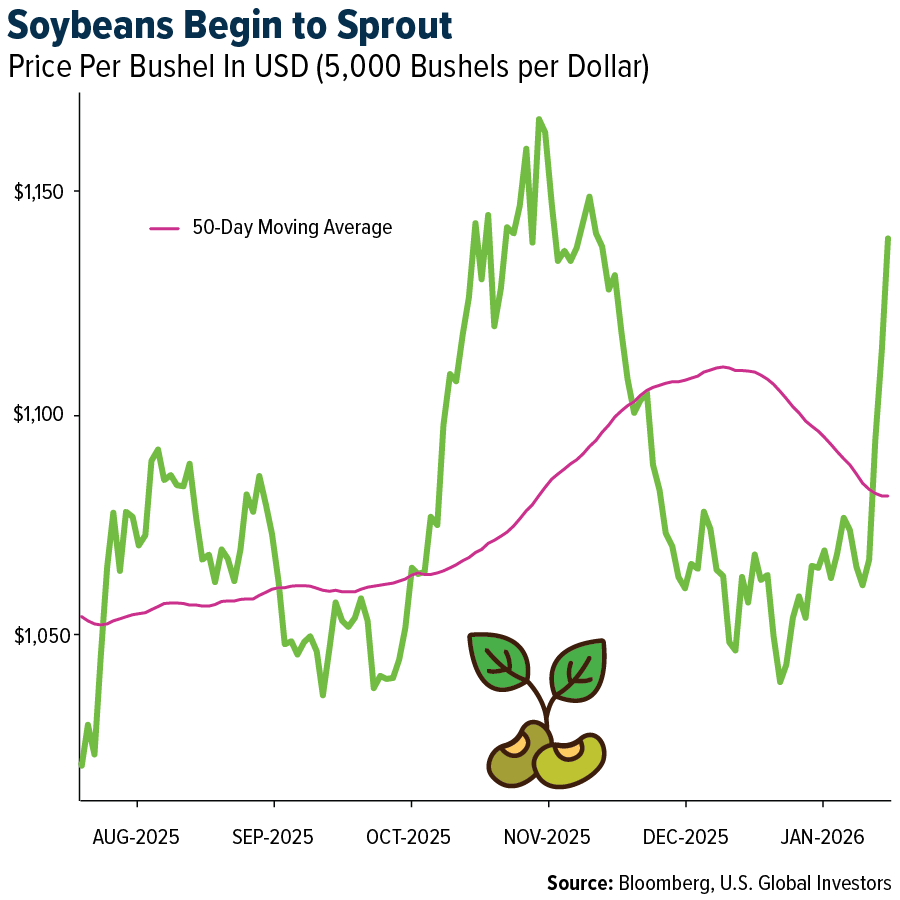
- Soybeans led commodities this week, up about 4.75%. Soybean futures extended gains after comments from Donald Trump that China is considering lifting U.S. soybean purchases to 20 million tons this season sparked heavy fund buying and record volume. Skepticism remains, however, with traders citing cheaper South American supply, lingering tariffs, and uncertainty over whether Beijing, despite talks involving Xi Jinping, will follow through without U.S. concessions.
- Indian solar manufacturers, including Saatvik Green Energy, Waaree Energies, and Premier Energies, saw sharp share gains after the new U.S.–India trade deal cut tariffs on Indian goods from 50% to 18%. The agreement restored competitiveness, reduced policy uncertainty, and revived solar module exports to the U.S. amid temporary domestic overcapacity.
- Texas’s rapid deployment of utility-scale batteries proved critical during January’s winter storm, providing up to about 9% of peak grid power and sharply reducing blackout risk compared with prior events. Bloomberg reports that this highlights battery storage as a structural strength for U.S. grid resilience amid surging AI data center and population-driven electricity demand.
Weaknesses
- Natural gas was the weakest-performing commodity of the week, declining approximately 21.9%. U.S. natural gas futures plunged 25.7% on Monday, the largest single-day drop since 1995, excluding contract rollover, driven by warmer mid-February weather forecasts that reduced heating demand, production rebounding to 111.6 billion cubic feet per day, and broader commodity and algorithm-driven selling pressure.
- Uranium equities weakened alongside broader risk-off flows, as selling pressure in AI-linked stocks spilled into the nuclear value chain and challenged the near-term narrative linking data center buildouts to uranium demand. The pullback highlights how sentiment-driven uranium trades remain vulnerable to macro and technology-sector volatility, even as long-term fundamentals around energy security and nuclear capacity expansion remain intact.
- China’s brief futures-led copper price spike reopened import arbitrage, drawing additional cargoes into an already oversupplied physical market and pushing Shanghai Futures Exchange inventories to multi-year seasonal highs. Reuters writes that this move exposed near-term fragility in spot premiums and the sustainability of the rally.
Opportunities
- The Trump administration launched a $12 billion critical minerals stockpile initiative combining public and private capital to protect U.S. manufacturers from supply shocks and reduce reliance on China-dominated supply chains. The program creates a demand backstop that could accelerate domestic mining and processing while supporting long-term prices.
- Elon Musk recently stated that the potential for solar energy is undervalued. The U.S. currently produces three gigawatts of solar cells per year, but Tesla aims to reach 100 gigawatts annually to meet growing power needs on Earth and in space. Producing one gigawatt of solar panels requires about 15 tons, or 482,000 ounces, of silver, implying that 100 gigawatts would require roughly 48.2 million ounces of new silver supply and support strong demand for the metal.
- U.S.-backed Orion CMC is positioned to acquire stakes in Glencore’s copper-cobalt assets in the Democratic Republic of the Congo. The move would help seed an American-led platform to consolidate critical mineral assets across Africa’s Copperbelt and counter China’s regional dominance through coordinated government and private-sector expertise.
Threats
- China continues to significantly outbuild the United States in power generation capacity, adding more in recent years than the United States has historically. This creates a potential structural energy advantage in the global AI race and raises the risk of electricity bottlenecks for U.S. data centers, as highlighted by Elon Musk and Jensen Huang.
- Persistent soft Asian spot LNG demand is forcing unusual cargo diversions from Canada’s west coast to Atlantic markets, signaling weaker near-term pricing power and utilization risks for new Pacific Basin supply amid disappointing seasonal uptake, Bloomberg reports.
- Linde reported weaker-than-expected fourth-quarter 2025 operating profit and free cash flow, triggering an approximately 3% share price decline despite modest sales and earnings per share beats. The result serves as a warning signal for traditional oil and gas companies, given Linde’s heavy exposure to energy end markets through hydrogen supply for refining, natural gas processing, carbon dioxide and nitrogen for enhanced oil recovery, and petrochemical feedstocks.
Bitcoin and Digital Assets
Strengths
- Tether bought a $150 million stake in Gold.com, a digital precious-metals platform, to expand tokenized gold distribution. By acquiring a 12% stake and integrating its gold-backed token XAUT, Tether strengthens its position in a segment where XAUT accounts for over 60% of the $5.5 billion tokenized gold market. The partnership also allows users to buy physical gold using USDT and USAT, linking digital dollars directly to real bullion.
- Y Combinator is now allowing startups to receive funding in stablecoins, validating them as reliable, institutional-grade financial infrastructure. By offering USDC payouts across major blockchains to all YC-backed startups, not just crypto-native firms, YC reduces friction for cross-border founders. Transfers settle in under one second at near-zero cost, embedding stablecoins into the startup funding lifecycle.
- Sovcombank, a major private Russian bank, has launched Bitcoin-backed loans for corporate clients, increasing Bitcoin’s role as accepted financial collateral. Loans have maturities of up to two years, priced at the central bank’s key rate plus 7 percentage points, with a 50% collateral haircut to manage volatility. This allows companies to access liquidity without selling Bitcoin, signaling growing institutional confidence and integration of digital assets into regulated credit markets.
Weaknesses
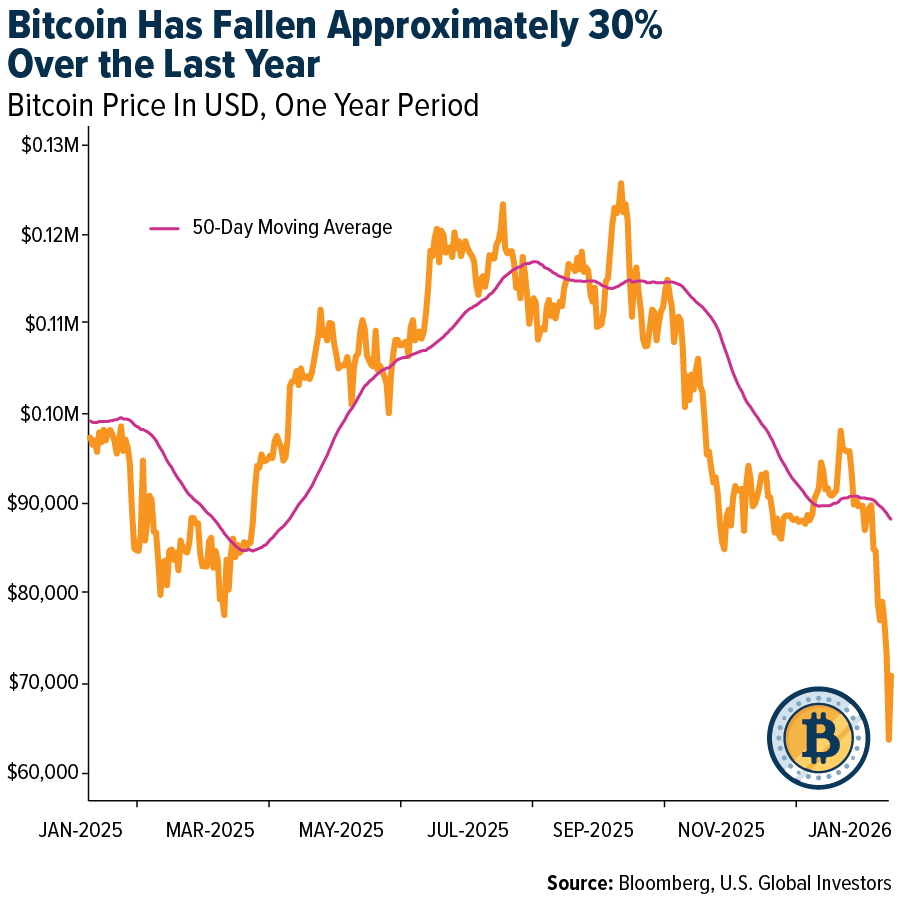
- Spot Bitcoin ETFs show that institutional demand remains highly sensitive to short-term market stress rather than long-term conviction. Over two consecutive days, investors withdrew $816.9 million from U.S. spot Bitcoin ETFs, including $544.9 million in a single session, as Bitcoin briefly fell below $71,000, its lowest level since October 2024. Despite $54.75 billion in net inflows since launch, these sharp outflows highlight that ETF investors de-risk quickly during macro uncertainty.
- Bitcoin is facing sharp loss of demand and forced deleveraging, amplifying downside pressure across the market. The price fell below $70,000, about 45% below its October peak, while more than $1 billion in crypto futures positions were liquidated in 24 hours. U.S. spot Bitcoin ETFs have seen roughly $2 billion in outflows over the past month and over $5 billion in the last three months, removing key institutional support and leaving Bitcoin vulnerable to wider risk-off moves.
- Gemini, a U.S.-based cryptocurrency exchange founded by the Winklevoss twins, is pulling back from the U.K., EU, and Australia while cutting 25% of its workforce, highlighting strain in the global crypto exchange model. Exiting major international markets and placing accounts into withdrawal-only mode signals that revenues outside the U.S. are insufficient to cover rising regulatory and operating costs. For investors, this retrenchment points to weaker growth prospects, reduced geographic diversification, and lower trading volumes, reinforcing concerns that core exchange businesses are struggling to scale profitably in the current risk-off environment.
Opportunities
- Spanish lender BBVA has joined an EU banks’ stablecoin venture to challenge digital dollars, creating an opportunity for a regulated, euro-based on-chain payment alternative. With BBVA’s $800 billion in assets and participation from around a dozen major EU banks, including BNP Paribas, ING, and UniCredit, the initiative targets a market gap: of the $300 billion global stablecoin market, only about $860 million is euro-denominated. If approved under MiCA and launched in the second half of 2026, the Qivalis stablecoin could support euro-based blockchain payments, reduce reliance on USDT and USDC, and strengthen Europe’s financial sovereignty in digital finance.
- Solana’s evolution toward stablecoin micropayments creates a long-term growth opportunity beyond speculative trading. Its ultra-low fees, often below one cent, make it a preferred network for high-frequency, low-value stablecoin transactions, a segment where Ethereum struggles due to higher costs. Platforms like Coinbase’s x402, where the average payment is just $0.06, show real-world adoption potential, supporting Solana’s role as core payments infrastructure despite near-term price weakness.
- Tether’s open-source MiningOS is expanding its role from stablecoin issuer into core Bitcoin mining infrastructure, addressing a market where software costs and vendor lock-in impact profitability. Global Bitcoin mining energy and infrastructure spending exceeds $20–25 billion annually, and open-source alternatives can significantly reduce operating costs for smaller and mid-size miners. By removing licensing fees and proprietary dependencies, MiningOS could drive broad adoption and give Tether strategic influence across mining operations without heavy capital investment.
Threats
- Coinbase, the largest U.S.-based crypto exchange, faces pressure from weak markets and regulatory delays. Citi cut its price target from $505 to $400 after the stock fell 65% from its peak, citing lower trading volumes and softer institutional activity. Q4 2025 revenue is now forecast at $1.69 billion with a GAAP loss of $2.64 per share, highlighting how risk-off sentiment and regulatory gridlock can erode earnings.
- Sen. Mark Warner says he’s in “crypto hell” as Congress stalls on the market structure bill. Regulatory uncertainty leaves firms unclear on SEC vs. CFTC oversight, stablecoin rules, and DeFi compliance, raising costs and delaying launches. The need for bipartisan support and 60 Senate votes means delays could stretch into the election cycle.
- As corporate Bitcoin adoption matures, passive “buy-and-hold” strategies face scrutiny. Over 170 public companies hold Bitcoin, but most generate no yield, tying up capital. With regulated Bitcoin-backed yield infrastructure emerging, investors are increasingly valuing active management over static holdings, making unproductive positions a potential drag on valuation.
Defense and Cybersecurity
Strengths
- Palantir delivered a breakout quarter, with revenue soaring 70% to $1.41 billion as U.S. commercial sales grew 137% and government revenue climbed 66%. Riding this momentum, the company raised its outlook for 2026, signaling confidence after record profitability and contract wins.
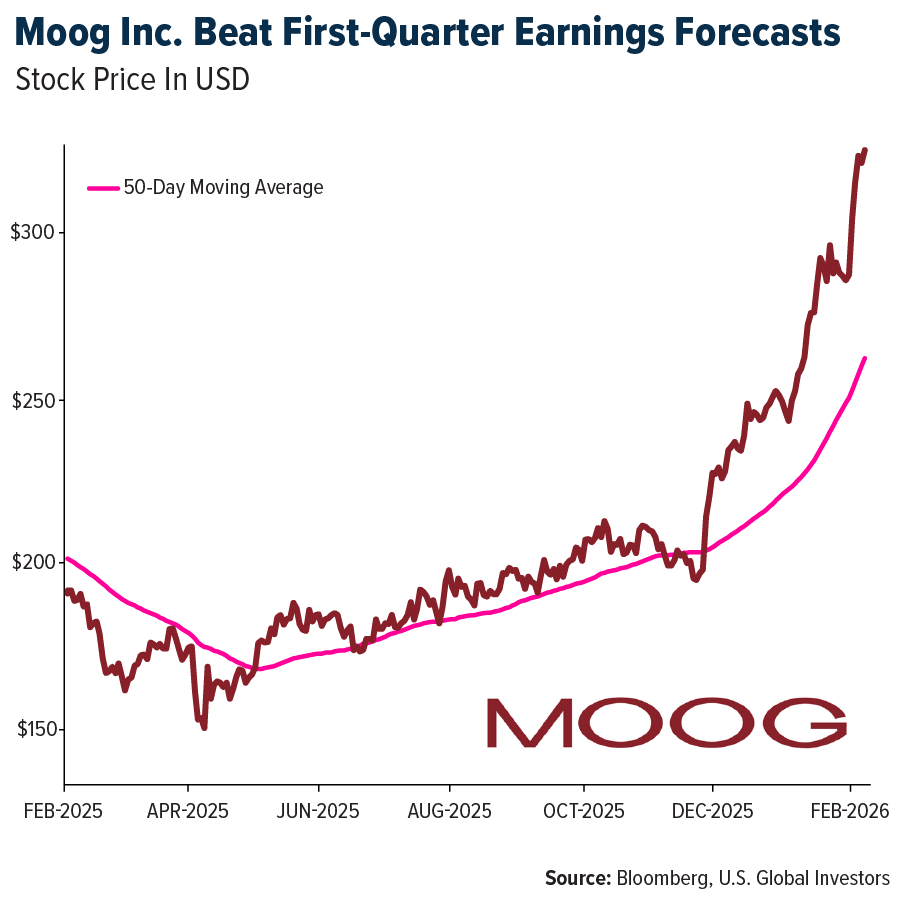
- Moog reported first-quarter earnings per share of $2.63 (EPS) versus $2.24 expected and $1.1 billion in revenue, beating forecasts. The company also issued full-year guidance of $4.3 billion in revenue and $10.20 EPS. This momentum follows a record fiscal year 2025, where fourth-quarter sales hit $1.05 billion, up 14% year-over-year (YoY), and the company guided fiscal year 2026 to $4.2 billion in revenue and $10 EPS, signaling continued strength despite tariff pressures.
- The best-performing stock in the XAR ETF for the week was Woodward Inc., rising 22.23% after reporting a stronger-than-expected first quarter for fiscal 2026. The company posted 29% sales growth, 54% higher net earnings, and broad strength across aerospace and industrial segments, while raising full-year sales and earnings per share (EPS) guidance as demand, margins, and execution continued to improve.
Weaknesses
- Iran has explicitly rejected U.S. demands to halt its uranium enrichment, telling negotiators in Oman that it “will never accept” stopping the program, a stance that deepens geopolitical instability and undermines global nonproliferation efforts even as diplomatic talks continue.
- Amazon’s plan to invest $200 billion in AI infrastructure triggered investor concerns and a drop in its share price this week, highlighting market skepticism about the company’s ability to sustain such massive capital outlays without pressuring margins.
- The weakest stock in the XAR ETF for the week was Redwire Corp., declining 14.55% after insiders, including AE Red Holdings and Michael Robert Greene, disclosed large open-market stock sales totaling about 3.37 million shares worth $37.7 million.
Opportunities
- Cathie Wood’s ARK Invest increased its stake in AMD, buying roughly 141,000 shares as part of a strategic move during a downturn in U.S. technology stocks.
- Tesla has decided to discontinue its Model S and Model X programs to reallocate Fremont factory capacity to Optimus robot production, raising concerns about the shift from legacy premium vehicles and the execution risk of scaling a new robotics business toward one million units per year.
- Driven by persistent AI and data center demand worsening global supply shortages, TrendForce projects first-quarter 2026 memory prices to hit record highs, with conventional DRAM rising 90 to 95% and NAND Flash increasing 55 to 60% quarter-over-quarter.
Threats
- Myanmar and Russia have formalized a five-year defense pact that deepens their long-standing military cooperation, reinforcing the junta’s Russia-backed war effort and signaling continued alignment between two internationally isolated states.
- Zscaler researchers have identified Russian state-sponsored hackers exploiting a newly patched Microsoft Office vulnerability, with attacks expected to increase due to slow patching. Meanwhile, state attorneys general are investigating potential political interference in the DOJ’s approval of Hewlett Packard Enterprise’s acquisition of Juniper Networks, complicating the merger’s integration.
- Researchers found that CISA quietly changed the ransomware use status of 59 vulnerabilities, mostly affecting Microsoft, Ivanti, Fortinet, Palo Alto Networks, and Zimbra, without notifying defenders. This has prompted warnings that these stealth updates materially shift organizational risk while remaining easy to miss.
Gold Market
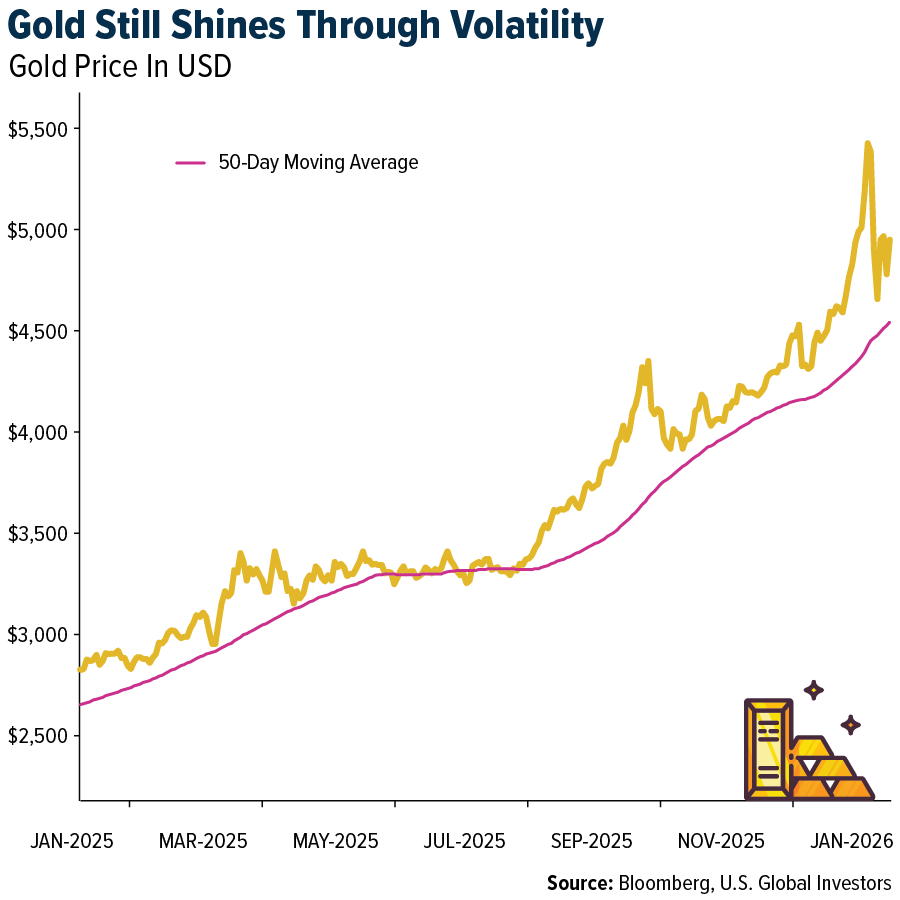
This week gold futures closed the week at $4,980.80, up $235.70 per ounce, or 4.97%. Gold stocks, as measured by the NYSE Arca Gold Miners Index, ended the week higher by 0.78%. The S&P/TSX Venture Index came in off 3.27%. The U.S. Trade-Weighted Dollar rose 0.64%.
Strengths
- Gold was the best-performing precious metal of the week, up 4.97%. Prices rebounded sharply from late-week weakness, briefly reaching $4,950 before ending higher despite a CME margin hike that raised COMEX gold futures margins to 9%, underscoring resilient investment demand.
- Scotiabank analysts say the core silver bull case remains intact despite recent volatility, supported by strong industrial demand and limited high-quality mine supply. Solar remains a key structural driver, with Tesla’s 100-gigawatt U.S. solar manufacturing target potentially adding significant incremental silver demand.
- JP Morgan expects central banks to purchase 800 tons of gold in 2026 and remains encouraged by renewed buying from Brazil in late 2025, its first since 2021. Brazil added 43 tons between September and November but still holds only about 7% of reserves in gold, while Poland, which bought roughly 100 tons in 2025, is now targeting total gold reserves of 700 tons.
Weaknesses
- Silver was the worst-performing precious metal of the week, down 1.67%. Prices remain under pressure as volatility and tighter trading conditions weigh on speculative demand, although CME Group’s shift to percentage-based margins has modestly eased relative margin pressure as prices fall.
- Danish jeweler Pandora A/S plans to shift roughly half of its production from silver to platinum-plated jewelry as rising silver prices pressure margins. Given Pandora’s annual purchase of more than 300 tons of silver, the move could reduce silver demand by around 150 tons, though that supply could be absorbed by solar demand.
- Gold’s recent 14% correction already exceeds the median 8% pullback seen during bull markets over the past 50 years. According to RBC, a more severe two- or three-standard-deviation correction would imply downside of roughly 18%, or $4,441 per ounce, and 22%, or $4,208 per ounce, respectively.
Opportunities
- Eldorado Gold Corporation and Foran Mining Corporation announced a definitive agreement under which Eldorado will acquire all outstanding Foran shares in a cash-and-stock deal valued at C$3.8 billion. Eldorado said the transaction will drive growth, increase copper exposure, improve jurisdictional balance through Canada, and support a valuation re-rating, although its shares fell nearly 9% on the week, potentially creating a buying opportunity.
- Alamos Gold shares rose 8% for the week following the release of its Island Gold District Expansion Study. The update lifts long-term throughput to 20,000 tons per day from 12,400 tons per day starting in 2028 and increases reserves by 30% to 8.28 million ounces, supporting a net asset value of $12.2 billion at a $4,500 per ounce gold price assumption.
- Barrick Mining Corp. plans to spin off its top North American gold assets through an initial public offering as part of a strategic reset. The company expects to sell a minority stake in the new unit, complete the IPO by late 2026, and has appointed interim chief Mark Hill as chief executive officer, according to Bloomberg.
Threats
- In silver, since about $80 per ounce in late December, the drivers of the continued rally have become harder to pinpoint, leaving JP Morgan more cautious. Without central banks acting as structural dip buyers, as they do in gold, the bank remains concerned about the risk of a deeper near-term shakeout in silver relative to gold.
- Gold has had a highly volatile start to the year, rising rapidly from $4,350 per ounce in January to $5,600 per ounce, up 30%, before falling back to around $4,600 per ounce in recent days. Goldman’s commodities team attributes the initial sell-off partly to liquidity factors and remains constructive on gold.
- The recent sell-off following speculation that Kevin Warsh could lead the Federal Reserve highlights policy uncertainty, with Bank of America noting that changes in rate expectations or perceptions of Fed independence could reduce support for gold.
U.S. Global Investors, Inc. is an investment adviser registered with the Securities and Exchange Commission (“SEC”). This does not mean that we are sponsored, recommended, or approved by the SEC, or that our abilities or qualifications in any respect have been passed upon by the SEC or any officer of the SEC.
This commentary should not be considered a solicitation or offering of any investment product. Certain materials in this commentary may contain dated information. The information provided was current at the time of publication. Some links above may be directed to third-party websites. U.S. Global Investors does not endorse all information supplied by these websites and is not responsible for their content. All opinions expressed and data provided are subject to change without notice. Some of these opinions may not be appropriate to every investor.
Holdings may change daily. Holdings are reported as of the most recent quarter-end. The following securities mentioned in the article were held by one or more accounts managed by U.S. Global Investors as of (12/31/2025):
Tesla
Orion CMC
Delta Airlines
JetBlue
United
American
AP Moeller Maersk
Glencore PLC
Tapestry
Estee Lauder
Hermes
Ralph Lauren
Eldorado Gold Corp.
Alamos Gold
Barrick Mining
*The above-mentioned indices are not total returns. These returns reflect simple appreciation only and do not reflect dividend reinvestment.
The Dow Jones Industrial Average is a price-weighted average of 30 blue chip stocks that are generally leaders in their industry. The S&P 500 Stock Index is a widely recognized capitalization-weighted index of 500 common stock prices in U.S. companies. The Nasdaq Composite Index is a capitalization-weighted index of all Nasdaq National Market and SmallCap stocks. The Russell 2000 Index® is a U.S. equity index measuring the performance of the 2,000 smallest companies in the Russell 3000®, a widely recognized small-cap index.
The Hang Seng Composite Index is a market capitalization-weighted index that comprises the top 200 companies listed on Stock Exchange of Hong Kong, based on average market cap for the 12 months. The Taiwan Stock Exchange Index is a capitalization-weighted index of all listed common shares traded on the Taiwan Stock Exchange. The Korea Stock Price Index is a capitalization-weighted index of all common shares and preferred shares on the Korean Stock Exchanges.
The Philadelphia Stock Exchange Gold and Silver Index (XAU) is a capitalization-weighted index that includes the leading companies involved in the mining of gold and silver. The U.S. Trade Weighted Dollar Index provides a general indication of the international value of the U.S. dollar. The S&P/TSX Canadian Gold Capped Sector Index is a modified capitalization-weighted index, whose equity weights are capped 25 percent and index constituents are derived from a subset stock pool of S&P/TSX Composite Index stocks. The NYSE Arca Gold Miners Index is a modified market capitalization weighted index comprised of publicly traded companies involved primarily in the mining for gold and silver. The S&P/TSX Venture Composite Index is a broad market indicator for the Canadian venture capital market. The index is market capitalization weighted and, at its inception, included 531 companies. A quarterly revision process is used to remove companies that comprise less than 0.05% of the weight of the index, and add companies whose weight, when included, will be greater than 0.05% of the index.
The S&P 500 Energy Index is a capitalization-weighted index that tracks the companies in the energy sector as a subset of the S&P 500. The S&P 500 Materials Index is a capitalization-weighted index that tracks the companies in the material sector as a subset of the S&P 500. The S&P 500 Financials Index is a capitalization-weighted index. The index was developed with a base level of 10 for the 1941-43 base period. The S&P 500 Industrials Index is a Materials Index is a capitalization-weighted index that tracks the companies in the industrial sector as a subset of the S&P 500. The S&P 500 Consumer Discretionary Index is a capitalization-weighted index that tracks the companies in the consumer discretionary sector as a subset of the S&P 500. The S&P 500 Information Technology Index is a capitalization-weighted index that tracks the companies in the information technology sector as a subset of the S&P 500. The S&P 500 Consumer Staples Index is a Materials Index is a capitalization-weighted index that tracks the companies in the consumer staples sector as a subset of the S&P 500. The S&P 500 Utilities Index is a capitalization-weighted index that tracks the companies in the utilities sector as a subset of the S&P 500. The S&P 500 Healthcare Index is a capitalization-weighted index that tracks the companies in the healthcare sector as a subset of the S&P 500. The S&P 500 Telecom Index is a Materials Index is a capitalization-weighted index that tracks the companies in the telecom sector as a subset of the S&P 500.
The Consumer Price Index (CPI) is one of the most widely recognized price measures for tracking the price of a market basket of goods and services purchased by individuals. The weights of components are based on consumer spending patterns. The Purchasing Manager’s Index is an indicator of the economic health of the manufacturing sector. The PMI index is based on five major indicators: new orders, inventory levels, production, supplier deliveries and the employment environment. Gross domestic product (GDP) is the monetary value of all the finished goods and services produced within a country’s borders in a specific time period, though GDP is usually calculated on an annual basis. It includes all private and public consumption, government outlays, investments and exports less imports that occur within a defined territory.
The S&P Global Luxury Index is comprised of 80 of the largest publicly traded companies engaged in the production or distribution of luxury goods or the provision of luxury services that meet specific investibility requirements.
The Russell 2000 is a stock market index that tracks the value of approximately 2,000 U.S. stocks with a small market capitalization.
A message from Advisor Perspectives and VettaFi: Discover something new! Click here to register for our upcoming webcasts.
Membership required
Membership is now required to use this feature. To learn more:
View Membership BenefitsSponsored Content
Upcoming Virtual Events View All


