These Mining Stocks Have Rallied the Most from High Gold Prices
As someone who’s been involved in capital markets his entire adult life, I can safely say that gold investors haven’t seen a period like this in decades. The third quarter of 2025 was nothing short of historic, and in many ways, I believe we’re witnessing the beginning of a new era for the yellow metal.
According to the World Gold Council (WGC), global demand reached 1,313 metric tons in Q3, the highest quarterly figure ever recorded. In dollar terms, the world spent $146 billion on gold, another record, while the metal broke 13 new all-time highs during the quarter alone. Prices averaged $3,456 an ounce, up 40% from a year earlier.
And then came October. Gold blasted through $4,400 for the first time ever before cooling off. Even after a normal, expected pullback, the metal continues to trade above $4,100.
The Love Trade and Fear Trade Working in Tandem
The gold drivers in Q3 included all the usual suspects. Central banks continued to diversify away from the U.S. dollar, adding another 220 metric tons. This brought total buying in 2025 so far to 634 tons, far above what we saw in the decade before the pandemic, according to the WGC.
Investors also poured into gold ETFs at the fastest pace since 2020. Meanwhile, demand for bars and coins stayed above the 300-ton mark for the fourth straight quarter, something we haven’t seen in over 12 years.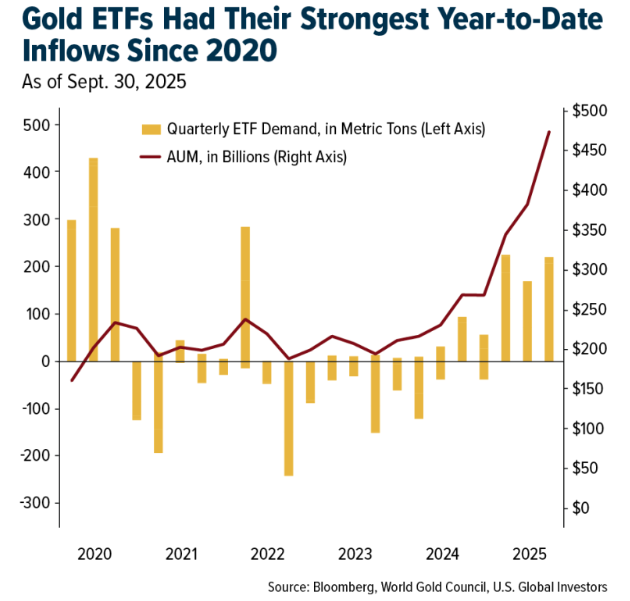
If you need another reason, the Federal Reserve is expected to continue cutting rates, though a December rate cut is now being called into question. Long-term real yields are softening, historically a tailwind for gold. The Love Trade and Fear Trade are working in tandem.
Our Best Performing Gold Mining Stocks
Against this backdrop, gold mining stocks have surged. As part of our investment process, we always examine which names are outperforming gold itself, both quarter-over-quarter (QoQ) and year-over-year (YoY). I wanted to share several of the names, which we hold in at least one of our metals and mining funds. All data is as of September 30 and priced in local currency, mostly the Canadian dollar.
Barrick Gold (LEAPS Calls)
+207% in Q3
Let’s start with the standout in the QoQ category. Barrick Gold, which we have exposure to through long-dated January 2027 call options, was up an impressive 207% in Q3.
Barrick, which is considering a move from Toronto to the U.S., has been a textbook turnaround story. After years of lagging peers, the company has sharpened its focus, sold off non-core assets and made free cash flow growth and balance sheet strength top priorities.
When you combine a disciplined senior producer with gold above $4,000 an ounce, you get powerful margin expansion. And because we held Barrick through LEAP options rather than common shares, the torque to rising gold prices was magnified. The strategy paid off handsomely.
McFarlane Lake Mining
+341% in Q3
Another strong performer this year has been McFarlane Lake Mining, up 341% in Q3. McFarlane, also based in Toronto, focuses on the Juby Gold Project in Ontario’s Abitibi Greenstone Belt, a region that’s produced more than 200 million ounces of gold over the past century.
After acquiring Juby from Aris Mining in September, McFarlane updated its mineral estimate to roughly 1 million ounces; the surrounding land package, which includes the McMillan property, offers meaningful exploration potential.
McFarlane’s leadership team has decades of mine-building experience in Ontario, and they’ve earned credibility within the investment community by moving quickly on permitting and geological work. As gold prices have climbed, investors have rewarded junior explorers with scale and momentum, and McFarlane was one of the clearest beneficiaries.
Omai Gold Mines
+650% for 12-Month Period
Let’s turn to names that dominated on a YoY basis. The single biggest mover in our portfolio over the past 12 months was Omai Gold Mines, which climbed an extraordinary 650% through the end of September. The Toronto-based company operates the historic Omai Mine in Guyana, one of the most prolific gold regions in South America.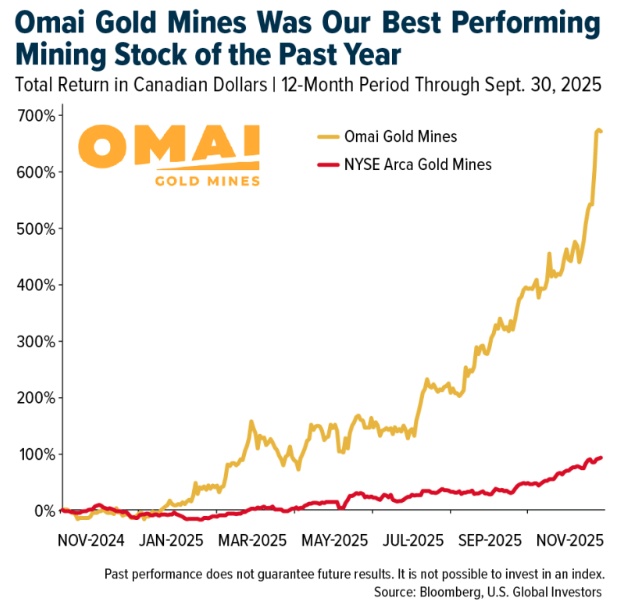
Investors love brownfield opportunities with proven geology and existing infrastructure, and Omai has delivered exactly that. In an August report, the company reported 2.1 million ounces Indicated and 4.4 million ounces Inferred across its Wenot open-pit system and the deeper, high-grade Gilt Creek, both in Guyana.
An earlier economic study of Wenot, released in April 2024, estimated a net present value (NPV) of more than half a billion dollars at $1,950 gold. At today’s (much) higher gold price, the project’s valuation has undoubtedly soared.
Others
Other names in the gold mining sector that also delivered exceptional performance in Q3 included Andean Precious Metals, Vault Minerals and Felix Gold.
Andean, up 183% in Q3, reported the best financial results in its history, with record revenue, record earnings and a record cash position. Vault Minerals, up 59%, saw its own record quarter, with more than 92,000 ounces produced, $703 million in cash and bullion and no debt. Australia-based Felix Gold, up an incredible 351% in the third quarter, continued to advance its gold-and-antimony discovery in Alaska’s Fairbanks district, positioning itself not just as a precious metal explorer but also as part of the U.S.’s emerging domestic supply chain for critical minerals.
Preparing for the Next Leg Higher
Looking ahead, I believe the setup for Q4 remains constructive. Gold has already had a phenomenal year, rising 66% year-to-date at its high on October 20, but the forces at work this cycle remain. Fiscal deficits are widening. Geopolitical tensions are rising. Central banks are diversifying away from the greenback.
At the same time, the supply side of the gold mining industry isn’t expanding fast enough to keep up with demand. Major discoveries are rare, and average mine lead times are long, averaging 15 years between discovery and production.
Some analysts, at JPMorgan and elsewhere, now see gold reaching $5,000 as soon as next year if real yields fall further and political risks increase. I believe we could see $7,000 gold by the end of President Trump’s second term as the amount of debt around the globe continues to accelerate.
As always, I recommend a 10% weighting in gold, with 5% in physical bullion and 5% in high-quality gold mining stocks, mutual funds and/or ETFs. Remember to rebalance at least once a year.
If you’d like to learn more about gold equities, just email [email protected] with the subject line GOLD STOCKS. Someone from our team will be happy to send you more information.
Index Summary
- The major market indices finished mixed this week. The Dow Jones Industrial Average gained 0.34%. The S&P 500 Stock Index rose 0.11%, while the Nasdaq Composite fell 0.45%. The Russell 2000 small capitalization index lost 1.83% this week.
- The Hang Seng Composite gained 1.26% this week; while Taiwan was down 0.92% and the KOSPI rose 1.46%.
- The 10-year Treasury bond yield rose 5 basis points to 4.15%.
Airlines and Shipping
Strengths
- The best-performing airline stock for the week was Bombardier, up 10.8%. Bank of America views ANA’s ¥150 billion share buyback announcement favorably in both size and timing. Their pro forma analysis indicates the buyback could be roughly 5–7% accretive to earnings per share for the fiscal year ending March 2027 and could raise return on equity for the same period by about 100 basis points.
- The average speed of crude-laden Very Large Crude Carriers (VLCCs) declined notably in October, which can indicate that sellers are having difficulty placing cargoes. However, this trend has already reversed in November, and VLCCs have returned to seasonally high speeds, according to Morgan Stanley.
- Boeing reported 53 commercial aircraft deliveries in October, bringing year-to-date growth to 62%. Of the 53 deliveries, Boeing delivered 39 737 MAX aircraft, one 737 Next Generation, four 767s, two 777s, and seven 787s. RBC believes the results are positive, noting that deliveries were only two aircraft lower than September’s total of 55.
Weaknesses
- The worst-performing airline stock for the week was Sabre, down 9.6%. The impact of the government shutdown on air travel has increased significantly over the past few days following the FAA’s order last Thursday to reduce flight operations. Sunday saw the highest percentage of cancellations (11%) and delays (38%) since the shutdown began, according to Bank of America.
- UPS and FedEx both announced they are grounding their fleets of MD-11 freighters. This aircraft type provides a meaningful share of long-haul, wide-body capacity for both carriers. MD-11s account for 9.3% of UPS’s mainline jet fleet and 8.8% of FedEx’s, according to UBS.
- According to JPMorgan, airlines with larger numbers of small aircraft experience less passenger disruption during operational challenges. In contrast, single-fleet operators such as Southwest have limited flexibility and therefore disrupt a higher percentage of passengers across their system.
Opportunities
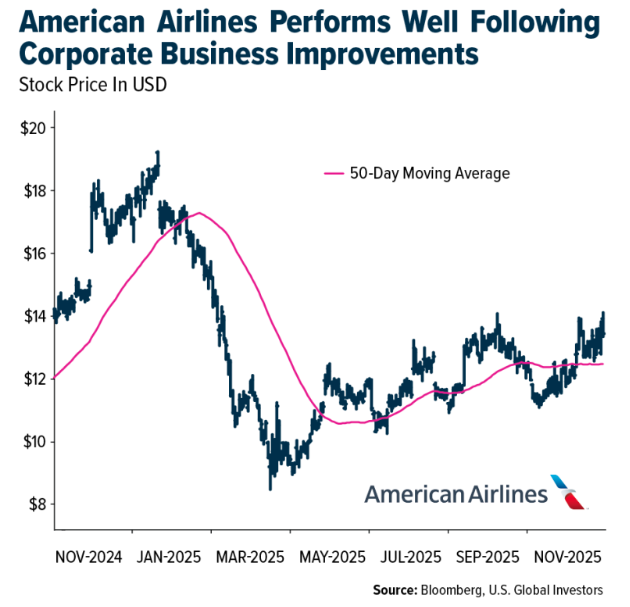
- U.S. legacy carriers remain the preferred airlines for corporate travel, with a slight preference for Delta Air Lines. Consistent with Morgan Stanley’s prior surveys, Delta, United Airlines, and American Airlines are the top carriers currently used for corporate travel at 91%, 88%, and 88%, respectively. Most notably, American Airlines is now tied with United for preference, indicating that management’s efforts since last June to restore corporate revenue share by year-end are showing results.
- According to UBS, China Merchants Port reported a 3.8% year-over-year increase in container volume for the first nine months of 2024, with domestic volume rising 3.6% and overseas volume rising 4.4%. Management has guided to overall volume growth of 1–2% year-over-year in 2025, with overseas ports (3–4%) expected to outperform domestic ports (1–2%).
- According to Morgan Stanley, about 10% of survey respondents are becoming more liberal in their use of private jets, up from 4% in the April 2025 survey and 2% in the October 2024 survey. Meanwhile, 5% of respondents expect a reduction in private jet usage, unchanged from April 2025 and down from 9% in October 2024.
Threats
- The Wall Street Journal reports that Visa and Mastercard are close to a deal with merchants to resolve a 20-year legal dispute that would allow merchants to reject certain credit cards, such as rewards cards that typically carry higher interchange fees. As the article notes, while some retailers may choose to turn away reward cards, they could risk lower sales as a result.
- This week loaded vessels traveling from China to the United States declined for the fourth consecutive week, down 10% week-over-week and 35% year-over-year. According to Goldman, data suggests November could weaken further later in the month, following generally soft readings in August, September, and October and continuing the downward trend after the initial post-surge slowdown in China.
- According to Raymond James, Spirit ended the third quarter of 2025 with $250 million in unrestricted cash, after which it drew $250 million in debtor-in-possession (DIP) financing as of November 7 and received $150 million from AerCap on October 27. Daily cash used in operations increased from $2.6 million in the first and second quarters of 2025 to $4.4 million in the third quarter, and to $3.1 million after August 20. As of October 6, Spirit reached its gross credit-card holdback target.
Luxury Goods and International Markets

Energy and Natural Resources
Strengths
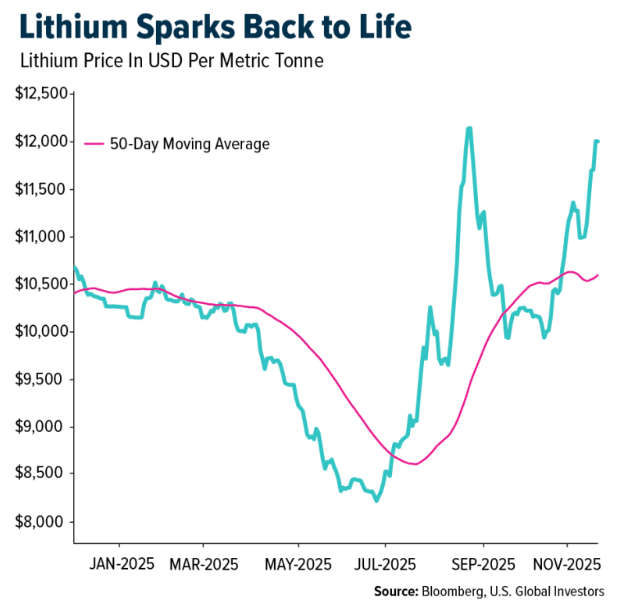
- The best performing commodity for the week was lithium, up 7.85%. Lithium prices have strengthened. This week, JPMorgan’s Rebecca Wen expects global energy-storage-system (ESS) battery shipments to surge 30% to ~770 GWh in 2026, with ESS now accounting for over a quarter of global battery output with demand booming which is lifting lithium prices and boosting margins for cell makers. ESS are needed to store excess energy from renewable sources.
- Nanfang Nonferrous has launched a Singapore-based trading arm to boost its global visibility and strengthen its position in a market where rising smelting capacity and weak mine supply have pressured processing fees. The move reflects a broader trend among smelters and commodity traders toward deeper metals-market integration, giving private Chinese operators like Nanfang more leverage against state-backed buyers and rising competition for copper, zinc, and lead concentrates.
- Geopolitical tensions, from Ukraine’s strike on Russia’s Novorossiysk oil hub to Iran’s seizure of a tanker near the Strait of Hormuz, have added a risk premium to crude, providing rare support for oil prices after a year of oversupply concerns. For oil and gas companies pressured in 2025, these disruptions and tighter sanctions on Russia underscore the strategic value of their infrastructure and production capacity.
Weaknesses
- The worst performing commodity for the week was lumber, which was down 6.67%. Lumber prices sold off this week as traders grappled with policy uncertainty and the impact of new U.S. tariffs, which have injected fresh volatility into an already fragile market. With Canadian producers warning of supply disruptions and operators like Conifex flagging rising duties and operational risks, sentiment across North American lumber markets has turned sharply cautious.
- Copper and aluminum fell after weaker-than-expected Chinese industrial data suggested softer demand, putting both metals on track for their first daily decline of the week. Copper remains up about 1% for the week and over 20% year-to-date due to supply disruptions, while aluminum is still supported by China’s smelter capacity limits despite the pullback.
- Rio Tinto has shelved its $2.95 billion Jadar lithium project in Serbia, signaling a shift under new CEO Simon Trott as the miner cuts costs and focuses on near-term opportunities amid stalled permits, community opposition, and a lithium price slump. The decision highlights Rio’s push to “live within its means” after heavy spending on Arcadium and Rincon, with investors awaiting further restructuring updates at Capital Markets Day.
Opportunities
- India’s decision to sharply cut December deliveries of Russian crude marks a major geopolitical and commercial shift, as U.S. sanctions and trade talks push the world’s third-largest importer back toward Western and Middle Eastern suppliers. The move gives U.S. and Gulf producers a chance to regain market share in India ahead of the high-demand winter season, with refiners already securing U.S., Saudi, and Emirati barrels.
- Lundin Mining’s CEO Jack Lundin is meeting Australian investors as part of “regular outreach,” but his visit — along with the company’s strong copper output and backing from deep Australian capital pools — has bankers speculating about a potential ASX listing. While no formal move has been made, the pattern mirrors other foreign miners who prepared months ahead of a listing, suggesting Lundin could join Australia’s pipeline of copper-focused IPO candidates.
- Chevron is launching its first natural gas-fired data center power project in West Texas, targeting up to 5,000 MW of future capacity, with an initial 2,500 MW by 2027 — enough to power two nuclear reactors — to meet rising AI energy demand. Partnering with Engine No. 1 and GE Vernova for seven gas turbines, Chevron plans to monetize 3 billion cubic feet per day of Permian gas while projecting 14% annual free cash flow growth to $30 billion by 2030, assuming Brent crude at $70 per barrel.
Threats
- The IAEA warns that months of lost access to Iran’s near-bomb-grade uranium, combined with Iran’s silence after Israeli and U.S. strikes, has created serious uncertainty about where the material is and whether its program remains peaceful. With inspections disrupted and talks stalled after Trump’s June bombing campaign, the agency says it cannot assure the world of Iran’s intentions until Tehran restores full cooperation.
- Iron ore is still holding above $100 a ton, but shrinking Chinese steel output and rising port inventories are increasing pressure that could push prices back into double-digit territory. With stockpiles at their highest level since March and Guinea’s massive new mine ramping up, both weaker demand and new supply are converging to threaten iron ore’s resilience.
- Goldman Sachs warns that China’s aggressive expansion of power generation, spanning renewables, coal, and nuclear, could give it a structural advantage over the U.S. in scaling energy-hungry AI data centers, with China expected to have roughly 400 gigawatts of spare capacity by 2030. In contrast, tightening US grid reserves and limited new plant construction mean most regions are already near critical capacity, creating a potential bottleneck for future data-center growth.
Bitcoin and Digital Assets
Strengths
- The Czech central bank’s purchase of $1 million in bitcoin, a USD-based stablecoin, and a tokenized deposit signals rising institutional confidence in digital assets. By testing custody, security, and AML processes end-to-end, the bank reinforces the legitimacy of tokenized finance. This early adoption highlights the expanding role of blockchain-based assets in future payment and investment systems. The Czech central bank became the first central bank to buy bitcoin.
- BNY Mellon’s launch of a money market fund designed to hold GENIUS Act–compliant reserves marks a major step toward institutionalizing U.S. stablecoins. The fund targets a stable $1 share price with 99.5% exposure to government-backed instruments such as short-term Treasuries and government repos, enhancing transparency and regulatory rigor. Initial investment from Anchorage Digital reinforces the growing alignment between traditional finance and on-chain payment ecosystems, strengthening the foundation of regulated digital dollars.
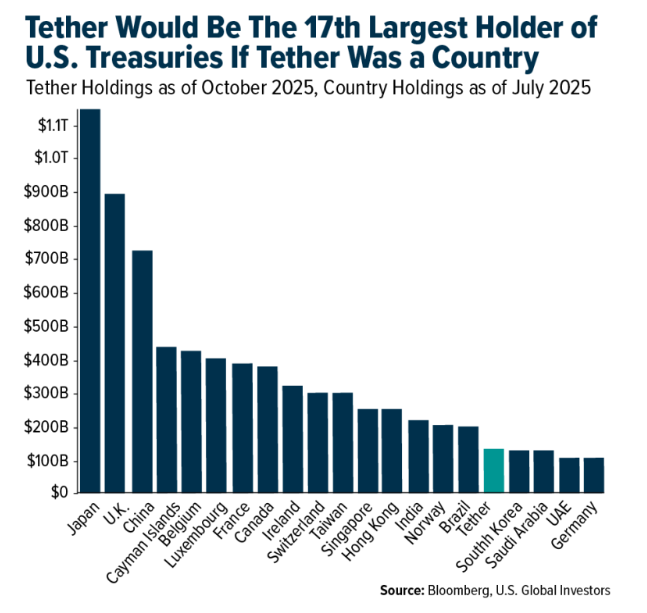
- Tether’s $135 billion in U.S. Treasuries and 500 million global users cement its position as a systemic player in global markets, ranking as the 17th-largest holder of Treasuries worldwide. Its dominance in tokenized assets, including roughly 100 tons of physical gold backing its gold token, strengthens market confidence and drives broader institutional adoption. This scale and diversification reinforce Tether’s influence across the digital-asset ecosystem.
Weaknesses
- Bitcoin falling below $95,000 and losing nearly all its gains for the year underscores how fragile the market remains. Heavy selling triggered $19 billion in liquidations and erased more than $1 trillion in total crypto value. ETFs saw $870 million in outflows, and liquidity dropped 30%, increasing price volatility. Bitcoin continues to be highly sensitive to macro pressures, weakening overall market stability.
- Morgan Stanley’s view that Bitcoin has entered the “fall season” of its four-year cycle—and its recommendation that investors harvest gains—signals rising institutional caution. Its framing of an approaching “crypto winter” highlights vulnerability to cyclical downturns and shifting liquidity conditions. Such warnings from major Wall Street strategists can dampen market sentiment and intensify short-term downside pressure.
- According to CoinMarketCap, among the top 100 crypto assets, the biggest losers over the past seven days were Aerodrome Finance (AERO), down 19.09%, followed by Canton (CC), down 14.79%, and Decred (DCR), down 11.96%.
Opportunities
- Canary Capital Group LLC launched the first U.S. spot XRP ETF, unlocking new institutional demand. Nasdaq’s certification of the spot XRP ETF (XRPC) opens a new segment of institutional crypto exposure beyond Bitcoin and Ethereum. The launch coincides with strong network growth, over 21,000 new XRP wallets in 48 hours, and a 31% surge in trading volume, signaling expanding investor interest. This milestone positions XRP for broader adoption as traditional asset managers integrate more diversified digital-asset products.
- Singapore is accelerating institutional tokenization frameworks. Its efforts to trial tokenized MAS bills, regulate stablecoins, and expand CBDC pilots position the country as a global leader in digital-asset infrastructure. Clear rules on reserve backing and redemption standards strengthen trust in stablecoins, while cross-border CBDC collaborations with major central banks support future interoperability. These initiatives foster institutional adoption and scalable tokenized finance.
- Texas is emerging as a strategic hub for crypto innovation. Coinbase’s decision to leave Delaware and reincorporate in Texas highlights the state’s rise as a pro-innovation environment with lower costs, friendlier regulations and tax rules, and clearer legal frameworks. Texas’ push to attract blockchain firms creates stronger support for digital-asset companies, positioning the state as a growing U.S. center for crypto development. This shift may accelerate institutional investment and industry expansion.
Threats
- Declining investor appetite is forcing treasury buybacks. Upexi’s approval of a $50 million share repurchase program underscores a broader trend of digital-asset treasury firms turning to buybacks as demand for DATs weakens. The company’s stock collapse, down 50% in a month and nearly 90% since April—reflects deepening market distrust. With Solana down almost 30%, treasuries face heightened volatility and shrinking valuations that threaten balance-sheet stability.
- Scammers in Australia impersonated police and misused the government’s ReportCyber system to legitimize calls and steal crypto, reflecting a sharp rise in highly convincing fraud schemes. Regulators have taken down 14,000 online scams since July 2023, including more than 3,000 involving crypto, along with cases such as $5.9 million in seized illicit funds and $1.6 million in ATM scam losses. This escalation threatens user trust and intensifies regulatory scrutiny across the sector.
- According to a CoinTelegraph article, the UK faces a strategic threat as dollar-denominated stablecoins dominate $299 billion of the $300 billion global market, leaving the British pound without on-chain competitiveness. Fintech leaders warn that the absence of a GBP stablecoin could push the UK behind the U.S. and EU in real-time digital payments and tokenized finance. Meanwhile, cautious regulatory proposals from the Bank of England risk slowing innovation and widening the gap with faster-moving jurisdictions.
Defense and Cybersecurity
Strengths
- Lockheed Martin is strengthening its technological leadership with the launch of the STAR.OS platform, which unifies AI systems across the defense and commercial sectors. This raises competitive barriers in C4ISR and accelerates AI integration into major Pentagon programs. The company is reinforcing its position in long-term modernization cycles.
- Rheinmetall is expanding its vertical integration by creating a new venture with Finnish satellite maker ICEYE to produce Generation-4 SAR satellites in Germany. Localizing space-based intelligence reduces Europe’s dependence on external suppliers. Production beginning in 2025–2026 gives Rheinmetall a strategic advantage in the tactical satellite segment.
- The best performing stock this week was Astronics Corp., up 11.00% after two hedge funds, Luxor Capital Group and Dendur Capital, each initiated new stakes in Astronics this quarter, buying 3.7% and 1.1% of the company, respectively, as the stock surged more than 200% year-to-date this week.
Weaknesses
- Energy-grid limitations remain a bottleneck for data-center expansion, as reflected by delays faced by Digital Realty and Stack Infrastructure in Santa Clara. Power shortages slow deployment timelines and increase project costs. This constrains hyperscale growth in one of the most valuable markets.
- Snowflake is under pressure to rapidly expand its AI Data Cloud capabilities amid intensifying competition. The acquisition of Datometry highlights gaps in its native data-migration tools. This creates a risk of losing share as big tech accelerates investments in AI infrastructure.
- The worst performing stock for this week was Redwire Corp., down 17.53% after the company reported a bigger-than-expected loss, cut its full-year revenue guidance significantly and indicated delays in government contract awards.
Opportunities
- Microsoft’s large-scale global expansion of hyperscale AI infrastructure is driving a multi-year demand cycle across semiconductors, power systems, cooling and networking. Its Atlanta AI superfactory, the $10 billion Portugal data-center project, and massive Nvidia-GPU deployments form one of the largest capex cycles in history. Suppliers across the AI hardware stack stand to benefit directly.
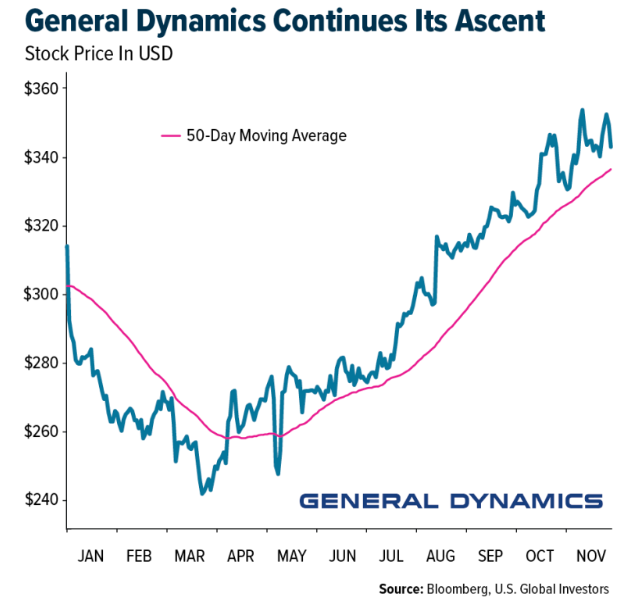
- The global military drone market—driven by National Defense Authorization Act (NDAA) restrictions, rising defense budgets and rapid adoption of advanced intelligence, surveillance and reconnaissance (ISR) and autonomous systems—is projected to grow from $15.23 billion in 2024 to more than $21.81 billion by 2030, with North America holding a dominant share and Asia-Pacific accelerating due to modernization programs. Companies such as Draganfly, AeroVironment, Kratos, General Dynamics and Northrop Grumman continue expanding capabilities through new contracts, technology integrations and infrastructure investments, underscoring strong demand for NDAA-compliant and mission-critical unmanned systems.
- Siemens is deploying over EUR 1 billion into industrial AI solutions in partnership with NVIDIA and AWS, creating new momentum for the industrial automation and robotics ecosystem. The shift toward AI-powered productivity tools accelerates digital transformation across factories and supply chains. Companies aligned with industrial software, automation equipment and edge AI infrastructure gain a strong tailwind.
Threats
- Cybersecurity risks are escalating, illustrated by the zero-day exploit targeting Cisco ISE and the Landfall spyware attacking Samsung mobile devices. Attacks on both mobile and enterprise systems make perimeter defense increasingly complex. This raises cybersecurity spending needs and introduces operational risks.
- U.S. policy direction is tightening around AI-chip exports, seen in Microsoft and Amazon’s support for the Gain AI Act. The proposed legislation would restrict Nvidia chip exports to China, potentially reducing demand and reshaping global supply dynamics. This increases uncertainty for the semiconductor sector.
- The European Commission’s investigation of Google under the Digital Markets Act adds regulatory pressure on large technology companies. Potential penalties and content-ranking restrictions could impact advertising economics and disrupt AI-driven services. This creates a volatile regulatory environment for companies’ dependent on search and digital distribution.
Gold Market
This week gold futures closed the week at $4086.50, up $76.70 per ounce, or 1.91%. Gold stocks, as measured by the NYSE Arca Gold Miners Index, ended the week higher by 6.77%. The S&P/TSX Venture Index came in off 0.61%. The U.S. Trade-Weighted Dollar fell 0.32%.
Strengths
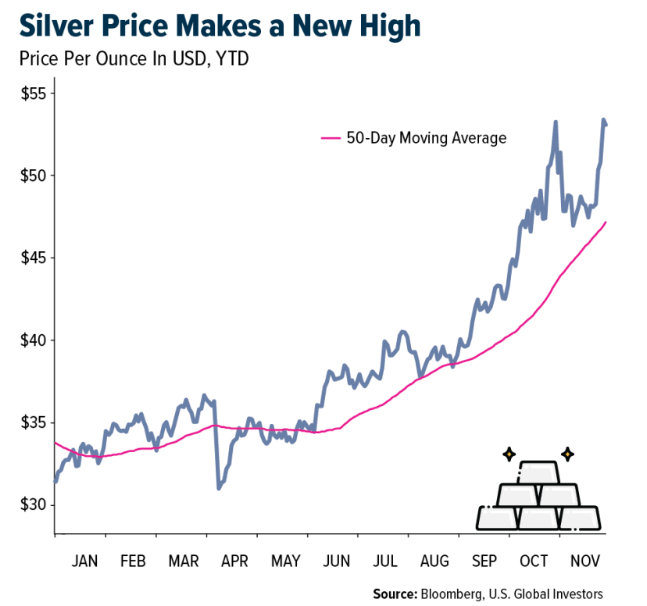
- The best performing precious metal for the week was silver, up 4.85%. Silver’s recent surge is unusual because historically it struggles to outperform when gold is flat, typically softening until bullion regains momentum. Given the tight correlation between the two metals, Bloomberg analysts warn that silver’s gains are likely to fade unless gold resumes a sustained move higher.
- Gold surged as U.S. lawmakers moved closer to ending the longest shutdown in American history but slipped later in the week as doubts about a potential rate cut at the next Federal Reserve meeting grew. Ending the shutdown would provide investors with greater clarity on key economic indicators, such as jobs and inflation, according to Bloomberg.
- Harmony delivered a robust first-quarter 2026 operational update, with group production of 390,000 ounces tracking slightly ahead of UBS’s expectations and all-in sustaining costs of $1,954 per ounce, below the lower end of full-year 2026 guidance. Management reiterated its full-year 2026 guidance.
Weaknesses
- The worst performing precious metal for the week was platinum, still up 0.68%. As traders weight what transparent market insights will mean after China announces new platinum and palladium futures market that will publish daily warehouse stockpile data. The move is expected to boost market transparency and influence global pricing, as tight inventories, strong Chinese demand, and high borrowing costs continue to strain the platinum market.
- Stifel is updating its estimates following its first look at B2Gold’s third-quarter results, which included a negative guidance revision at Goose due to ramp-up challenges, along with a delay in the Fekola Regional permit, now expected before year-end.
- Silver held in London vaults increased by the largest amount in at least nine years, easing an extreme squeeze that had sent prices soaring over silver stored in Shanghai and New York. Vaults underpinning the London market added nearly 54 million troy ounces of silver in October, according to Bloomberg.
Opportunities
- Sibanye-Stillwater reached an agreement with Appian Capital ahead of the quantum of damages hearing, according to BMO. The company will pay Appian US$215 million. This is positive, as Sibanye-Stillwater can comfortably fund the settlement from its current treasury and removes any overhang, allowing the company to focus on consistent operational delivery and growth.
- Silver Tiger Metals announced it has received all required permits for the open-pit El Tigre Stockwork Silver-Gold Project. Representing a highly anticipated rerating catalyst for its shares, Stifel views the project as a low-capital, significant free cash flow generator, with a one-year payback that could unlock the broader district. An expected preliminary economic assessment on the underground project is likely to detail additional asset value, with the current US$166 million in situ value for underground ounces providing strong downside protection.
- Alex Wolf, global head of macro and fixed income strategy at J.P. Morgan Private Bank, noted in an interview that the price of gold could reach US$5,200 to US$5,300 per ounce by the end of 2026. He expects central bank purchases, a key driver of gold prices, to continue. Wolf also noted that gold as a percentage of foreign exchange reserves remains relatively small, particularly in emerging markets, which are likely to continue adding, albeit perhaps at a slower pace. Many emerging markets are running budget surpluses, and those cash flows will need to be reinvested.
Threats
- Gold is traditionally a hedge against inflation, but in China, rising bullion prices are temporarily easing deflationary pressures. Core inflation last month saw its fastest increase in almost two years, helping the broader consumer price index end three months at or below zero. In October, gold contributed nearly half of the 1.2% rise in the core index, according to Goldman.
- The U.S. Mint reported higher gold coin sales compared with recent months, though the total remained modest at just 9,000 ounces. Given the speed and scale of gold’s recent rally, any correction would need to be significant enough to temper the current exuberance, according to Bloomberg.
- Senegal plans to revise its mining code and tighten oversight of natural resources to increase the state’s stake in private projects and boost revenue amid a deepening debt crisis. A new mining law, expected by year-end, aims to ensure greater domestic benefit from minerals, including increased local processing, according to President Bassirou Diomaye Faye and cabinet meeting minutes.
A message from Advisor Perspectives and VettaFi: Discover something new! Click here to register for our upcoming webcasts.
U.S. Global Investors, Inc. is an investment adviser registered with the Securities and Exchange Commission (“SEC”). This does not mean that we are sponsored, recommended, or approved by the SEC, or that our abilities or qualifications in any respect have been passed upon by the SEC or any officer of the SEC.
This commentary should not be considered a solicitation or offering of any investment product. Certain materials in this commentary may contain dated information. The information provided was current at the time of publication. Some links above may be directed to third-party websites. U.S. Global Investors does not endorse all information supplied by these websites and is not responsible for their content. All opinions expressed and data provided are subject to change without notice. Some of these opinions may not be appropriate to every investor.
Holdings may change daily. Holdings are reported as of the most recent quarter-end. The following securities mentioned in the article were held by one or more accounts managed by U.S. Global Investors as of (09/30/2025):
Boeing
United Parcel Service
FedEx Corp.
Delta Air Lines
American Airlines
United Airlines
Norwegian Cruise Line Holdings (NCLH)
Tapestry
Tesla
Barrick Mining Corp.
McFarland Lake Mining Ltd.
Aris Mining Corp.
Omai Gold Mines Corp.
Andean Precious Metals Corp.
Vault Minerals Ltd.
Felix Gold Ltd.
General Dynamics Corp.
Harmony Gold
B2Gold
Sibanye-Stillwater
Silver Tiger Metals
Lundin Gold
GE Vernova
*The above-mentioned indices are not total returns. These returns reflect simple appreciation only and do not reflect dividend reinvestment.
The Dow Jones Industrial Average is a price-weighted average of 30 blue chip stocks that are generally leaders in their industry. The S&P 500 Stock Index is a widely recognized capitalization-weighted index of 500 common stock prices in U.S. companies. The Nasdaq Composite Index is a capitalization-weighted index of all Nasdaq National Market and SmallCap stocks. The Russell 2000 Index® is a U.S. equity index measuring the performance of the 2,000 smallest companies in the Russell 3000®, a widely recognized small-cap index.
The Hang Seng Composite Index is a market capitalization-weighted index that comprises the top 200 companies listed on Stock Exchange of Hong Kong, based on average market cap for the 12 months. The Taiwan Stock Exchange Index is a capitalization-weighted index of all listed common shares traded on the Taiwan Stock Exchange. The Korea Stock Price Index is a capitalization-weighted index of all common shares and preferred shares on the Korean Stock Exchanges.
The Philadelphia Stock Exchange Gold and Silver Index (XAU) is a capitalization-weighted index that includes the leading companies involved in the mining of gold and silver. The U.S. Trade Weighted Dollar Index provides a general indication of the international value of the U.S. dollar. The S&P/TSX Canadian Gold Capped Sector Index is a modified capitalization-weighted index, whose equity weights are capped 25 percent and index constituents are derived from a subset stock pool of S&P/TSX Composite Index stocks. The NYSE Arca Gold Miners Index is a modified market capitalization weighted index comprised of publicly traded companies involved primarily in the mining for gold and silver. The S&P/TSX Venture Composite Index is a broad market indicator for the Canadian venture capital market. The index is market capitalization weighted and, at its inception, included 531 companies. A quarterly revision process is used to remove companies that comprise less than 0.05% of the weight of the index, and add companies whose weight, when included, will be greater than 0.05% of the index.
The S&P 500 Energy Index is a capitalization-weighted index that tracks the companies in the energy sector as a subset of the S&P 500. The S&P 500 Materials Index is a capitalization-weighted index that tracks the companies in the material sector as a subset of the S&P 500. The S&P 500 Financials Index is a capitalization-weighted index. The index was developed with a base level of 10 for the 1941-43 base period. The S&P 500 Industrials Index is a Materials Index is a capitalization-weighted index that tracks the companies in the industrial sector as a subset of the S&P 500. The S&P 500 Consumer Discretionary Index is a capitalization-weighted index that tracks the companies in the consumer discretionary sector as a subset of the S&P 500. The S&P 500 Information Technology Index is a capitalization-weighted index that tracks the companies in the information technology sector as a subset of the S&P 500. The S&P 500 Consumer Staples Index is a Materials Index is a capitalization-weighted index that tracks the companies in the consumer staples sector as a subset of the S&P 500. The S&P 500 Utilities Index is a capitalization-weighted index that tracks the companies in the utilities sector as a subset of the S&P 500. The S&P 500 Healthcare Index is a capitalization-weighted index that tracks the companies in the healthcare sector as a subset of the S&P 500. The S&P 500 Telecom Index is a Materials Index is a capitalization-weighted index that tracks the companies in the telecom sector as a subset of the S&P 500.
The Consumer Price Index (CPI) is one of the most widely recognized price measures for tracking the price of a market basket of goods and services purchased by individuals. The weights of components are based on consumer spending patterns. The Purchasing Manager’s Index is an indicator of the economic health of the manufacturing sector. The PMI index is based on five major indicators: new orders, inventory levels, production, supplier deliveries and the employment environment. Gross domestic product (GDP) is the monetary value of all the finished goods and services produced within a country’s borders in a specific time period, though GDP is usually calculated on an annual basis. It includes all private and public consumption, government outlays, investments and exports less imports that occur within a defined territory.
The S&P Global Luxury Index is comprised of 80 of the largest publicly traded companies engaged in the production or distribution of luxury goods or the provision of luxury services that meet specific investibility requirements.


