Navigating from Uncertainty to Steadier Ground
As we close out the third quarter of 2025, the extreme volatility and policy uncertainty that defined the first half of the year have meaningfully subsided. While key risks remain elevated above historical norms, the investment landscape has become considerably more manageable.
The third quarter delivered strong returns across all major asset classes. This positive momentum has powered impressive year-to-date performance: the S&P 500 is up 14.83%, the NASDAQ has gained 17.93%, and international (MSCI EAFE) and emerging market equities (MSCI Emerging Markets Index) have significantly outperformed U.S. stocks with returns of 25.14% and 27.53% respectively.
The Fed’s Balancing Act
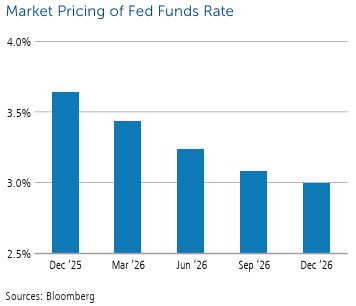
The Federal Reserve took action in September, cutting rates by 25 basis points to a range of 4.00%-4.25%. Markets are anticipating two additional rate cuts before year-end as inflation pressures ease.

However, the Fed faces an increasingly complex challenge. While inflation has moderated, it remains above the 2% target. At the same time, cracks are appearing in the labor market—underemployment has climbed to 8%, with a concerning number of Americans in part-time positions when seeking full-time work. The situation is particularly acute for younger workers, with unemployment for those aged 16-24 jumping to 10.5% in August.
The Fed’s focus has clearly shifted from fighting inflation to supporting employment. The central bank believes the “neutral rate” sits around 3%, suggesting there’s room for further cuts if labor conditions continue to soften.
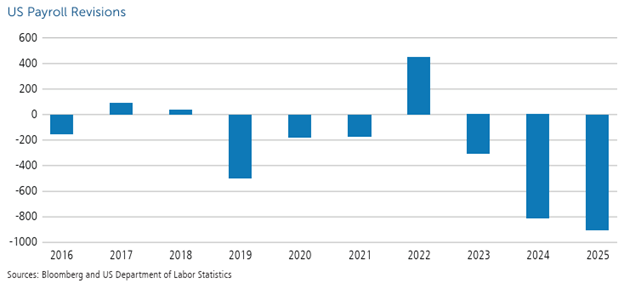
Employment: Weaker Than Initially Reported
The most unsettling development this quarter was the revelation that the job market had been weaker than initially reported. The latest annual payroll revision eliminated 911,000 jobs from previous estimates— the largest downward revision on record.
The prevailing theme remains “low hire, low fire”— companies aren’t laying off workers en masse, but they’re also not adding headcount. This creates particularly challenging circumstances for job seekers, especially young workers entering the labor market.
The Government Shutdown
As of day eight of the government shutdown, we’re confronting another source of uncertainty. The dispute centers on Democratic demands for extended healthcare subsidies versus Republican push for a straightforward funding extension through November 21st.
History suggests these shutdowns typically last a few days to a few weeks. Key catalysts for resolution will likely be federal employees missing paychecks and visible disruptions to services like TSA lines. While concerning, shutdowns rarely have lasting economic impact unless they extend for many weeks.
Two Economic Pictures
There’s a notable divergence between economic data and rate cut expectations. Real-time GDP measures project solid growth, yet markets are pricing in multiple rate cuts due to labor market weakness. Economic data is surprising to the upside—the Citigroup Economic Surprise Index has turned positive after being deeply negative earlier in the year.
The good news: consumption data remains strong, particularly among high-income earners. Since consumer spending represents roughly 70% of GDP, the economy can continue growing even if other sectors show weakness.
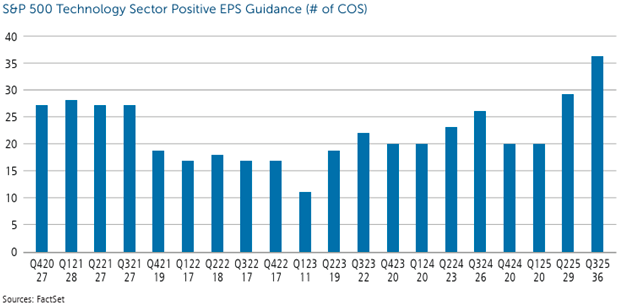
Corporate Earnings: A Bright Spot
Corporate fundamentals remain remarkably strong. We’re seeing a record 36 S&P 500 technology companies issuing positive earnings guidance for Q3—the highest level ever recorded. The information technology sector leads with an estimated 21% earnings growth rate for Q3.
This robust earnings momentum helps explain why equity markets have been resilient despite elevated recession concerns. At the end of the day, stock prices follow earnings, and earnings continue to look solid.
Our Positioning: Tactical Adjustments
In response to these developments, we’ve made several tactical shifts during the quarter:
-
Fixed Income: We’ve moved toward the intermediate part of the yield curve, which offers the best risk-reward profile as the Fed cuts rates.
-
Small-Cap Equities: We’re focusing on active management where skilled managers can add significant value through careful security selection.
-
Geographic Diversification: We’ve maintained international exposure, which has delivered over 25% returns year-to-date, underscoring the value of global diversification.
-
Overall Risk: Our equity/fixed income allocation remains broadly balanced given the mixed signals in the data.
Looking Ahead: Cautiously Optimistic
As we move into the final quarter of 2025, I’m cautiously optimistic. The extreme policy uncertainty that plagued the first half has diminished significantly. The Fed is cutting rates but not in panic mode. Corporate earnings remain healthy. And while the labor market is softening, we’re not seeing the kind of deterioration that typically precedes recessions.
That said, we remain vigilant. The government shutdown could dampen fourth-quarter growth if prolonged. Labor market weakness could accelerate. And we’re always just one unexpected policy announcement away from renewed volatility.
All major asset classes posted positive returns in Q3, led by strong equity performance. Core fixed income continued its solid year, demonstrating the value of maintaining balanced, diversified portfolios. We position portfolios to weather various scenarios while participating in market upside should conditions continue improving.
Our investment philosophy has always emphasized quality over speculation, diversification over concentration, and long-term fundamentals over short-term noise. The events of 2025 have vindicated that approach. While it’s difficult to predict precisely how trade negotiations will unfold or whether the Fed will cut rates two or three more times this year, we can ensure your portfolio is resilient across multiple outcomes.
Please don’t hesitate to contact Calamos Wealth Management or your advisor if you have questions or concerns about your portfolio or the markets.
A message from Advisor Perspectives and VettaFi: Discover something new! Click here to register for our upcoming webcasts.
This material is distributed for informational purposes only. The information contained herein is based on internal research derived from various sources and does not purport to be statements of all material facts relating to the information mentioned, and while not guaranteed as to the accuracy or completeness, has been obtained from sources we believe to be reliable. Opinions, estimates, forecasts, and statements of financial market trends that are based on current market conditions constitute our judgment and are subject to change without notice. The views and strategies described may not be suitable for all investors. References to specific securities, asset classes and financial markets are for illustrative purposes only and are not intended to be, and should not be interpreted as, recommendations. The opinions and views of third parties do not represent the opinions or views of Calamos Wealth Management LLC. Opinions referenced are as of the date of publication and are subject to change due to changes in the market, economic conditions, or changes in the legal and/or regulatory environment and may not necessarily come to pass. This information is provided for informational purposes only and should not be considered tax, legal, or investment advice.
Past performance may not be indicative of future results. Different types of investments involve varying degrees of risk. Therefore, it should not be assumed that future performance of any specific investment or investment strategy (including the investments and/or investment strategies recommended and/or undertaken by Calamos Wealth Management, LLC [“Calamos”]), or any non-investment related services, will be profitable, equal any historical performance level(s), be suitable for your portfolio or individual situation, or prove successful. Calamos is neither a law firm, nor a certified public accounting firm, and no portion of its services should be construed as legal or accounting advice. Moreover, you should not assume that any discussion or information contained in this document serves as the receipt of, or as a substitute for, personalized investment advice from Calamos. Please remember that it remains your responsibility to advise Calamos, in writing, if there are any changes in your personal/financial situation or investment objectives for the purpose of reviewing/evaluating/revising our previous recommendations and/or services, or if you would like to impose, add, or to modify any reasonable restrictions to our investment advisory services. A copy of our current written disclosure Brochure discussing our advisory services and fees is available upon request or at wm.calamos.com. Diversification and asset allocation does not guarantee a profit or protect against a loss.
Historical performance results for investment indices, benchmarks, and/or categories have been provided for general informational/comparison purposes only, and generally do not reflect the deduction of transaction and/or custodial charges, the deduction of an investment management fee, nor the impact of taxes, the incurrence of which would have the effect of decreasing historical performance results. It should not be assumed that your account holdings correspond directly to any comparative indices or categories. Please Also Note: (1) performance results do not reflect the impact of taxes; (2) comparative benchmarks/indices may be more or less volatile than your accounts; and, (3) a description of each comparative benchmark/index is available upon request.
S&P 500 Index is generally considered representative of the US stock market.
The S&P 500® Equal Weight Index (EWI) is the equal-weight version of the widely-used S&P 500. The index includes the same constituents as the capitalization weighted S&P 500, but each company in the S&P 500 EWI is allocated a fixed weight - or 0.2% of the index total at each quarterly rebalance.
The Nasdaq Composite Index is a market capitalization-weighted index of more than 2,500 stocks listed on the Nasdaq stock exchange. It is a broad index that is heavily weighted toward the important technology sector. The index is composed of both domestic and international companies.
The Russell 1000 Growth and Value US ESG Indexes are alternatively-weighted US equity indexes based on the Russell US Style Indexes. The indexes are designed to meet improved index level ESG profile, while maintaining similar risk/return characteristics to the underlying universe.
The Bloomberg US Agg Index is a broad-based flagship benchmark that measures the investment grade, US dollar-denominated, fixed-rate taxable bond market. The index includes Treasuries, government-related and corporate securities, MBS (agency fixed-rate pass-throughs), ABS and CMBS (agency and nonagency).
The MSCI EAFE® Index measures developed market equity performance (excluding the US and Canada).
The MSCI Emerging Markets Index is a free float-adjusted market capitalization index that is designed to measure equity market performance of emerging markets. The index is calculated on a total return basis, which includes reinvestment of gross dividends before deduction of withholding taxes.
The Russell 2000® Growth Index measures the performance of the small-cap growth segment of the US equity universe. It includes those Russell 2000® companies with higher price-to-value ratios and higher forecasted growth values. The Russell 2000® Growth Index is published and maintained by FTSE Russell.
Read more commentaries by Calamos Wealth Management