There are many ways to describe the strong performance in large cap US stock prices this year. You could simply call it a bull market, with the S&P 500 total return index up 31.2% since its low in early April and up 11.5% year-to-date. The strong buying pressure could even be called a “euphoria.” With continued gains, it would be no surprise if some observers started referring to it as a return to the type of “irrational exuberance” seen in the 1990s. In any case, the market is exhibiting strong momentum, especially in the growthy sectors such as Information Technology and Communication Services. Indeed, investors now widely understand that the lion’s share of the uptrend this year has come from just a few stocks within those sectors, i.e., the Magnificent 7. A key question is whether these trends will continue. And to the extent that there is a risk of these trends reversing, is there a good way to hedge the associated downside risk?
The growth of index investing in recent decades is probably one reason for the outperformance of large cap growth stocks like the Mag 7. Many individual and institutional investors simply channel their US large cap stock investments into funds tracking the S&P 500 Index, where each holding is weighted by the stock’s total market capitalization. Funds channeled into this version of the S&P 500 go disproportionately to those stocks with big market caps, especially the Mag 7, helping them appreciate even more. But there is also a version of the S&P 500 in which the allocation to each stock is an equal 0.2% — the S&P 500 Equal Weight Index. In this methodology, stocks with smaller capitalizations and more “value” characteristics have a higher representation than they do in the capitalization-weighted version. If we compare the performance of the cap-weighted S&P 500 to that of its equal-weighted counterpart, we can get a sense of the relative advantages or disadvantages of each index during different market scenarios.
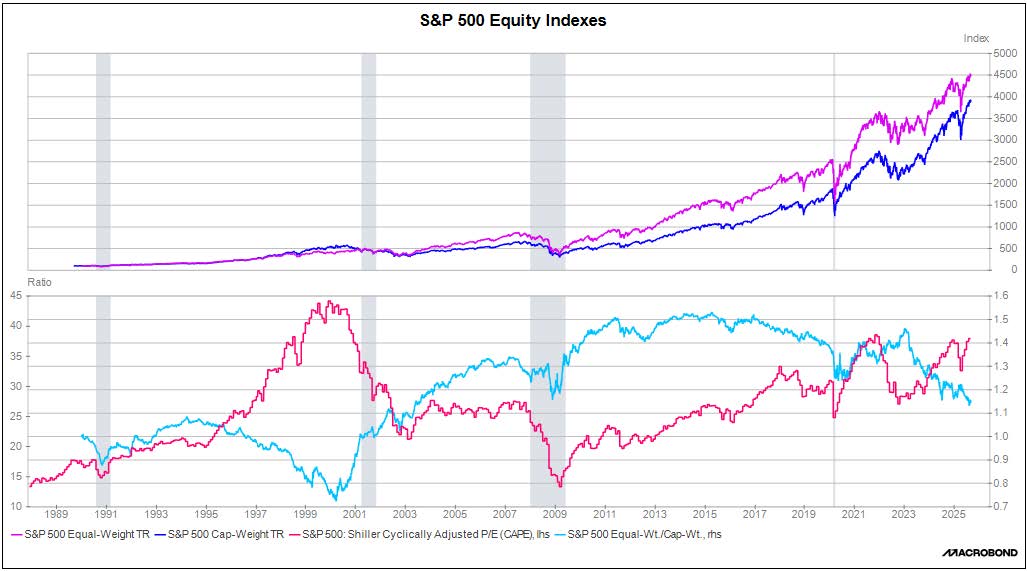
In the upper panel of the following chart, we show the S&P 500’s total return index in both its cap-weighted and equal-weighted forms, with each based to 100 in January 1990. The figure shows that over the last 35 years, the equal-weighted variation of the S&P 500 has produced a meaningfully higher total return than the market cap-weighted one. (Consistent with finance theory, the higher return for the equal-weighted index also comes with a higher standard deviation.)

Importantly, the relative performance of the two indexes changes over time. In the bottom panel of the chart, the light blue line shows the relative performance of the equal-weighted index to that of the version weighted by market cap. We have also included the Case-Shiller cyclically adjusted price/earnings ratio as a measure of average stock valuation.
In the bottom panel, the long downtrends in the blue line from 1995 to 2000 and from 2015 to the present coincide with periods of intense market enthusiasm, strong momentum in big, popular growth stocks, and lagging performance in relatively smaller, less growthy stocks. These periods generally happen when investors are pouring funds into the market and driving up valuations. In these periods, including the present, it can be tempting for investors to just focus on the large cap growth stocks driving the market. However, the chart clearly shows that when market enthusiasm eventually reverses and investors pull out of the market, the relative advantage of the equal-weight index snaps back sharply. This reflects the sudden sell-off in trending, growthy, highly weighted stocks during such periods. In sum, the bottom panel illustrates how concentration risk increases in long, strong bull markets. This tends to set the stage for sharp portfolio declines when markets go into reverse, even for investors who think they are well diversified because they are invested in the cap-weighted S&P 500.
The lesson from this discussion is that while fast-rising large cap growth stocks like the Mag 7 may still have some momentum left, investors should also consider broad diversification with meaningful exposure to undervalued and overlooked stocks, which could have the potential for solid, longer-run returns.
Don’t miss our accompanying podcasts, available on our website and most podcast platforms: Apple | Spotify
By Patrick Fearon-Hernandez, CFA
Originally published by Confluence Investment Management
For more news, information, and strategy, visit the ETF Strategist Content Hub.
Past performance is no guarantee of future results. Information provided in this report is for educational and illustrative purposes only and should not be construed as individualized investment advice or a recommendation. The investment or strategy discussed may not be suitable for all investors. Investors must make their own decisions based on their specific investment objectives and financial circumstances. Opinions expressed are current as of the date shown and are subject to change.
This report was prepared by Confluence Investment Management LLC and reflects the current opinion of the authors. It is based upon sources and data believed to be accurate and reliable. Opinions and forward-looking statements expressed are subject to change. This is not a solicitation or an offer to buy or sell any security.
A message from Advisor Perspectives and VettaFi: Ready for your next career move?Explore our articles on financial advisor transitions.
© Confluence Investment Management
Read more commentaries by Confluence Investment Management