Tactical Rules Remain in Risk-On Mode
Membership required
Membership is now required to use this feature. To learn more:
View Membership BenefitsSUMMARY
- We believe the Fed is on the investor’s side, as the bar is higher to raise rates than lower rates.
- The Trend remains positive, creating an opportunity for US stocks to grind higher.
- The Crowd’s neutral stance signals opportunistic buying of stocks, in our opinion.
Since the last update of our three ‘Tactical Rules’ on June 17th, both domestic and international equity markets have rallied, increasing roughly 6.9% and 3.7%, respectively. Since the 2025 market low on April 21st, domestic equities have outpaced their international counterparts by 10%, after underperforming them by 14% year-to-date prior to April 21st.
Despite the tails of two different trading regimes thus far this year, equity markets have prevailed and are up year-to-date. Equity markets have flourished due to strong second quarter corporate earnings in the face of tariff policy headwinds, pressure on the Fed to lower interest rates, and a labor market that is slowing. We think the reason for the positive performance of global equity markets can be explained by our three ‘Tactical Rules’ of “Don’t Fight the Fed”, “Don’t Fight the Trend” and “Beware of the Crowd at Extremes”. We believe the Fed remains on investors side with a bias towards cutting if the data permits, the trend is positive, and the crowd is neutral. While the Tactical Rules overall have not changed from a “flashing greenlight” since our last update, there have been some changes underneath the surface that we will explore.
‘Don’t Fight the Fed’: Fed in a Quandary…but on Investors’ Side – FLASHING GREEN
After cutting interest rates by a total of one hundred basis points last year (basis point= 1/100th of a percent), the Fed has held interest rates steady through its first four meetings of 2025. However, unlike the previous meetings where there was unanimous agreement amongst the governors of the Federal Open Market Committee (FOMC), the June meeting saw two dissents. Governors Waller and Bowman both cited labor market deterioration for the reason for their dissent, with each wanting to lower the fed funds rate by 25 basis points. The governors were vindicated by a Non-Farm Payroll (NFP) report that showed the economy only created seventy-three thousand jobs in July, after less than stellar revisions for May and June that brought the 3-month average to thirty-five thousand.
To put this data into perspective, we look at the Fed policy through the lens of its ‘full employment’ mandate. In September 2024, when the Fed cut rates by 50 basis points, the 3-month average for NFP going into the September meeting was 82,000 jobs created. To achieve that same 3-month average as last year, the economy would need to create 159,000 jobs in August…this seems optimistic to us given the July data. Hence, if the data does not pick up, we could see the Fed cutting rates.
However, Chairman Powell has pointed out that his primary focus is on the unemployment rate, not the number of jobs created in each month. Right now, the unemployment rate is 4.2%, which would not ring the alarm bell at first glance. However, federal job cuts will begin to be counted towards the unemployment rate in October, so this number is likely to rise. It is possible that the federal job cuts could be offset by aging demographics and slowing immigration that could cause the participation rate to fall, but if it does not fall, the Fed may be forced to cut to stabilize the labor market.
The Fed will face a tough decision at its September 17th meeting as more governors may become concerned regarding the labor market, and others focus on the impact of tariffs and the accompanying inflation. The data will guide the Fed. We believe the bar is higher for the Fed to hike rates than for it to lower rates, so it remains on the investor’s side, in our opinion…we rate The Fed as a “flashing green light.”
Internationally, the Bank of England (BOE) cut its policy rate 25 basis points, to 4.0% at its August 7th meeting, after lowering rates by 25 basis points two meetings prior and then pausing. The BOE is expected to continue lowering its policy rate, based on the swaps market. Currently, the swaps market is forecasting the BOE to cut rates once more this year. Meanwhile, the European Central Bank (ECB) held its deposit rate steady at its last meeting in July as inflation came in at 2.3% year-over-year, which is above its 2% inflation target. While the speed of monetary policy easing is different at each of the major central banks, we believe the major central banks are fully aligned with “Don’t Fight the Fed” and are on the investor’s side. The Bank of Japan (BOJ) is the one exception, as it is currently raising interest rates after leaving them artificially low for an extended period.
‘Don’t Fight the Trend’: Positive Slope Leads to New Highs – GREEN LIGHT
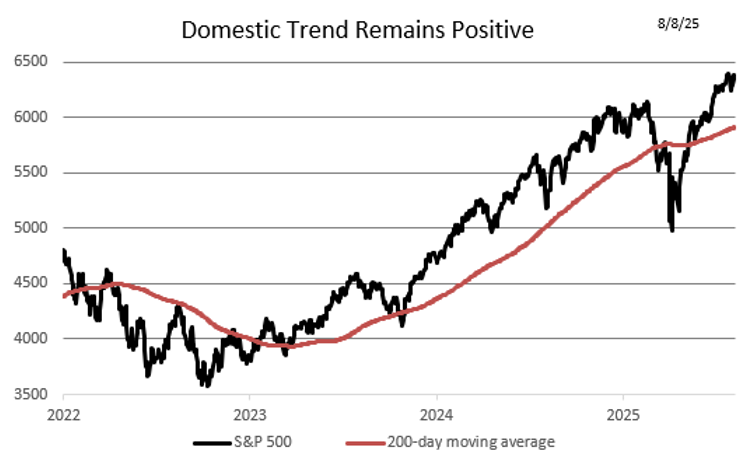
Source: Bloomberg, RiverFront. Data daily as of August 8, 2025. Chart shown for illustrative purposes. Not indicative of RiverFront portfolio performance. Index definitions are available in the disclosures.
The trend on the S&P 500, which we define as the 200-day moving average (SMA), has perked up as the technology sector has led the index to set a series of new all-time highs. In our last update the trend was within 1% of the then all-time high of 6144 and now it is within 50 points of the new high of 6389. The improved performance of the S&P 500 since our last update can be attributed to its improved technical view, as it unwound the “death cross”, where its 50-day moving average (MA) fell below its 200-day SMA and had a “golden cross” where the 50-day MA average rose above its 200-day SMA.
Currently, the trend is rising at a 13% annualized rate, and if history is any guide, this condition should bode well for stock returns over the next 3 to 6 months. This optimism is reflected across our balanced portfolios, as the portfolios are currently overweight US stock exposure. We believe that US ‘economic exceptionalism’ is not dead, as corporate America has adjusted well to the economic headwinds that have appeared this year, posting nearly 9% earnings growth year-over-year in the second quarter. Hence, domestically our rule of “Don’t Fight the Trend” is now signaling a “green light”.
International Trend: Slower but Still Strong – GREEN LIGHT
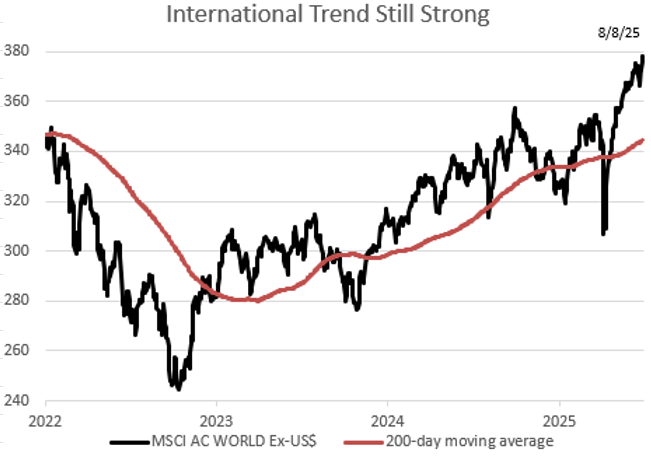
Internationally, the trend of the MSCI All Country World ex-US index (ACWX) has slowed over the last eight weeks but remains strong. The run rate of the primary trend is currently rising at a 12% annualized rate, compared to the 16% annualized rate on our previous update. We believe that the international trend slowdown was due to the headwinds that the US tariff negotiations created. However, we want to reiterate that the positive trend increases the probability of receiving above average returns over the next 3 to 6 months. Given that the trend remains strong, we are maintaining its “green light” rating that we initiated back in mid-March.
Beware of the Crowd at Extremes: Reacting to Recession and Stagflation Fears – YELLOW LIGHT
We regard Crowd Sentiment as the ‘contrary’ indicator of the three ‘Tactical Rules’. The chart below shows a measure of investor sentiment as calculated by Ned Davis Research (NDR). When the line is high it shows excessive optimism, and when it is low, extreme pessimism. NDR research suggests that historically, extreme pessimism can create attractive entry points for tactical investors. This is our preferred data source to measure investor psychology, though we use our own analytical framework from which to draw conclusions on sentiment.
Currently, the NDR Daily Sentiment and the NDR Weekly Sentiment Polls are both in the neutral zone. The Daily sentiment is sitting in the middle of the neutral zone, while the Weekly sentiment has been slower to retrace from the top of the neutral zone. In both cases, we tend to view the crowd’s recent reaction as a mild positive, as they remain a long way from reaching an optimistic extreme that would warrant consideration of a lowering of equity exposure. Historically, we have given more weight to the Weekly for this publication despite incorporating both measures of sentiment in our overall rating. The Daily tends to be a good indicator of the investor’s “real time” view of financial markets, while the Weekly gives a longer-term perspective of the Crowd. Given the current levels of the polls, we believe that the Crowd is well positioned for equity markets to grind higher. Similar to our last update, The Crowd is neither signaling an unequivocal buying nor selling opportunity for equities. Rather, it is giving a more nuanced, neutral signal suggesting opportunistic buying of equities, in our opinion. Hence, we are maintaining our rating for the Crowd of a “yellow light”.
Conclusion: The Tactical Rules Maintain the Bullish Signal… – FLASHING GREEN
The ‘Tactical Rules’ signal a “a flashing green light” even as the Fed finds itself in the unenviable situation of having its dual mandates complicate the decision of whether to cut or hold interest rates steady. The good news is that the Fed’s next move will not be to raise rates, in our opinion. Additionally, the trend remains strong, and the crowd has the appropriate temperament to react to whatever events present themselves in the coming months. The flashing green light signals that the economy is more resilient than market participants thought 8 weeks ago, in our opinion. Corporations have proven their ability to adjust to tariff headwinds on the fly for the second quarter in a row, after producing solid Q2 earnings. Hence, our Tactical Rules are giving us an overall bullish signal. Over the next 3 to 6 months, we believe that market conditions favor both domestic and international equities as both have central banks and strong trends on their side.
Risk Discussion: All investments in securities, including the strategies discussed above, include a risk of loss of principal (invested amount) and any profits that have not been realized. Markets fluctuate substantially over time, and have experienced increased volatility in recent years due to global and domestic economic events. Performance of any investment is not guaranteed. In a rising interest rate environment, the value of fixed-income securities generally declines. Diversification does not guarantee a profit or protect against a loss. Investments in international and emerging markets securities include exposure to risks such as currency fluctuations, foreign taxes and regulations, and the potential for illiquid markets and political instability. Please see the end of this publication for more disclosures.
By Kevin Nicholson, CFA, Global Fixed Income CIO | Partner
Originally published August 12, 2025
For more news, information, and strategy, visit the ETF Strategist Content Hub.
Important Disclosure Information:
The comments above refer generally to financial markets and not RiverFront portfolios or any related performance. Opinions expressed are current as of the date shown and are subject to change. Past performance is not indicative of future results and diversification does not ensure a profit or protect against loss. All investments carry some level of risk, including loss of principal. An investment cannot be made directly in an index.
Information or data shown or used in this material was received from sources believed to be reliable, but accuracy is not guaranteed.
This report does not provide recipients with information or advice that is sufficient on which to base an investment decision. This report does not take into account the specific investment objectives, financial situation or need of any particular client and may not be suitable for all types of investors. Recipients should consider the contents of this report as a single factor in making an investment decision. Additional fundamental and other analyses would be required to make an investment decision about any individual security identified in this report.
Chartered Financial Analyst is a professional designation given by the CFA Institute (formerly AIMR) that measures the competence and integrity of financial analysts. Candidates are required to pass three levels of exams covering areas such as accounting, economics, ethics, money management and security analysis. Four years of investment/financial career experience are required before one can become a CFA charterholder. Enrollees in the program must hold a bachelor’s degree.
All charts shown for illustrative purposes only. Technical analysis is based on the study of historical price movements and past trend patterns. There are no assurances that movements or trends can or will be duplicated in the future.
Ned Davis Research (NDR) is a global provider of independent investment research, solutions and tools. Founded in 1980, NDR helps clients around the world make objective investment decisions.
Stocks represent partial ownership of a corporation. If the corporation does well, its value increases, and investors share in the appreciation. However, if it goes bankrupt, or performs poorly, investors can lose their entire initial investment (i.e., the stock price can go to zero). Bonds represent a loan made by an investor to a corporation or government. As such, the investor gets a guaranteed interest rate for a specific period of time and expects to get their original investment back at the end of that time period, along with the interest earned. Investment risk is repayment of the principal (amount invested). In the event of a bankruptcy or other corporate disruption, bonds are senior to stocks. Investors should be aware of these differences prior to investing.
In general, the bond market is volatile, and fixed income securities carry interest rate risk. (As interest rates rise, bond prices usually fall, and vice versa). This effect is usually more pronounced for longer-term securities). Fixed income securities also carry inflation risk, liquidity risk, call risk and credit and default risks for both issuers and counterparties. Lower-quality fixed income securities involve greater risk of default or price changes due to potential changes in the credit quality of the issuer. Foreign investments involve greater risks than U.S. investments, and can decline significantly in response to adverse issuer, political, regulatory, market, and economic risks. Any fixed-income security sold or redeemed prior to maturity may be subject to loss.
Investing in foreign companies poses additional risks since political and economic events unique to a country or region may affect those markets and their issuers. In addition to such general international risks, the portfolio may also be exposed to currency fluctuation risks and emerging markets risks as described further below.
Changes in the value of foreign currencies compared to the U.S. dollar may affect (positively or negatively) the value of the portfolio’s investments. Such currency movements may occur separately from, and/or in response to, events that do not otherwise affect the value of the security in the issuer’s home country. Also, the value of the portfolio may be influenced by currency exchange control regulations. The currencies of emerging market countries may experience significant declines against the U.S. dollar, and devaluation may occur subsequent to investments in these currencies by the portfolio.
Foreign investments, especially investments in emerging markets, can be riskier and more volatile than investments in the U.S. and are considered speculative and subject to heightened risks in addition to the general risks of investing in non-U.S. securities. Also, inflation and rapid fluctuations in inflation rates have had, and may continue to have, negative effects on the economies and securities markets of certain emerging market countries.
Index Definitions:
Standard & Poor’s (S&P) 500 Index measures the performance of 500 large cap stocks, which together represent about 80% of the total US equities market.
MSCI ACWI ex USA Index captures large and mid cap representation across approximately 22 of 23 developed markets (DM) countries (excluding the US) and approximately 25 emerging markets (EM) countries.
Definitions:
The 200-day moving average is a popular technical indicator which investors use to analyze price trends. It is simply a security’s average closing price over the last 200 days.
The “death cross” market chart pattern refers to the drop of a short-term moving average—meaning the average of recent closing prices for a stock, stock index, commodity, or cryptocurrency over a set period of time—below a longer-term moving average. The most closely watched stock-market moving averages are the 50-day and the 200-day.
A golden cross is a chart pattern in which a relatively short-term moving average crosses above a long-term moving average. It is a bullish breakout pattern that forms when a security’s short-term moving average (such as the 50-day moving average) crosses above its long-term moving average (such as the 200-day moving average) or resistance level. The golden cross indicates the possibility of a long-term bull market emerging. High trading volumes generally reinforce the indicator.
Technology and internet-related stocks, especially of smaller, less-seasoned companies, tend to be more volatile than the overall market.
A basis point is a unit that is equal to 1/100th of 1%, and is used to denote the change in a financial instrument. The basis point is commonly used for calculating changes in interest rates, equity indexes and the yield of a fixed-income security. (bps = 1/100th of 1%)
Federal Open Market Committee (FOMC) refers to the branch of the Federal Reserve System (FRS) that determines the direction of monetary policy in the United States by directing open market operations (OMOs). The committee is made up of 12 members, including seven members of the Board of Governors, the president of the Federal Reserve Bank of New York, and four of the remaining 11 Reserve Bank presidents on a rotating basis.
Nonfarm payroll measures the number of workers in the U.S. economy, excluding farm employees, self-employed individuals, volunteers, private household workers, sole proprietors, and active military service members.
The European Central Bank (ECB) is the central bank responsible for monetary policy of the European Union (EU) member countries that have adopted the euro currency. This currency union is known as the eurozone and currently includes 19 countries. The ECB’s primary objective is price stability in the euro area.
The Bank of England (BoE) is the central bank of the United Kingdom. The BoE oversees monetary policy and issues currency. It also regulates banks, financial firms, and payment systems. Like other central banks, the BoE may act as a lender of last resort in a financial crisis.
The Bank of Japan (BOJ) is the Japanese central bank, which is responsible for issuing and handling currency and treasury securities, implementing monetary policy, maintaining the stability of the Japanese financial system, and providing settling and clearing services.
A recession is a significant, widespread, and prolonged downturn in economic activity. A common rule of thumb is that two consecutive quarters of negative gross domestic product (GDP) growth indicate a recession. However, more complex formulas are also used to determine recessions.
The swaps market is an over-the-counter financial market where two parties exchange cash flows or liabilities based on specified terms
Inflation is a gradual loss of purchasing power, reflected in a broad rise in prices for goods and services over time.
Stagflation is the persistent high inflation combined with high unemployment and stagnant demand in a country’s economy.
Interest rate sensitivity is a measure of how much the price of a fixed-income asset will fluctuate as a result of changes in the interest rate environment. Securities that are more sensitive have greater price fluctuations than those with less sensitivity. This type of sensitivity must be taken into account when selecting a bond or other fixed-income instrument the investor may sell in the secondary market. Interest rate sensitivity affects buying as well as selling.
Don’t Fight the Fed – ‘Supportive’ means the Fed’s monetary policy regarding inflation and employment is in what we believe based on our analysis to be the investors’ best interest; ‘Against’ means the Fed’s monetary policy, in our view, is going against the investors’ best interest; ‘Neutral’ means the Fed’s monetary policy is neither supportive or against the investors’ best interest in our view. Don’t Fight the Trend – Terms correlate to the 200-day moving average as it relates to the equity indexes: ‘Positive’ means that the trend is rising, ‘Flat’ means the trend is flat, ‘Negative’ means the trend is falling. Beware the Crowd at Extremes – Terms correlate to the NDR Crowd Sentiment Poll and its measurement of Extreme Optimism (Bearish), Neutral, or Extreme Pessimism (Bullish).
RiverFront Investment Group, LLC (“RiverFront”), is a registered investment adviser with the Securities and Exchange Commission. Registration as an investment adviser does not imply any level of skill or expertise. Any discussion of specific securities is provided for informational purposes only and should not be deemed as investment advice or a recommendation to buy or sell any individual security mentioned. RiverFront is affiliated with Robert W. Baird & Co. Incorporated (“Baird”), member FINRA/SIPC, from its minority ownership interest in RiverFront. RiverFront is owned primarily by its employees through RiverFront Investment Holding Group, LLC, the holding company for RiverFront. Baird Financial Corporation (BFC) is a minority owner of RiverFront Investment Holding Group, LLC and therefore an indirect owner of RiverFront. BFC is the parent company of Robert W. Baird & Co. Incorporated, a registered broker/dealer and investment adviser.
To review other risks and more information about RiverFront, please visit the website at riverfrontig.com and the Form ADV, Part 2A. Copyright ©2025 RiverFront Investment Group. All Rights Reserved. ID 4737827
A message from Advisor Perspectives and VettaFi: To learn more about this and other topics, check out some of our webcasts.
Membership required
Membership is now required to use this feature. To learn more:
View Membership Benefits