Key Takeaways:
- Today’s LPL Financial Chart of the Day spotlights the seasonal setup for stocks in August.
- The S&P 500 rose 2.2% in July, marking a third straight month of gains for the broader market. A steady drip of broad-based buying pressure compressed volatility, as daily price action was contained within a 1% range throughout the month.
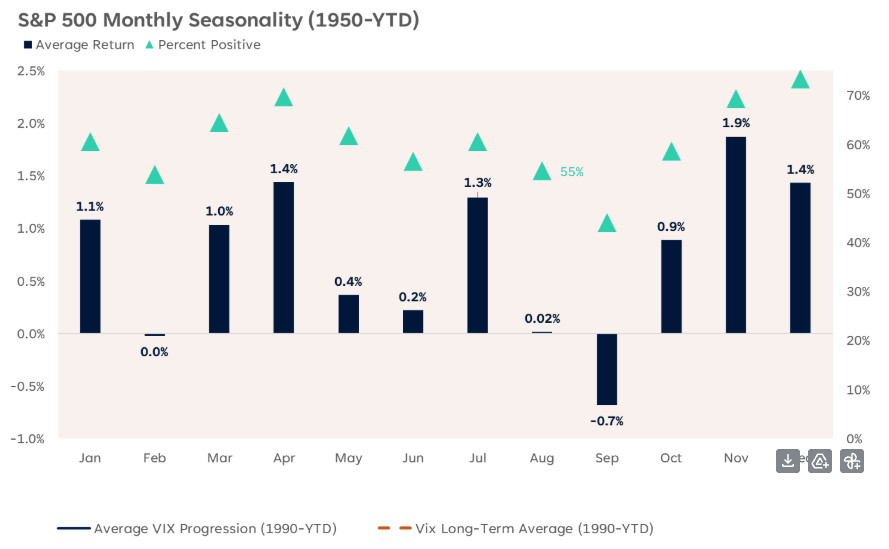
- Seasonal trends suggest volatility could heat up in August. Since 1950, the S&P 500 has traded near the flatline on average. However, when the index is lower on the month, the average loss has been -3.8%, compared to the average gain of 3.2%.
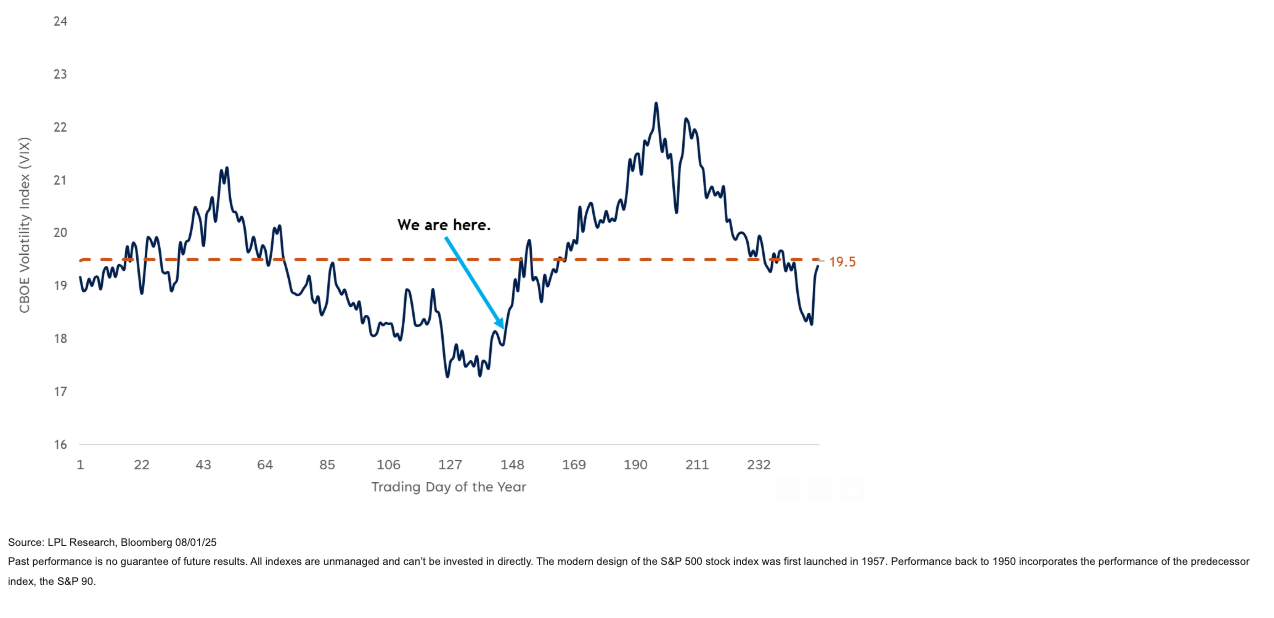
- The CBOE Volatility Index, or more commonly referred to as the VIX or “fear-gauge,” also tends to advance in August. Since 1990, the VIX has posted an average gain of 8.4%, with 57% of months finishing positive (tied with October as the highest positivity rate across the calendar).
A message from Advisor Perspectives and VettaFi: To learn more about this and other topics, check out some of our webcasts.


