The Treasury yield curve is a visual representation of the yields that different Treasuries pay relative to the date they have to be repaid, or their maturity date. Treasuries mature between 30 days to 30 years. If you line up a group of similar Treasuries by their maturity date from shortest to longest, the curve forms out of the varying yields. The resulting shape can give investors valuable insight, like where interest rates may be heading, expectations for inflation, or signs of a potential downturn.
In general, Treasuries with longer times to maturity pay higher yields—a Treasury note that ties up an investor's money for 10 years typically pays a higher yield than a 30-day Treasury bill because the money is locked into that rate for longer. While the economy isn't likely to change much between tonight and tomorrow, if something causes rates to rise after a few years, the investor whose money is locked in at the 10-year rate may not benefit from that increase.
This means that the yield curve generally has an upward slope, but not always. Changes in the shape of the curve can reflect adjustments in investor sentiment, like a downward slope that can indicate there are concerns about the future of the economy. That makes the yield curve a valuable tool for investors looking for insight about when to match the risk of locking money up against the reward it yields.
Creating the yield curve
After Treasuries are initially auctioned, they can be resold. The amount a Treasury bond, note, or bill pays as a coupon and at maturity doesn't change in most instances, but the price of it does depend on the demand for it. The yield it pays always moves in the opposite direction of the price, so a higher price means the yield will go lower.
You can use any combination of maturity dates to form a yield curve. For example, you could combine three-month, one-year, two-year, five-year, 10-year, and 30-year maturities in a single curve.
Each day, the Treasury Department publishes current Treasury rates, which influence the rates banks set for consumer and corporate borrowing.
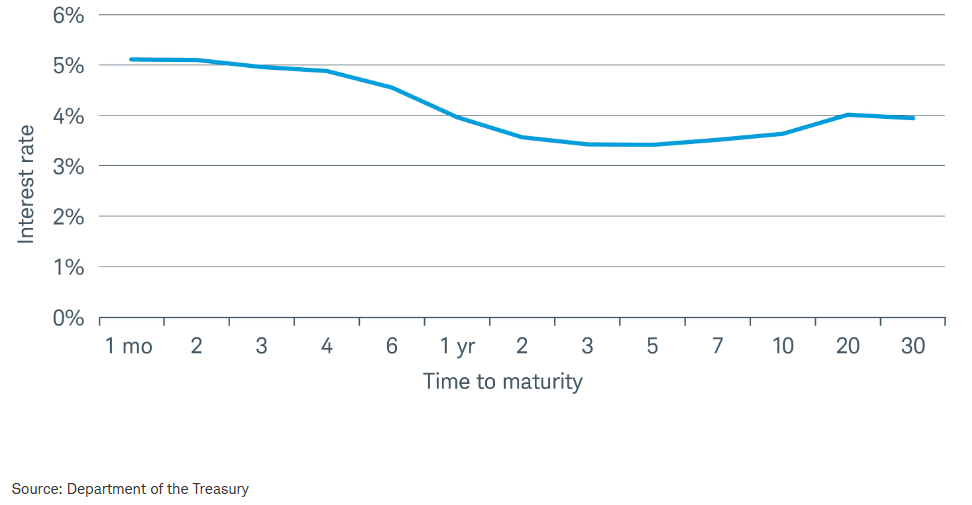
The chart below shows a curve with yields ranging from 5.11% for 1-month Treasuries to 3.94% for 30-year Treasuries. It doesn't show the current yield curve because the curve looks different every day.

Significance of the shape
The yield curve has three shapes: upward-sloping, or positive, downward-sloping, or inverted, and flat.
- A positive, upward-sloping yield curve means shorter maturity Treasuries have lower yields than longer maturities.
- An inverted, downward-sloping yield curve means shorter maturities are higher than longer maturities.
- A flat yield curve means yields for short- and long-term maturities are roughly equal. This usually occurs during the transition from positive to inverted or from inverted to positive.
The yield curve is normally in a positive slope because, in general, investors want more compensation when they loan money for a longer period of time. Also, positive-sloping curves tend to be associated with a positive outlook on the economy, which can lead to inflation and ultimately higher interest rates. And there's more event risk over longer maturities, so investors demand a higher yield to compensate.
But occasionally, shorter maturities have higher yields than longer maturities, so the slope of the yield curve turns negative, or inverted. An inverted yield curve can indicate that investors expect economic growth to slow.
How investors can use the yield curve
The Treasury yield curve is useful when making decisions about allocating funds, both for now and for the future because it may offer insight about where we're in the economic cycle of expansion and contraction.
Historically, inverted yield curves have been associated with a slowdown in the economy and potentially a recession. They indicate the market anticipates growth and inflation to slow over the longer term, which is often associated with lower yields. The advance signal can help investors manage portfolio risk, especially for equities that are sensitive to the business cycle. If investors expect a recession, they may choose to move money into defensive sectors like discount retailers and food processors, but those historical relationships can change quickly and may not always hold.
The shape of the curve itself, as well as how steep it is, can provide investors additional insight to consider.
Let's say the Federal Reserve announced it plans to cut interest rates. Officials at the Fed set what's called the federal funds rate, which is a key short-term interest rate that can affect savings yields and consumer loan rates. The Fed will try to avoid an economic slowdown by cutting rates because it can result in cheaper borrowing costs for individuals and corporations. It can also cause the yield curve to steepen with short-term rates falling faster than long-term rates. That's an event called a bull steepening.
A bear steepening, on the other hand, occurs when long-term rates rise faster than short-term rates. This may happen if people are expecting stronger growth and inflation. With both the bull and bear steepening, the yield curve takes on an upward slope, but the causes provide insight about whether the market sentiment is more optimistic or pessimistic.
Bottom line
The Treasury yield curve can help provide insight about market expectations for where interest rates, inflation, and the overall economy may be heading. It's only one data point and is by no means a predictor of the future, so it's important to use it in the context of other well-rounded research.
The information provided here is for general informational purposes only and should not be considered an individualized recommendation or personalized investment advice. The investment strategies mentioned here may not be suitable for everyone. Each investor needs to review an investment strategy for his or her own particular situation before making any investment decision.
All expressions of opinion are subject to change without notice in reaction to shifting market conditions. Data contained herein from third-party providers is obtained from what are considered reliable sources. However, its accuracy, completeness, or reliability cannot be guaranteed.
Examples provided are for illustrative purposes only and not intended to be reflective of results you can expect to achieve.
Investing involves risk, including loss of principal.
Past performance is no guarantee of future results.
Supporting documentation for any claims or statistical information is available upon request.
1024-YE2N
A message from Advisor Perspectives and VettaFi: To learn more about this and other topics, check out some of our videos.
© Charles Schwab
Read more commentaries by Charles Schwab