Visions of Sugar Plums and Soft Landings
Membership required
Membership is now required to use this feature. To learn more:
View Membership BenefitsRising real interest rates invariably trigger recessions. The residual impact of pandemic related behaviors delayed the impact in this cycle. Normally plunging auto sales, rising layoffs, and soaring foreclosures quickly slow the economy. This year auto and labor shortages combined with a record percentage of fixed rate mortgages and accrued savings insulated consumers. Businesses had also fixed a huge portion of their debt at record low rates. Instead of the usual economic drag, higher rates boosted the net income of those businesses and households with fixed rates debt and accumulated savings.
Growth was further supported by government spending. The Inflation Reduction and Infrastructure Acts fueled hiring and wage hikes. Recent rate hikes have primarily damaged the balance sheets of banks and the federal government. Unlike consumers and businesses, banks and the government have the ability to conduct business as usual for a while. The first serious impact to the economy was failure of Silicon Valley and other banks this spring. The government bailout reversed the initial damage and temporarily revitalized stock and bond prices. The can was kicked down the road another couple of months but economic growth will be dragged down for years by insolvent banks and soaring interest costs on government debt. Until the last few weeks delusional investors overwhelmingly accepted the soft landing fantasy where growth continues while inflation magically declines.
The rise in rates reduced the value of bank assets by over a half trillion dollars. Regulators permit banks to ignore those losses as long as they can maintain sufficient capital and deposits to fund the assets on their books. Bank deposit costs are rising toward 5% while portfolio losses are compounded by assets consisting of sub 3% mortgage-backed bonds and government debt. Every day the losses increase making it more difficult for banks to pay depositors competitive rates. Recognition of the unrealized portfolio losses would cause most banks to fail. Regulators bailed out the banks this spring but are now pushing banks to increase capital levels. Those requirements will dramatically reduce the lending capacity of affected banks.
Following the 2017 tax cuts the US Treasury (unlike homeowners and businesses) moronically replaced maturing long-term debt with short term borrowings to save a fraction of a percent on annual interest costs. Now those interest costs have more than doubled and one third of the $30,000,000,000,000 plus in outstanding national debt must be refinanced in the next three years. Trump and Biden may accuse each other of deficit increasing policies, but now the fastest growing component of government expenditures is interest. Who will buy the bonds to finance that debt? Banks purchased a large portion of US government debt when the Fed supplied them deposits at zero interest, now the government must bail them out, further increasing the deficit. The other big buyers like the Federal Reserve, China, and Japan have all started selling TBonds. Getting US households to pick up the slack by reducing spending and selling stocks will require interest rates to remain above inflation for years. Conversely a recession serious enough to deliver big rate cuts would only increase deficits. Tax collections would fall and government spending would rise. The only question is whether the outcome will be recession or stagflation.
Inflation
It usually takes 18 to 36 months after short term rates rise above inflation before the inflation trend is reversed. The only time the FED successfully pivoted to lower rates in advance of recession was in the 1990s when rapidly expanding globalization held down consumer prices. From 2018 through 2021 the combination of ever rising deficits funded with ever faster money growth and rate cuts made 5%-7% inflation inevitable by 2022. Last year was unusual. The entire 6% annual rise in consumer prices occurred before June as supply change issues coincided with the impact of the invasion of Ukraine. Most investors are unaware that consumer prices actually fell between June and December. This statistical anomaly created the illusion that inflation continued to trend lower in 2023, when in fact prices rose at an almost a 5% annual rate in the first half of the year. The bottoming of CPI at 3% in June was a statistical anomaly that should have been no surprise to our readers.
Annual inflation will continue to fall through June as a result of the sharp reduction of inflation in the last half of 2022...That is likely to reverse as the year progresses. The 70% Solution – December 2022
That anomaly will reverse in August when the July data is released. Year over year inflation is likely to trend higher for the remainder of 2023 supporting further credit tightening. The 70% Solution – June 2023
Until a few weeks ago delusional investors remained confident that falling inflation would allow the FED to cut rates early this year in the absence of a recession. The Fed has no tools to reduce inflation trends significantly without economic pain. Rising rates were already slowing growth early this year despite continued hiring driven by the Infrastructure and Inflation Reduction Acts. The pressure on banks set the stage for recession until the government stepped in with the bailout. Now banks are tightening credit again as they attempt to restore capital adequacy.
Supply chain issues and the Ukrainian invasion caused inflation to spike above trend last year, unlike this year’s dip to 3% in June. Year over year CPI is back up to 3.7% as the statistical anomaly reverses and rising prices for gas, diesel, and jet fuel add to union wage settlements and government pay hikes. In addition, ongoing tariffs, rising food, insurance, and medical costs, as well as auto strike effects are all in the pipeline. We are now back on trend towards 4% inflation in 2023. CPI is however unlikely to jump much higher. Shelter (mainly residential rent) is about a third of CPI (closer to 40% of core CPI). Rents are falling in major cities like San Francisco and Portland (down 2.4% in California this year). Downward pressure will persist as a massive number of new multifamily dwellings come to market.
Only a small portion of the shelter component reflects actual rent increases. Most of the index is something called Owner’s Equivalent Rent (OER), because most Americans own their own home. The OER survey asks homeowners what they think their homes will rent for. Unlike big cities where major landlords face weak demand, the rental market in suburbia where owners live is still strong. The FED often reminds us that CPI is not their primary target.
The FED focuses the less volatile core PCE deflator (excluding food and energy). However, the core deflator is expected to show even bigger year to date gains than headline CPI when the August data is released soon. It excludes food and energy cost, but only gives half the weight to shelter. Conversely, the deflator doubles the weight of healthcare (which the PCE bases on Medicare reimbursement rates). Those rates lag actual price changes by up to a year. A lot of actual inflation is already built into the future statistical pipeline.
In the near future, any relief in CPI from soft rents may be offset by healthcare in the PCE deflator. Rising food and energy prices may not directly impact the deflator, but over time they raise other prices. A perfect example of the lagged effects of rising costs is the notice I just received from the water company. They have requested a 25% increase in fees in 2025 (plus additional 4%+ increases 2026 & 2027) from the Public Utility Commission in the Peoples Republic of California. At the present time both CPI and the Core PCE deflator are converging in a 3%-5% range. Only a recession will reduce the midpoint of that range.
Interest Rates
Over time interest rates track inflation and economic growth. Over shorter periods central bank (FED) policies as well as exogenous events like wars, pandemics and strikes create significant deviations. The FED attempts to fulfill its dual mandates of full employment and low inflation by adjusting bank reserves through the sale and purchase of bonds to achieve short term interest rates consistent with those occasionally contradictory goals. As economist Milton Friedman famously noted, those policies have “long and variable lags”. Trillions of bonds purchased by the FED during the last 15 years resulted in the lowest real interest rates in 5000 years. The FED will undoubtably reflate when the recession hits, but we will not see those low rates again in our lifetime. The overnight Fed funds rate has averaged the same level as the consumer price index historically. Similarly, 10 year TBond yield on average mimics nominal GDP (growth plus inflation). Reducing inflation requires short term rates to be at least 1% above normal. Overnight rates currently around 5.25% and 10 yr TBond yields at 4.60% represent 15 year highs. These yields are consistent with current inflation and growth outlooks in a period where the FED is focused on reducing inflation. That is true irrespective of whether or not you subscribe to the prevailing 2023 investor fantasy. That fantasy assumes that inflation will drop back near 2% while the economy manages to grows at a similar pace. I consider it a lot more likely that inflation will persist around 4% while the economy stalls or sinks into recession. That said, the recent rise in yields makes bonds investable (unlike most of the past 15 years). Current interest income is keeping pace with inflation and is likely to be sufficient to offset the risk of temporary principal losses if rates rise further.
Despite marginally acceptable fundamentals, somewhat higher rates remain likely in the future. Investors have started to realize markets will soon face a tidal wave of bond issuance. Unlike homeowners, rates on a huge portion of corporate debt were only locked in for 3 to 5 years. Billions of corporate bonds will have to be refinanced at higher rates in the next few years. That amount is a drop in the bucket compared with about one third of the thirty odd trillion dollars of national debt that was financed short term. Those bonds are coming due in the next three years. Bonds issued to refinance that debt will keep rates at or above fundamentally normal levels for years.
As if soaring bond supply isn’t enough, bond buyers are in retreat. The FED is selling (rather than buying) US TBonds as are the central banks of China and Japan. Commercial banks facing increased capital requirements and high short term rates will not only curtail bond purchases but will have to borrow in the bond market to meet the new capital requirements. The sole remaining bond buyers will be investors attempting to lock in yields if recession becomes likely. In that environment bonds are extraordinarily cheap relative to stocks. A “bear market” bond rally could temporarily reduce 10 year TBond yields to below 4.25%.
The interest rates that drive the economy, like fixed rate home, auto, and business loans aren’t coming down enough to revitalize the economy any time soon. The drag from high labor costs, rising consumer prices and high long term interest rates will cause growth to stall. Only months after we enter recession will inflation retreat sufficiently to sustain bond yields significantly below current levels.
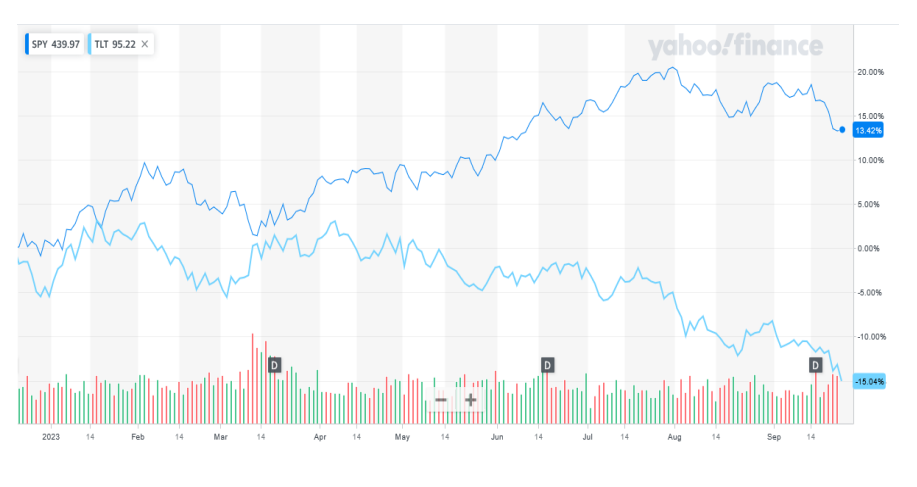
The chart on the next page compares the change in the relative price of long maturity government bonds (TLT ETF) with US stocks (SPY ETF) from mid-January until now. SPY is up over 13% while TLT is down over 15%. That 28% underperformance of bonds creates room for a bear market rally in bonds, triggered by recession risks. Those possibilities combined with current yields justify a small (less than 10%) exposure to long term bonds at current prices. Any dip in rates is likely to be transitory, but for the first time in more than a decade large additional rate hikes are not a foregone conclusion. That said, the safer bet remains TBills or money market funds for most of your portfolio.
Banking Crisis – Defused, not Resolved
The bailout kept hundreds (if not thousands) of insolvent banks sufficiently liquid to continue operating. The bailout triggered a short-lived bear market bond rally that provided false hopes for balance sheet recoveries. It bought these zombie banks a little time, but now the rally has evaporated. The banks remain open but costs are rising. Ongoing losses have replaced profits that were dependent on zero cost deposits. The trend is relentless, as more and more depositors demand higher interest rates. Issuing subordinated bonds to meet the increased capital requirements and tightened lending standards will compound the losses. These subordinated bonds will be very expensive for banks because banks suffering future losses will be required to convert bondholders to stock holders before any losses are suffered by depositors, the FDIC, or taxpayers.
For those banks that survive the increased costs, raising capital by issuing bonds will eliminate the risk of additional losses from higher rates. Unfortunately, most banks risk other losses from exposure to defaulting loans on commercial office buildings. Like the portfolio losses from rising rates, banks have considerable latitude to partially kick the can down the road by restructuring the loans. Any losses that are recognized will however further impair capital. In order to avert another banking crisis, regulators will arrange shotgun marriages with stronger banks. The losses will ultimately fall on the FDIC, and taxpayers. Some large banks will benefit from acquiring weaker banks at fire sale prices and the reduced competition. Despite those benefits, aggregate bank profits and lending will both continue to fall as the pre-bailout credit tightening resumes.
Conclusions
Investors were encouraged this year as the gap between the statistical anomaly cited earlier slowed “reported inflation” while the decline in corporate profits was smaller than expected following the bank bailout. Inflation is once again rising now that the anomaly is in the rearview mirror. Unemployment remains low, but job openings mostly reflect mismatches with available skills. The pace of wage hikes has slowed adding additional pressure on consumers. Consumers are beginning to feel the impact of rising rates on their credit card bills and auto financing terms compounding the stress from rising consumer prices. Consumer spending is slowing, despite ongoing government spending from the Infrastructure and Inflation Reduction Acts.
In the near term, government stimulus will be impeded by a combination of a looming government shutdown, the October 15 tax date and the auto strike. Those effects will fade before year end but the resumption of student loan payments and the fact that all but the 20% wealthiest Americans (who are unlikely to spend the remaining money) have depleted the savings accumulated during the pandemic will be a continuing drag on consumers already stretched by rising prices. Credit card and auto loan delinquencies are rising. Ongoing pressures from rising medical, utility and insurance costs driven by the pass through of recent wage hikes, energy costs, and this year’s catastrophic losses are likely to keep consumer prices rising at a 3%-5% range. Inflation hovering around 4% while growth decelerates to zero (stagflation) appears to be the most likely outcome in 2024 as the administration front loads previously approved multiyear appropriations into the pre-election economy. This would be negative for bonds and disastrous for stocks. There is a real possibility that a recession reduces inflation to the lower 3% band. This outcome would be even worse for stocks, but bullish for bonds from current levels.
Corporate profits squeezed by either stagflation or recession, combined with tight credit conditions make stocks a risky bet. A portfolio concentrated in money market funds with a sprinkling of bonds are a better option. The biggest risk to investors employing this strategy is that they will become too comfortable with money market yields to take advantage of what will become a great stock buying opportunity.
Sincerely,
Clyde Kendzierski
Disclosure
FINANCIAL SOLUTIONS GROUP LLC FSG provides portfolio management investment advisory services to individuals, trusts, retirement plans, companies and institutions.
FSG manages client funds according to proprietary strategies developed by Clyde Kendzierski, Chief Investment Officer to manage his own retirement funds.
Please call (562) 430-2223 to learn more about how FSG can serve you.
Many Stock Brokers, Financial Planners, and Accountants are also registered as Investment Advisors.
Our programs are often misperceived as competitors to their business.
FSG maintains relationships with other advisors and are pleased to include additional qualified advisors in our programs to expand their business and enhance their clients’ long-term returns.
Unless otherwise indicated, investment opinions expressed in this newsletter are based on the analysis of Clyde Kendzierski, Managing Director and Chief Investment Officer of Financial Solutions Group LLC, an investment adviser registered with the California Department of Business Oversight. The opinions expressed in this newsletter may change without notice due to volatile market conditions. This commentary may contain forward-looking statements and FSG offers no guarantees as to the accuracy of these statements. The information and statistical data contained herein have been obtained from sources believed to be reliable but in no way are guaranteed by FSG as to accuracy or completeness. FSG does not offer any guarantee or warranty of any kind with regard to the information contained herein. FSG and the author believe the information in this commentary to be accurate and reliable, however, inaccuracies may occur. Investors should consider the charges, risks, expenses, and their personal investment objectives before investing. Please see FSG’s ADV Part 2A containing this and other information. Read it carefully before you invest. Past performance is a poor indicator of specific future returns. It, however, may be useful in your evaluation of how FSG performs in different market environments.
Investors have the ability to achieve results similar to benchmark indices by investing in an index fund or Index-tracking ETF, typically with lower fees.
Past performance of any security is not a guarantee of future performance. There is no guarantee that any investment strategy will work under all market conditions. There is no guarantee that the investments mentioned in this commentary will be in each client's portfolio.
This material is intended only for clients and prospective clients of FSG. It has been prepared solely for informational purposes and is not an offer to buy or sell or a solicitation of any offer to buy or sell any security or other financial instrument, or to participate in any trading strategy.
This material is intended only for clients and prospective clients of the FSG. It has been prepared solely for informational purposes and is not an This circumstances material and does not objectives provide of persons individually who receive tailored it. The investment strategies advice. 7 and/ or It has investments been prepared discussed in without this regard material to may not be suitable for all investors. No mention of any security or strategy should be taken as personalized investment advice or a specific buy or sell recommendation. Please contact FSG to discuss your specific financial situation and suitability.
S&P 500 Index is an unmanaged, market value-weighted index of 500 stocks generally representative of the broad stock market. Performance results reported herein were achieved in an actual account managed by FSG. This account serves as a model portfolio for FSG’s Diversified Sector Program. This account belongs to Clyde Kendzierski, Managing Director and is not charged advisory fees. Results reflect the net return in this account after expenses including commissions, fund management fees, and redemptions charges, if any, and reflect the reinvestment of dividends and other earnings. Performance returns are presented against the S&P 500 to show material economic and market conditions present during the period of time that FSG’s performance is presented and is not meant to serve as a comparative index. The S&P 500® is an unmanaged capitalization-weighted index of the prices of 500 large-cap common stocks actively traded in the United States. These results have not been audited. However, some results have been independently calculated and verified by an unaffiliated accountant. Where applicable, documentation is available by request.
Most clients utilize our Diversified Sector Program for at least a portion of their portfolio. Individual client strategy blend is determined by client’s age, risk tolerance, goals, and other assets as well as other factors. Increased risk offers the potential, but not the guarantee of higher returns. Investments aligned with this strategy offer the potential for loss. Actual client returns will reflect the deduction of advisory fees as described herein and in FSG’s Form ADV Part 2A. No two accounts will necessarily achieve the exact same returns, as there are factors that are unique to each account. However, whenever possible, every effort is made to transact in client accounts simultaneously with those in the model portfolio, at the same price with the same fees (if any). Reasons that actual returns in individual client accounts may differ from others or the model include:
Addition or withdrawal of client funds - This is especially true for new accounts during the first ninety days after an account is opened. Portfolios are not adjusted instantaneously to correspond with the model. Investments are phased in or out, as opportunities occur during subsequent weeks in an attempt to optimize the benefit to the client. The occasional or periodic withdrawal or addition of funds by the client will distort the allocation within the account between asset classes resulting in performance results that vary from the model accounts.
- Taxable Status of Account Whether funds are held in a taxable or non-taxable account will affect performance. The Diversified Sector Program was created originally for tax-exempt or tax-deferred accounts. However, a version of the same strategy is employed for taxable accounts. The model account for this strategy is an IRA account. Few distinctions with regard to positions are made between taxable and non-taxable accounts.
- Waiver and timing of all or some advisory fees - The actual timing of the deduction of advisory fees in a client account may differ from the timing in the model account. This may create a disparity between the asset allocation and position allocation of the client account versus the model account. • Different fee schedules based on asset size - FSG model returns are calculated according to the highest fees charged. Someactual fee schedules may be lower.
- Technical trading errors - Trade errors are corrected according to the guiding principle that the client always be madewhole.
- Different commission rates - This fee is primarily generated in FSG accounts when trading in ETFs and is charged directly to the client by the brokerage firm. FSG does not participate in these commissions.
- Performance of securities transferred into accounts by clients and brokerage commissions incurred from the sale of these securities - Some "legacy assets" may remain in the account indefinitely if the fees associated with their sale do not justify their saleor client instruction prohibits their sale.
- Restrictions on holdings in accounts - Restrictions on holdings will prohibit the matching of performance. Whether the restrictions are imposed by the client directly or via the nature of the account, FSG’s inability to align the client’s account with the model account will result in a performance dispersion. Additionally, holdings requested by clients to be maintained in their account(s) will cause the performance of the account(s) to vary from the model account used.
Some restrictions on mutual fund transactions may be imposed by the mutual fund companies. These restrictions are the result of prohibitions regarding short term sales (usually a buy and sell in the same fund within 30 days and typically triggered by the addition or withdrawal of funds in the client account). FSG attempts to avoid these restrictions when possible.
Account size - The proportional effect on performance of fees and expenses accounts of varying size will be lesser or greater than the effect in the model account.
In most cases, clients should achieve returns similar to the model portfolio (after adjustment for fees) in accounts over $250,000 that have been established for over 90 days with no additions or withdrawals of funds during the period being measured.
This material is intended only for clients and prospective clients of the FSG. It has been prepared solely for informational purposes and is not an offer to buy or sell or a solicitation of any offer to buy or sell any security or other financial instrument, or to participate in any trading strategy.
This material does not provide individually tailored investment advice. It has been prepared without regard to the individual financial circumstances and objectives of persons who receive it. The strategies and/or investments discussed in this material may not be suitable for all investors. No mention of any security or strategy should be taken as personalized investment advice or a specific buy or sell recommendation. Please contact FSG to discuss your specific financial situation and suitability.
It is always the intention of FSG to minimize any negative effect on clients. Our success in that effort is subject to unanticipated market conditions. Consequently, past performance does not guarantee future returns.
THE 70% SOLUTION REPRODUCTIONS: Email forwarding and/or complete reproductions are authorized (must include complete attributions and disclosures). All partial quotes from The 70% Solution must include the source of your quote and reference to Financial Solutions Group LLC (FSG), the author’s name, and the following web address: www.financial-solutions-group.com. With the exception of complete reproductions and email forwards, please write to [email protected] to inform FSG of the time and location of the reproduction.
Copyright © 2013, Financial Solutions Group LLC. ALL RIGHTS RESERVED. FSG is not liable for any actions taken in reliance on information contained herein.
A message from Advisor Perspectives and VettaFi: To learn more about this and other topics, check out our most recent white papers.
Membership required
Membership is now required to use this feature. To learn more:
View Membership Benefits