2023 Mid-Year Outlook: U.S. Stocks and Economy
Membership required
Membership is now required to use this feature. To learn more:
View Membership BenefitsA broadening out in market performance would help bolster a more sustainable stock rally, but that hinges on increasing clarity for monetary policy, recession risk, and bank stress.
Before getting to our outlook for the second half of this year, let's "report card" our 2023 outlook, published in late November last year. There were four categories covered in our outlook: Federal Reserve policy/inflation, the economy, the labor market, and stock market behavior.
Report card
One expectation we had, which doesn't fit neatly in any of the four categories, was that concerns about government debt would become a larger part of the 2023 conversation. Sadly, we were right about that, even with the recent deal to avoid a debt default.
With regard to the Fed, inflation, the economy, and the labor market, what we expected has largely panned out. Inflation has continued to trend down, the Fed is not poised to pivot to rate cuts any time soon, leading economic indicators have weakened further, more cracks have appeared within labor market data, and the concept of a "rolling recession" continues to define economic activity.
In terms of the stock market, we believed the first half could bring some rougher sledding if the economy weakened notably, giving way to a sunnier second half. Along with that, we anticipated that last year's outperformance by equal-weighted indexes relative to cap-weighted indexes would likely persist. We missed the boat to some degree on that. As will be detailed below, cap-weighted indexes like the S&P 500 and Nasdaq have had a strong first half, driven by a concentration of performance among a small handful of mega-cap stocks.
That said, performance under the surface has indeed been more connected to the macro uncertainties that persist. In addition, as we expected, quality-oriented factors (like strong free cash flow, healthy balance sheets, and positive earnings trends) continue to perform well, which has likely been aided by large-cap outperformance this year.
We also expected that the compression in profit margins and the rolling nature of earnings deterioration among sectors would persist. In addition, stabilization in either ISM surveys or housing could help stabilize earnings. We have started to see improvement among a number of housing indicators, but the recent downtick in the ISM non-manufacturing survey suggests we haven't hit the stabilization point yet.
What say you, Fed?
We are a bit handicapped with regard to the Fed policy outlook given the publishing of this commentary is two days before the June Federal Open Market Committee (FOMC) meeting. As of this writing, the market is anticipating a pause in the Fed's rate hiking cycle, with the FOMC leaving the door open for at least another rate hike.
Perhaps more important is our view that regardless of whether the "terminal rate" (the stopping point by the Fed) is one or two hikes from the current level, we do believe the Fed will not be pivoting to rate cuts this year—absent a significant contraction in the economy and/or more serious turmoil in the banking system. Importantly, if inflation continues to trend lower—and the Fed keeps rates elevated—a pause could be seen as a tightening given that nominal rates would remain steady, but real rates (nominal minus inflation) would rise.
Lower leading indicators
A frequent feature of our work is the Leading Economic Index (LEI) from The Conference Board, not least because of its solid track record in leading the economy (both at the top and bottom) and the depth and breadth of its 10 components. Regular readers know we've been pointing out weaknesses in the LEI for quite some time. As shown below, its decline from the peak (reached 16 months ago) has extended to nearly -10%, which is consistent only with prior recessions.
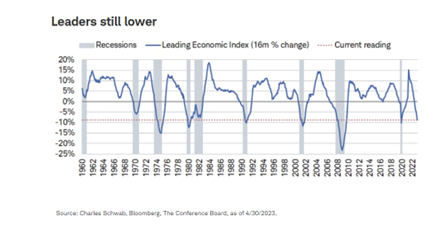
As is the case with all economic (and market) data these days, it's crucial to look under the surface of the index. Over the past six months, the non-financial components within the LEI have been the primary drivers of weakness. Taking it one step further, surveys have been the main culprits. One of those is the new orders component within the ISM Manufacturing survey, which is essentially a proxy for demand. That component has been contracting for nine consecutive months (the longest streak since the Global Financial Crisis), which has put downward pressure on the overall index.
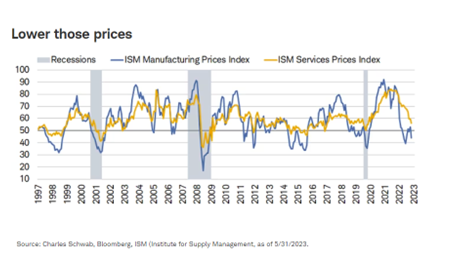
ISM prices signal lower inflation
An additional weight on activity (this time, in a good way) for both manufacturing and services has been the price component—the proxy for inflation pressure. As shown in the chart below, prices within the manufacturing sector have fallen into contraction; services prices are easing but not yet contracting. The good news—which we expect to continue—is that this bodes well for the direction of inflation, but the rub is twofold. First, the decline in ISM services prices hasn't yet led to a similar decline in core services inflation metrics (which the Fed watches closely). Second, should a significant decline in both ISM price components occur, it could become consistent with a recession (as shown by history).
Getting inflation back in the bottle without a commensurate uptick in unemployment has been the Fed's goal throughout its hiking cycle. We continue to think it will be difficult to achieve. Not only is hotter inflation proving more stubborn and challenging to vanquish, but the labor market continues to show some notable cracks.
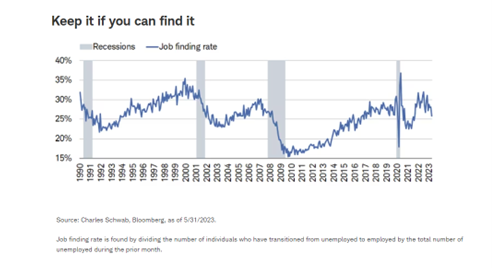
More labor market cracks
As shown in the chart below, the job-finding rate—which shows how many individuals who were previously unemployed are now able to find a job—has started to roll over and is at its lowest since September 2021. That's consistent with the average in a couple of years leading up to the pandemic, but the magnitude of the decline from the recent peak is increasingly reminiscent of recessionary behavior. If the rate continues to move lower, and jobless claims move higher, we'd expect cracks in the labor market to widen, giving way to weaker (if not negative) payrolls.
Key to remember, though, is the fact that labor data often look quite mixed (and sometimes confusing) at the start of recessions. A case in point is the table below, which shows the monthly gain in nonfarm payrolls at the start and end of all recessions since the early 1950s. Unsurprising is the fact that payrolls are often in purgatory when a recession is nearing its end, as the labor market is struggling markedly at that point. Going against conventional wisdom, though, is that there have only been two instances in which payrolls declined at the start of the recession (those that started in 2001 and 1990). In all other instances, jobs were still being created even though downturns were underway.
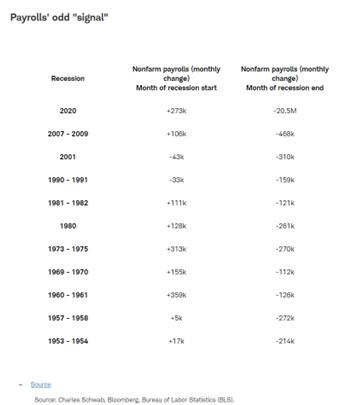
Most interesting are the cases of the early 1960s and 1970s, in which payroll growth was exceptionally strong as recessions began. In fact, for the recession that started in 1973, payrolls grew for eight straight months after the month of the recession's start. That reinforces the fact that we shouldn't look to just payrolls (or any single data point) as the sole determinant as to whether the economy is in a recession.
It also reinforces the reality that it's too soon to claim victory that a soft landing has been achieved. It might seem that way now, but that argument would be more compelling if the Fed's preferred inflation gauge (core PCE services ex-housing) wasn't stuck hovering at a 4.6% annual rate. While we think the path of least resistance for inflation is down for the remainder of the year, there is no question that the quest to the Fed's goal of 2% will be challenging. That likely supports our higher-conviction view that the Fed will opt to stay at a restrictive level of rates after hikes have concluded (which is still to be determined at this point).
If Fed pauses, then what?
I (Liz Ann) wrote a recent column for the Financial Times on the subject of how the stock market has performed once the Fed ends a rate hike cycle. In it, I shared that, yes, there has been an "average pattern" associated with the history of stock market behavior around final rate hikes, as shown below.
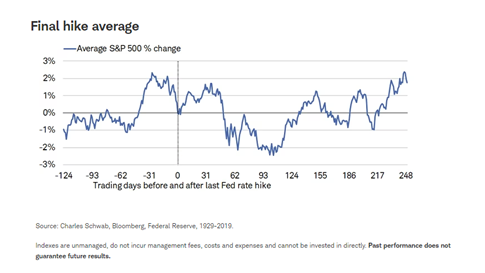
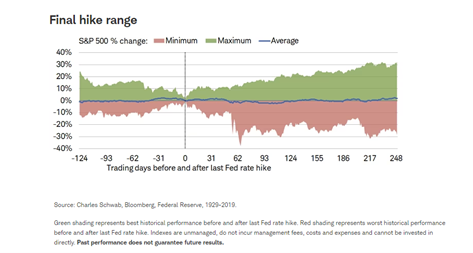
However, shame on anyone using only that average to anticipate what might happen to the market in this cycle. Shown below, there has been an extraordinarily wide range of outcomes in the 14 rate hike cycles since the S&P 500's inception in 1928—generally in the range of +30% to -30% over the span of the 12 months following the final hike. It highlights that there are always myriad influences on market behavior—not just monetary policy. But it also reinforces one of our favorite adages: Analysis of an average leads to average analysis.
Credit crunch on the horizon?
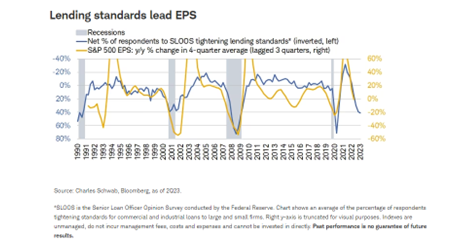
Regardless of the timing of the Fed's final rate hike, lending standards have clearly tightened into recession territory based on history, as shown below. This tightening has implications for what is arguably the most important direct fundamental underpinning the stock market: corporate earnings. Based on historical lags of around three quarters, the tighter lending environment suggests more downside to S&P 500 earnings.
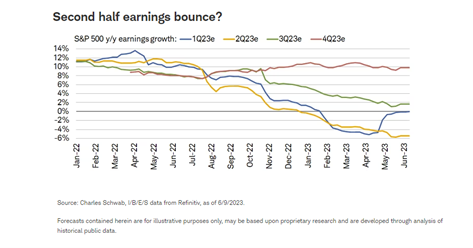
Earnings estimates for 2023 have indeed been under pressure; although as shown below, the bar was ultimately set too low for first-quarter earnings—hence the hook-up in the blue line as earnings season came to a close. Second-quarter earnings are expected to be down at least 5%, with an expected lift into positive territory in the second half (particularly in the fourth quarter).
As noted, there is a strong historical relationship between lending standards and earnings growth (or lack thereof); which suggests some downside to second-half S&P 500 earnings estimates. Also consistent with lower estimates from here is still-depressed business confidence (per The Conference Board), and ongoing weakness in the ISM surveys. We also believe profit margins will remain under pressure amid weak productivity, high unit labor costs, and real revenue growth now in negative territory (i.e., all of the increase in revenue growth so far this year has been price, with unit sales in decline).
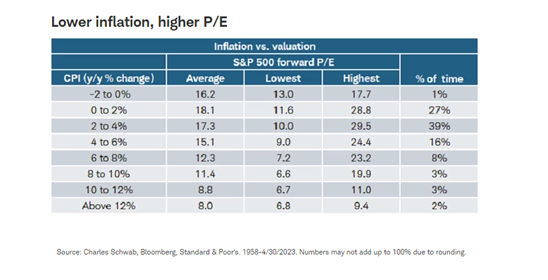
Valuations' mixed drivers
As shown below, inflation has historically been a key factor in how stocks have been valued. The sweet spot has been when inflation (via the consumer price index, or CPI) has been in and around the Fed's target of 2%. Last year's CPI spike to more than 9% put significant downward pressure on market multiples. Although disinflation supports higher multiples (and trends matter as much as levels), any further decline in forward earnings estimates may boost multiples to an uncomfortable degree.
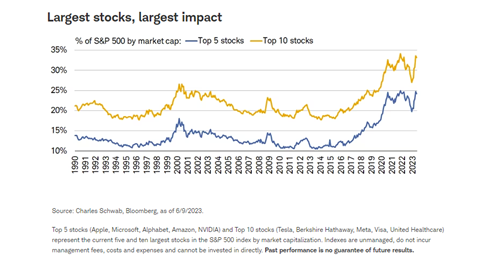
The top-heavy market needs to lose some more weight
As mentioned at the outset of this report, stock market performance became "top-heavy" for the better part of this year's first half. As shown below, the top 10 stocks recently represented about one-third of the S&P 500; with the top five representing nearly one-quarter. Those percentages are even higher than at the peak of the dot-com bubble of 2000.
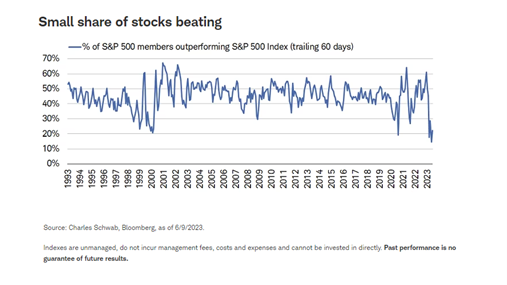
It's not uncommon for the largest cap stocks to dominate performance among cap-weighted indexes like the S&P 500 or Nasdaq; but when the majority of member stocks are underperforming the index, concentration risks become elevated. Here we are starting to see some welcome improvement and will be keeping a keen eye on its persistence heading into the second half. As shown below, as of the end of May, a post-1990 record low of only 15% of S&P 500 stocks were outperforming the overall index over the prior three months. Through Friday, June 9, that had improved to 24%. If this continues to improve, it would bode well for a continuation—and broadening out—of the rally.
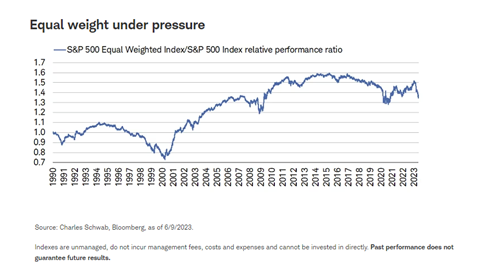
Also healthy would be a reversal back higher in terms of equal weight vs. cap weight, shown below for the S&P 500. In fact, historically when concentration has become extreme, it tends to correct by equal weight playing some catch-up. We are also seeing stronger participation from the beleaguered small-cap stocks, which would aid an overall breadth improvement. One tip for investors on that note: although the Russell 2000 is the more common small-cap benchmark, the S&P 600 small-cap index uses a profitability filter; as such, it may be a better starting source for potential smaller-cap opportunities.
AI kicker
We will be writing about artificial intelligence (AI) in future reports, but needless to say, it's been a significant kicker in terms of performance bias up the capitalization spectrum. What we already know is that AI is a "general purpose technology" which has applications in most industries and/or activities (including "thoughts"). The adoption of ChatGPT hit 100 million users in a record-low time of only two months, and it's not hyperbolic to say it will have a significant impact on how we all live and work. It's also likely to have profound impacts on productivity and perhaps longer-term inflation (or disinflation) trends. The rub is that the timing of all of this is uncertain, even if the enthusiasm is certainly elevated.
As to whether AI represents a bubble, similar to the internet/dot com era of the late-1990s, there is some good news. So far, the AI euphoria has been concentrated in a small subset of stocks, which are directly benefiting from the technology (think the early 1990s, not late 1990s), and more reasonable valuations (Nasdaq 100's forward P/E is less than 30 today vs. more than 100 in early 2000).
Frothy sentiment building?
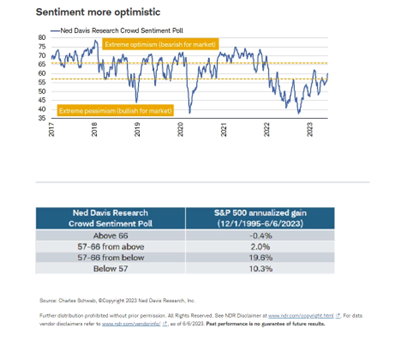
One budding risk heading into the second half is investor sentiment. We look at myriad sentiment indicators—both behavioral and attitudinal. Shown below is NDR's Crowd Sentiment Poll, which is an amalgamation of seven distinct sentiment measures. For now, it's in the best zone (based on history) for stock market performance, as you can see in the accompanying table. Put simply, an initial burst of optimism tends to be positive for stock market performance prospectively. The rub would be if rising optimism were to become excessive, which could shift the outlook to one of more volatility and/or bouts of weakness. We will be keeping a close eye on sentiment conditions as we transition to the second half.
In sum
A continued broadening out in terms of stock market performance would be a welcome sign for the bulls. The market is not out of the woods yet, however, and could experience bouts of volatility and/or weakness tied to ongoing Fed policy uncertainty, the risk of the rolling recession rolling into a formally declared recession, a lower trajectory for corporate earnings, and/or frothy investor sentiment. Remember, "fear of missing out" (FOMO) is not an investing strategy…stay disciplined.
The information provided here is for general informational purposes only and should not be considered an individualized recommendation or personalized investment advice. The investment strategies mentioned here may not be suitable for everyone. Each investor needs to review an investment strategy for his or her own particular situation before making any investment decision.
All expressions of opinion are subject to change without notice in reaction to shifting market conditions. Data contained herein from third-party providers is obtained from what are considered reliable sources. However, its accuracy, completeness, or reliability cannot be guaranteed. Supporting documentation for any claims or statistical information is available upon request.
The examples provided are for illustrative purposes only and are not intended to be reflective of results you can expect to achieve.
The policy analysis provided by Charles Schwab & Co., Inc., does not constitute and should not be interpreted as an endorsement of any political party.
Investing involves risk including loss of principal.
Past performance is no guarantee of future results and the opinions presented cannot be viewed as an indicator of future performance.
All corporate names and market data shown above are for illustrative purposes only and are not a recommendation, offer to sell, or a solicitation of an offer to buy any security.
Diversification does not ensure a profit and does not protect against losses in declining markets.
Schwab does not recommend the use of technical analysis as a sole means of investment research.
Source: Bloomberg Index Services Limited. BLOOMBERG® is a trademark and service mark of Bloomberg Finance L.P. and its affiliates (collectively "Bloomberg"). Bloomberg or Bloomberg's licensors own all proprietary rights in the Bloomberg Indices. Neither Bloomberg nor Bloomberg’s licensors approve or endorse this material, guarantee the accuracy or completeness of any information herein, or makes any warranty, express or implied, as to the results to be obtained therefrom and, to the maximum extent allowed by law, neither shall have any liability or responsibility for injury or damages arising in connection therewith.
Indexes are unmanaged, do not incur management fees, costs, and expenses, and cannot be invested in directly. For more information on indexes please see schwab.com/indexdefinitions.
A message from Advisor Perspectives and VettaFi: To learn more on this and other topics, check out our full schedule of upcoming CE-approved virtual events.
Membership required
Membership is now required to use this feature. To learn more:
View Membership BenefitsSponsored Content
Upcoming Virtual Events View All


