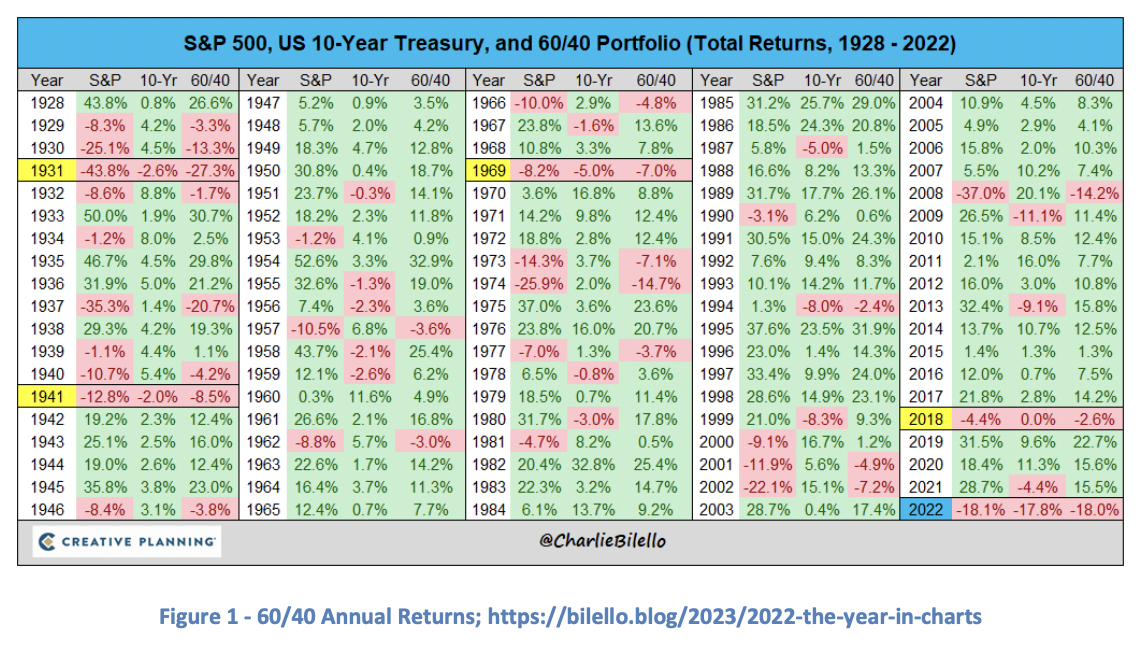
Despite the current rally in risk assets that includes US equities, we believe caution remains warranted. Below we look at the recent market bounce in the context of past bear markets. We also examine today’s prevailing economic and corporate context. But first, a review of the past year. 2022 was unprecedented. Literally. (And, not as the kids hyperbolically use that word. We mean literally in the way Merriam-Webster means it.) 2022 was the first time the S&P500 and the 10- Year Treasury bond both delivered negative annual returns below -10% in the same year. In fact, they respectively closed 2022 down -18.1% and -17.8%. For balanced investors, this meant it was the worst year since 1931 for a 60/40 portfolio. The table below provides the historical details.

Gold was the leading asset class during the fourth quarter up 10.6%. Equities performed well with US equities up 7.1% and global equities up 9.9%. Commodities were literally flat 0.0%. Bonds returns were very modest. A broad index of bonds (Barclays Aggregate; AGG) was up 2.2%. Long-dated US Treasury bonds were just slightly negative (less than 1/100th of a percent).
For the full year, commodities were the clear winner up 20.3%. Gold was essentially flat at 0.1%. Equities and bonds both had a miserable year. US equities were down -18.5% and global equities were just a basis point ahead down -18.4%. A broad index of bonds (AGG) fell -12.5% and the “safe-haven” long-dated US Treasury bond performed the worst – down -29.9%. To be fair to the long-bond, we should also note that more speculative equities did fare much worse. The Nasdaq-100 index fell -33% and the speculative ARK Innovation fund (ARKK) was down a staggering -67.8%.
The Grey Owl All-Season1 strategy finished the year down -11.1%. While a disappointing negative number, this is 4.9% better than a 60/40 benchmark and meaningfully better than any major equity index. 2
Bear Markets in Context
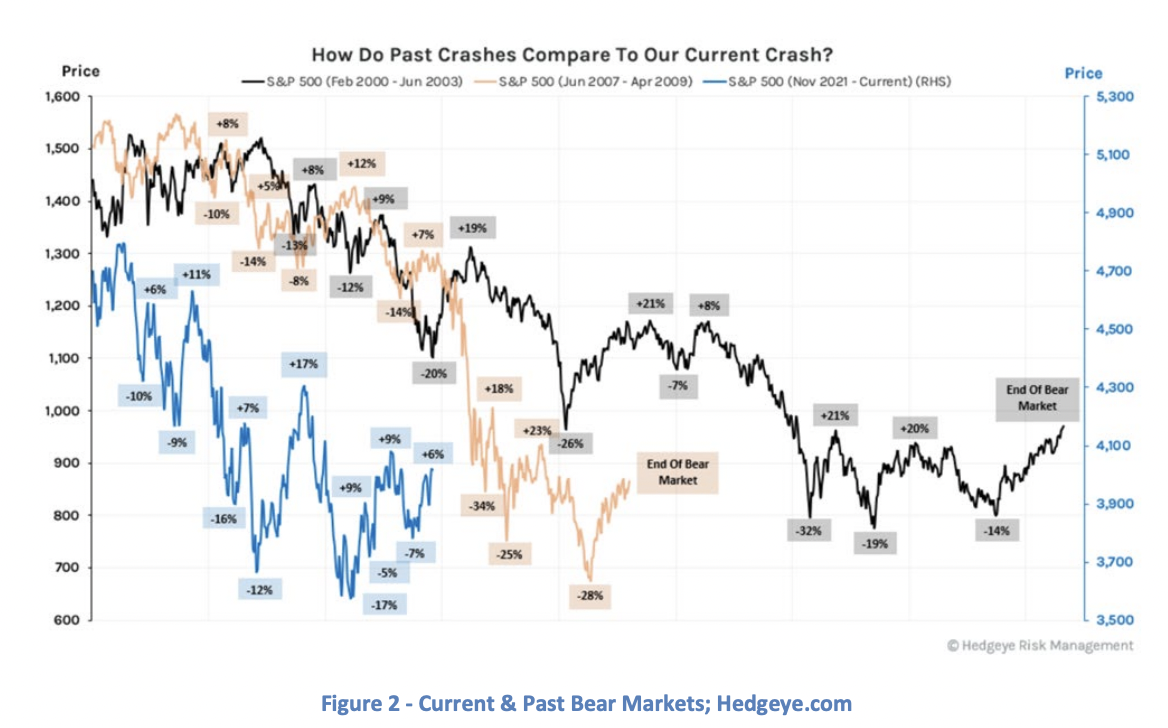
The chart on the next page juxtaposes the current bear market that began at the end of 2021 with the 2000-3 and 2007-9 bear markets. The key takeaway is that all bear markets have significant rallies in the midst of the bear market. Just because there is a high-teens percentage rally, does not mean the bear market is over.
Economic Growth
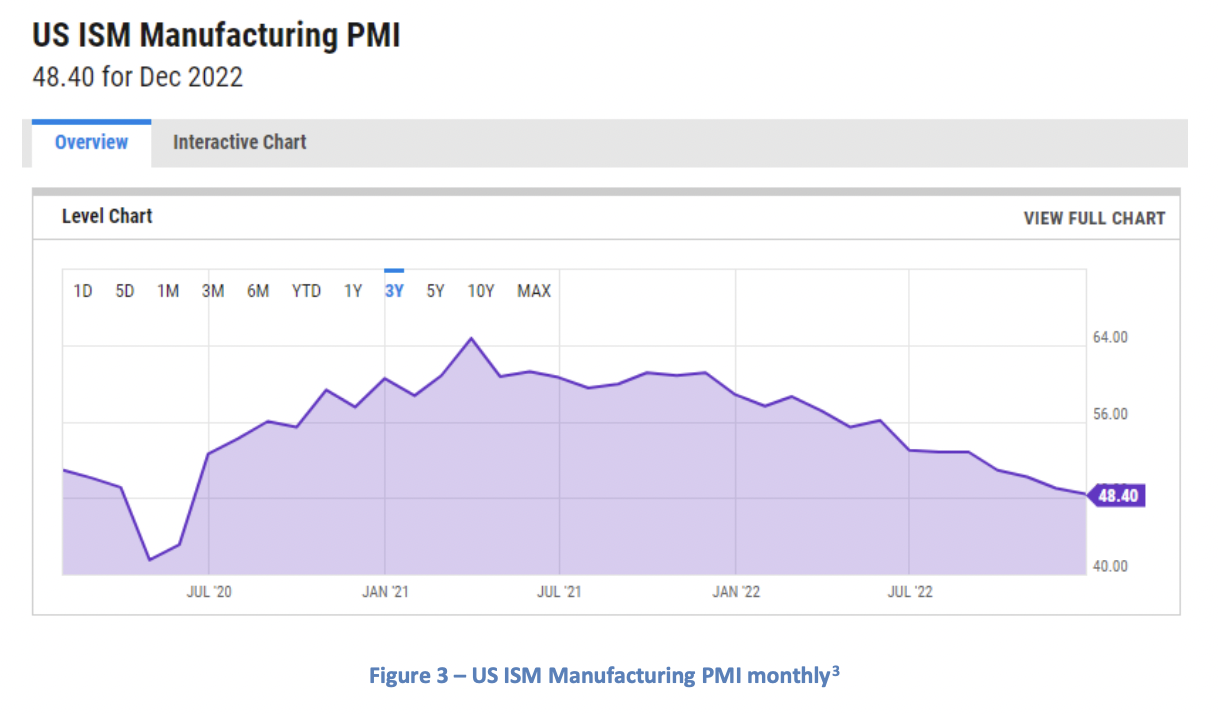
For the last several letters, we shared a chart of the US ISM Manufacturing Purchasing Manager Index (PMI) to provide a single datapoint that summarizes the state of the US economy. The PMI is a “diffusion index” which aggregates survey data from decision makers throughout the manufacturing economy. The questions are around the managers’ expectations (e.g. “do you plan to acquire more or less inventory next month compared to this month) and are thus a leading indicator of economic activity.
For approximately a year now, we have noted the deceleration in the PMI and indicated our belief that this was likely to continue and reach contractionary territory (i.e. below 50). As of November 2022, the PMI dropped below 50 indicating a shrinking manufacturing economy. It went lower still in December. We believe probabilities favor further deceleration for at least the next few months.
Corporate Profits
For the last several quarters, we argued that expectations for corporate earnings needed to move lower before a market bottom was likely.
At the end of June, consensus expectations for S&P 500 full year 2022 operating EPS was $224.54. We pointed out that this implied 12.6% annual growth from the pre-Covid 2019 high EPS of $157.12. That expectation was almost DOUBLE the 5.7% annual earnings growth from 1999 to 2019.4 We were (and are) skeptical of that rate of growth now that the trillions of dollars of Covid-related government direct subsidies to businesses and transfer payments to individuals have ended.
Downward revisions finally began late in the third quarter. When we published our last letter in early November, consensus expectations for S&P 500 operating earnings for the full-year 2022 were down to $206.74. Today, expectations are down to $198.73 for 2022. Yet, 2023 estimates of $223.63 imply a rapid and significant rebound. This indicates a 9.2% EPS growth rate from 2019 to 2023. Not impossible but much higher than the historical track record would suggest is probable.
From our vantage point, additional lower revisions remain likely. Until they occur, we expect continued pressure on equities and other risky financial assets.
Market Internals
Two important points stand out from Lowry Research Corporation’s Market Trend Analysis over the past several weeks.
1. The mid-October low in the S&P 500 (and many other global equity indices) occurred without the typical violent, high-volume selling that signals investor capitulation. It is not impossible for a prolonged bear market to end without such a selloff, BUT every bear market of the past three decades did end with an extreme sell-off. The absence makes the current market rally suspicious.
2. While there are signs of improving market internals (good breadth participation and momentum), similar market internal improvements were developing during the August 2022 rally that tested the bears but eventually failed quite dramatically.
The takeaway? October may prove to be the bottom of the current bear market. But, there is currently insufficient evidence to warrant an aggressive investment posture. This is particularly true when coupled with the continuing negative rate-of-change dynamics in both key economic and corporate profit data. That all being said, if the current rally continues and market internals continue to improve, we will need to align with the prevailing trend.
Positioned for Continued Economic Deceleration and Market Volatility
Since the end of 2021, we have positioned the Grey Owl All-Season portfolio for a risk-off environment. That action continues. Our “safe haven” positions, particularly our cash allocation, remain the largest they have ever been. Our biggest long positions are the US Dollar index (a typical safe-haven asset) and a basket of gold and precious metals securities (another safe-haven asset that works best when real rates are compressing).
We are acutely aware that markets will shift toward growth and risk-taking long before that becomes obvious in the reported economic data. As we discussed above, market internals may be on the verge of an inflection point and we will react quickly if they do fully shift in a positive direction.
Unlike a car ride, we don’t have precise GPS that can tell us the minutes remaining to our destination. While we do not know exactly when it will be, we do know what different factors will look like when we arrive at the end of the bear market and we are vigilantly on the lookout for those factors to develop.
1 Despite the generic and frequent use of the term, we renamed our strategy Grey Owl All-Season after Bridgewater Associates requested we do so claiming it conflicted with a strategy they call All-Weather. 2 The Grey Owl All-Season strategy performance is taken from an individual representative account. The 60/40 benchmark is 60% ACWI and 40% AGG for the iShares Core U.S. Aggregate Bond ETF. 3 https://ycharts.com/indicators/us_pmi 4 Annual growth calculated on a compound basis.
Read more commentaries by Grey Owl Capital Management