Unfunded pensions for state and local governments were once expected by some to sink the whole market. That never happened. Instead, unfunded pension liabilities are in their best condition in nearly a decade, according to Pew Charitable Trusts, and are less of a financial burden on many state and local governments. The improvement in pension liabilities supports the case that credit quality in the muni market has improved and is strong overall.
How do pensions work?
The state or local governments that provide pensions must contribute and invest funds to pay for future benefits. The employees usually must contribute, as well. Future benefits are based on a variety of factors such as projected retirement dates, growth in salaries and life expectancies.
Municipal pension plans vary in terms of funding levels, annual expenses, and the ability and willingness to fully fund their plans. If the value of a plan’s assets falls, or the future retirement benefits promised become more expensive, the municipality generally must contribute more. Those costs compete with other costs, such as other public services or debt payments. Large payments to pensions can take funds away from payments to other resources—such as keeping the municipality operating, or making payments to bondholders. If pension expenses become too burdensome, the municipality risks defaulting on its bonds.
Each plan has a different “funded ratio,” which offers a snapshot of the amount of future assets available to meet projected future needs.
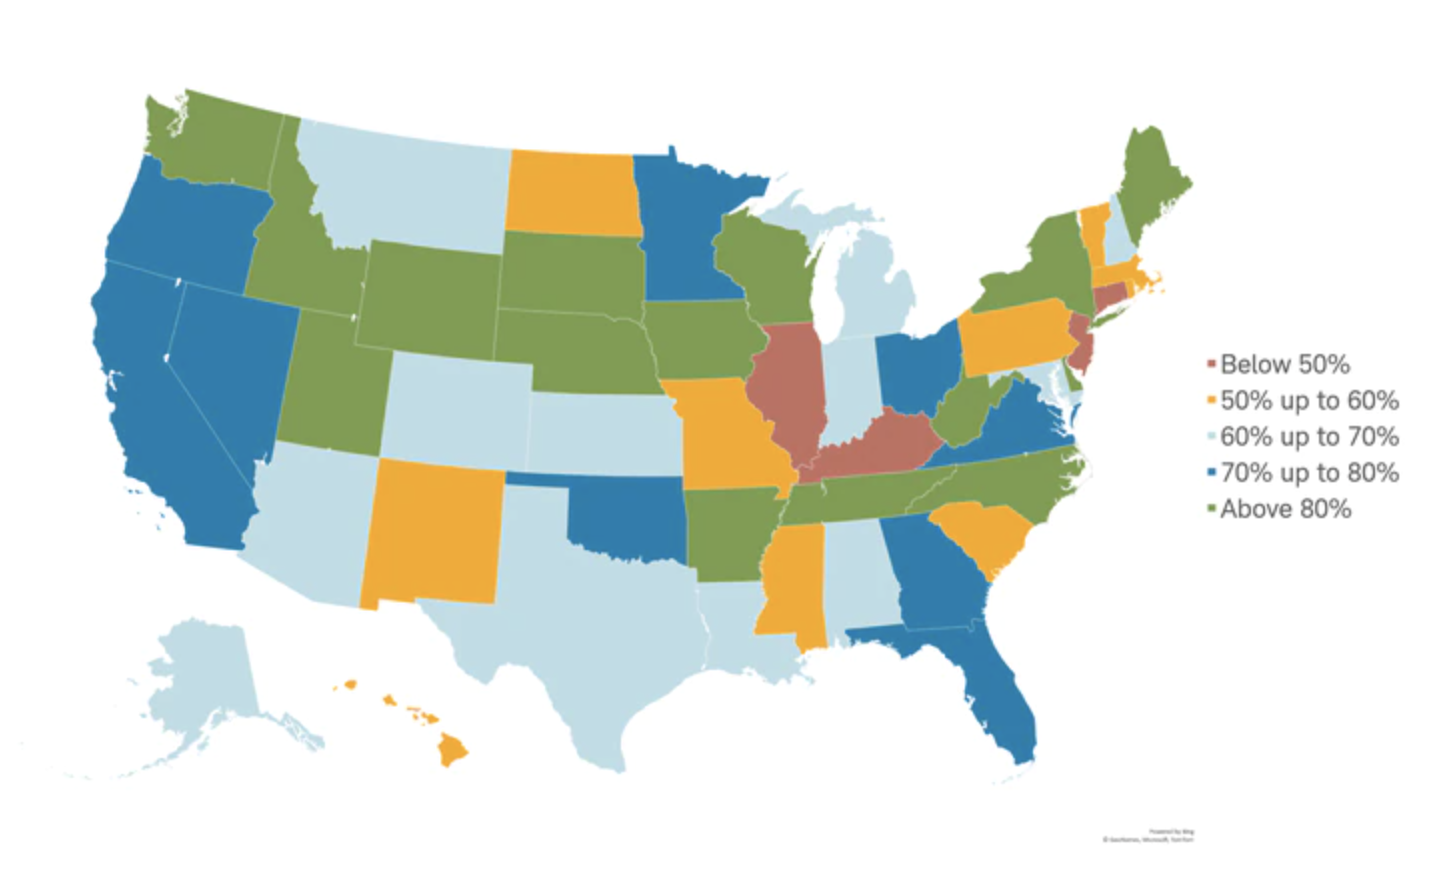
Most state and local government plans haven’t set aside all the assets required to meet 100% of the needs of future retirees, as the map below shows, which isn’t an immediate concern in our view. A ratio of 80% is generally considered as a well-funded plan. Some plans are better funded than others. However, state pension plans are in much better shape today due to increased contributions and strong market gains. The improvement in state pensions has helped improve the credit conditions of many states.
Mind the pension-funded gap

Source: S&P Capital IQ, as of September 20, 2021.
A few points to keep in mind:
-
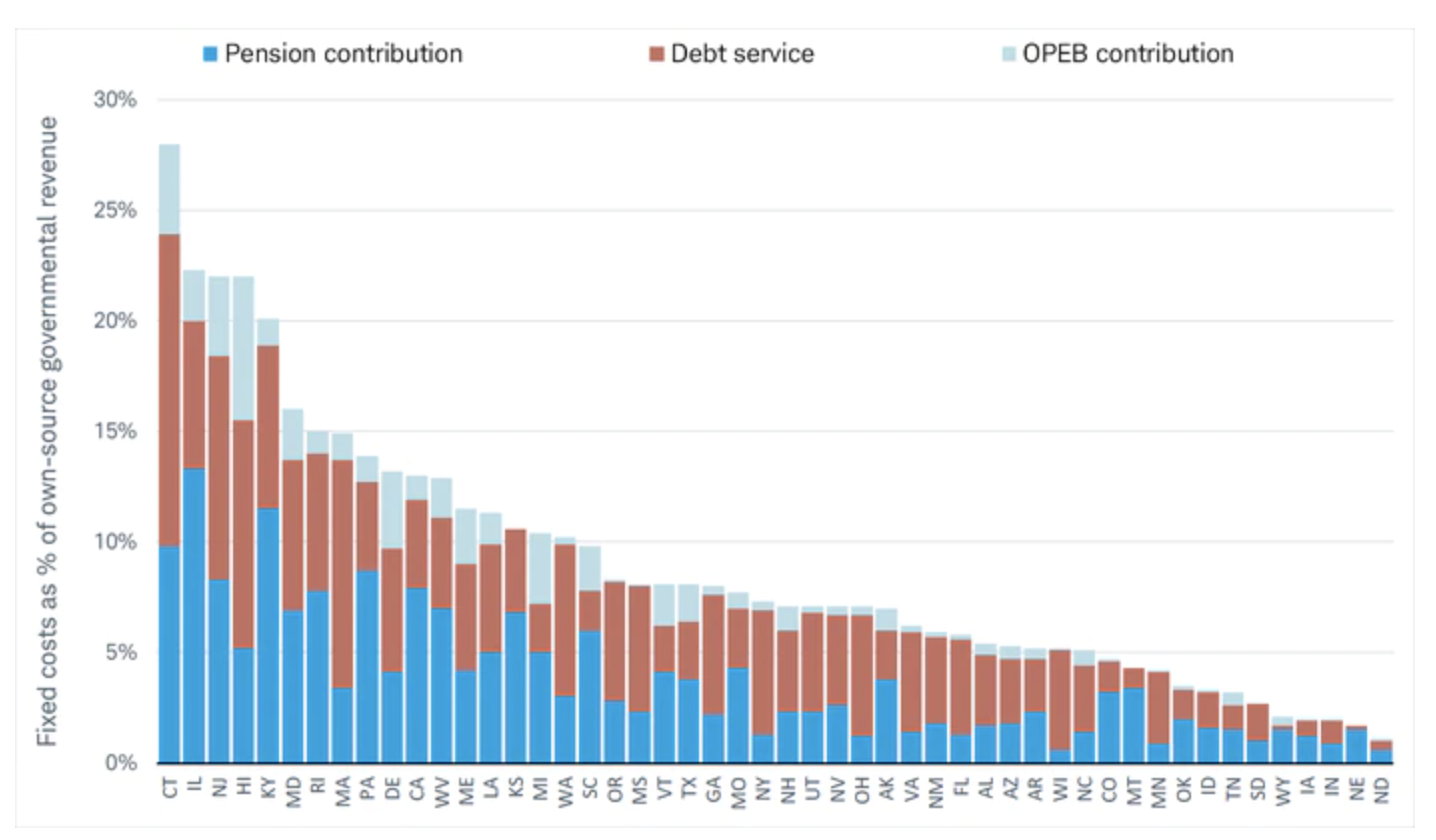
Pension expenses are manageable for most municipalities.The good news is that in general, states have the financial resources to make payments to both their pension plans and bondholders. However, as shown in the chart below, the amount of each state's revenues that go toward fixed costs, including pensions, varies. For example, Connecticut spent 28% of the revenue it generated on debt service, other post-employment benefits (OPEBs) like health care in retirement, and pension contributions in fiscal year 2020. The remaining revenue went toward other things like operations and state-run programs. This compares to North Dakota, which only spent 1.1% of the revenue it generated on similar fixed costs.
Payments on debt account for a low portion of governmental revenues for many states
Source: Source: Moody’s Investors Service, as of September 20, 2021
-
The strong equity market combined with increased contributions have helped shore up plans.State and local government pension plans have in aggregate about 60% their investments in stocks, according to Wilshire Trust Universe Comparison Service. Since the low on March 23, 2020, the S&P 500 is up 92.4% which has contributed to the significant improvement in pension funding levels and caused many plans to exceed their investing benchmark. For example, CalPERS, the California Public Employee’s Retirement System, the largest plan in the nation, earned a net return of 13.3% for the calendar year 2021, which exceeded its benchmark by 1.20%. Although investment returns helped improve the financial position of CalPERS, it’s still not fully funded as illustrated in the map above.
When a plan outperforms its investment benchmark, it can take some of the financial pressure off the municipality because it doesn't have to contribute as much to the plan. This frees up financial resources that can go toward debt service. This is a credit positive and can lead to ratings upgrades and improve the prices of existing bonds.
Many municipalities have used the recent strong economic recovery and substantial fiscal aid to help shore up their unfunded pension liabilities. For example, contributions have increased an average of 8% per year. Even some of the plans with the lowest funding have made significant improvements to contributions to get their plans on better footing. Illinois, Kentucky, Pennsylvania, and New Jersey have all increased contributions by an average of 16%.
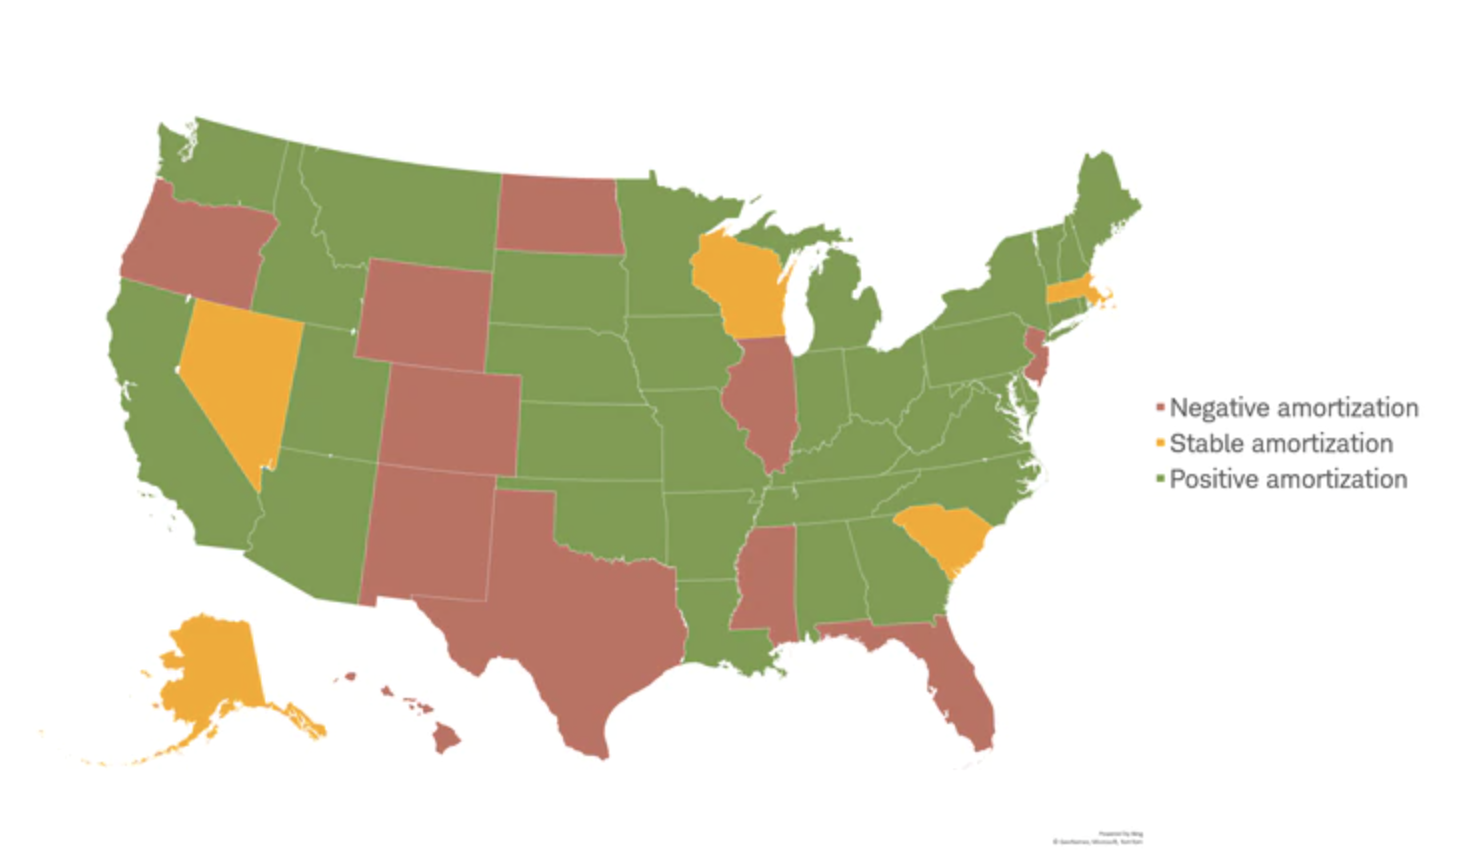
For the first time in 20 years, states are projected to have collectively contributed enough funds to be able to pay current benefits as well as reduce pension debt. The ability to pay current benefits while also reducing pension debt is a situation known as “positive amortization.” If a state has achieved positive amortization, its pension liability is expected to decline and become less of a financial burden. As of 2019, which is the most recent date for individual state data, 35 states have achieved positive amortization of pension debt. This is up from 16 states in 2014.
Most states contributed enough to their pensions to make current contributions and pay down debt
Source: Pew Charitable Trusts, 2019 State Data which is the most recent data available for all states, report as of September 14, 2021. States with “negative amortization” contributed less than 90% of the contribution needed to pay current benefits and pay down debt. States with “stable amortization” contributed between 90% and 100%, and states with “positive amortization” contributed more than 100%.
-
Many states and local governments have been taking action to reduce expenses.In addition to stepping up contributions, plans have been taking other actions to reduce the financial burden that unfunded pension liabilities may pose. Nearly every state has enacted reforms—such as reducing benefits—to their pensions, according to Pew Charitable Trusts. The most common reform is to reduce the cost-of-living adjustment (COLA) for retirees, which in turn reduces the projected liability. Steps like these can free up money for debt service, because the state or local government can scale back current contributions for future pension obligations.
Reducing benefits can be difficult, because most states have legal protections that apply to pension benefits for current employees and retirees, but these protections are not uniform among states. For example, Illinois’ state constitution says that pension benefits “shall not be diminished or impaired,” which has limited the state’s ability to address its large liability. Texas, on the other hand, has less strict protections for state-administered plans,1 making it easier to address its liability. No state, according to the Center for Retirement Research at Boston College, protects benefits for future employees—meaning that new employees may not be offered a pension plan but instead a defined-contribution retirement plan, similar to a 401(k), where the burden to fund the employee’s retirement is mostly the employee’s responsibility.
What to do now
There’s no denying that large unfunded pensions pose a burden to some municipalities, but the risk overall is lower today relative to the last decade. To help limit the risk they may pose to your investments, consider the following:
-
Watch the credit rating. A municipal bond’s credit rating historically has been a very good indicator of its ability to meet near-term debt payments. Consider signing up for email ratings alerts on Schwab.com. These alerts should help you stay up to date on your municipal bonds. If you own individual bonds, and your bond is downgraded, it warrants additional attention as to why it was downgraded. Multi-notch downgrades are especially important to pay attention to, in our view.
-
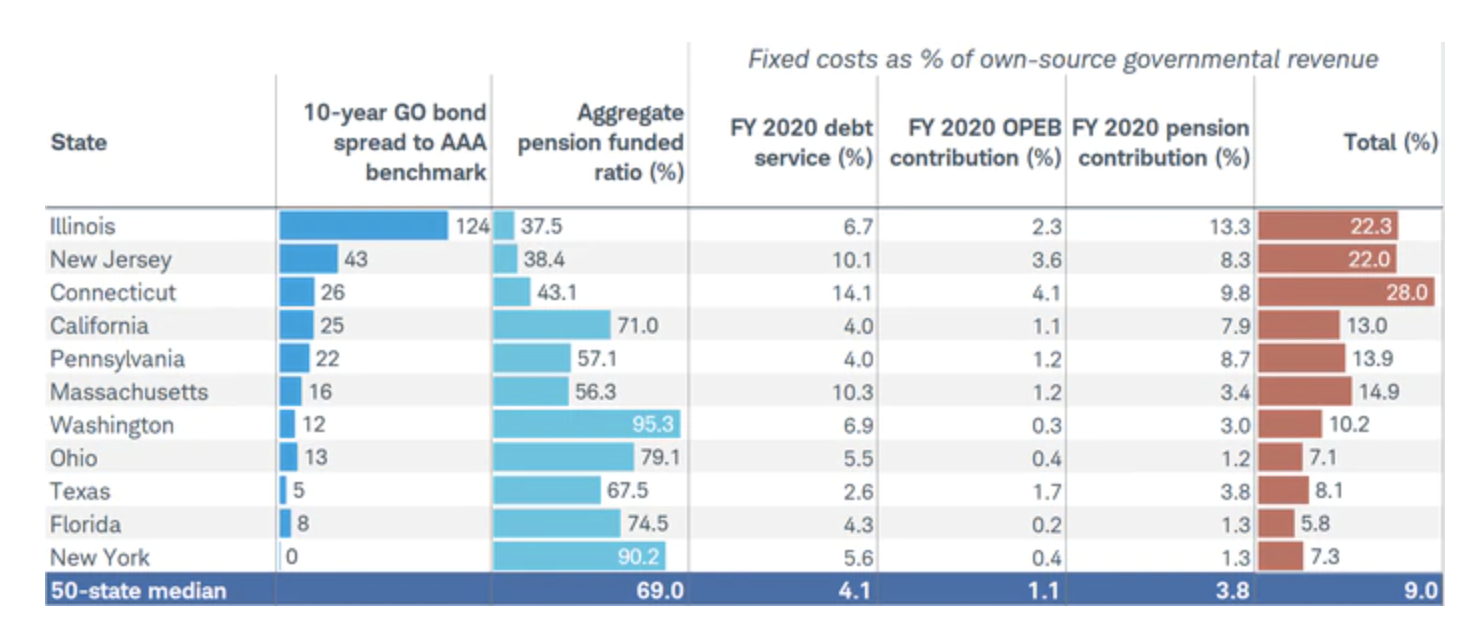
Also watch the bond’s yield. Generally, the market is aware of which states and municipalities are struggling more with large unfunded pension liabilities and therefore require higher yields on the bonds they issue. For example, the state of Illinois’ pension plan is roughly 38% funded as of 2020 and payments toward debt and retirement liabilities account for nearly a quarter of the state’s own source revenues. As a result, the yield for a State of Illinois 10-year general obligation (GO) bond is 120 basis points above a AAA benchmark. This compares to 29 basis points for the state of California, whose plan is 71% funded and whose payments to fixed costs account for 13% of own-source revenues. Be cautious toward a bond that is yielding far more than other bonds of similar credit quality and maturity, all else equal.
Bonds for states with large unfunded liabilities and less financial flexibility generally yield more
Source: Bloomberg, Moody’s Investors Services, and Standard and Poor’s. Data as of March 16, 2022.
-
Do your homework. If you’re a Schwab client researching a muni bond on Schwab.com, you can find recent disclosures, material events and financial statements in MuniDOCS®, which is under the Offering Documents and Material Events section. One thing to note: Muni disclosures have historically faced delays in being released and can be cumbersome to analyze.
-
Consider choosing a professional manager to do the homework for you. If you don’t want to monitor credit conditions for multiple individual issuers, you’re not alone. We believe professional management by bond fund managers or separately managed accounts can make sense. A professional manager can monitor issues that could cause problems—such as unmanaged pension liabilities or other credit risks.
-
Diversify. While we do not expect to see a significant increase in defaults or distress caused by pensions or post-employment costs, try to avoid too much exposure to any single issuer. We suggest owning 10 or more individual issuers, at minimum.
1 Accruals in many locally-administered plans are protected under the Texas constitution, according to the Center for Retirement Research at Boston College.
© Charles Schwab
Read more commentaries by Charles Schwab