Are Transportation Revenue Bonds Ready for Takeoff After Being Grounded Earlier This Year?
Membership required
Membership is now required to use this feature. To learn more:
View Membership BenefitsThe transportation sector in the municipal bond market faces significant headwinds as a result of the COVID-19 pandemic. With people traveling and commuting less—or not at all—it is, unsurprisingly, the worst-performing municipal bond sector this year. However, we don’t believe that means it should be overlooked. Yields, on average, are higher than other muni sectors, partly due to the sector underperforming the rest of the muni market, but risks are elevated, as well.
Despite being the worst-performing sector, transportation munis offer higher yields than most of the muni market
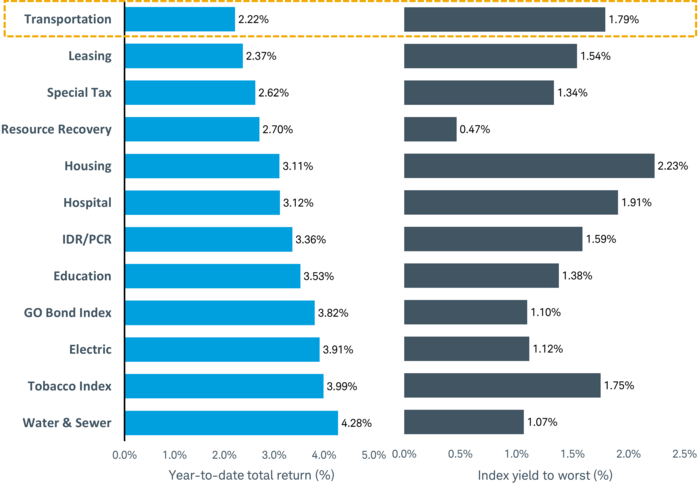
Source: Components of the Bloomberg Barclays Municipal Bond Index, as of October 2, 2020. See Important Disclosures for a list of indices used. Past performance is no guarantee of future results.
Planes, trains, and automobiles: A primer on transportation bonds
Transportation revenue bonds are issued to finance local public transportation projects, such as airports, mass-transit systems, toll roads, ports, and parking structures. The bonds are commonly repaid from the revenue earned by the system and occasionally by support from the federal, state, or local government. However, they may also be supported by a tax, such as a property or sales tax. This support can help offset declines in usage. Here we’ll focus just on airports, mass-transit systems, and toll roads, and what to look out for when investing in these sectors.
In general, the credit quality of an issuer is a function of its:
- Size and essentiality
- Rate raising ability
- City, state, and federal support
- Mobility in the area
- Bond provisions
On average, ratings for issuers in the sector are clustered in the A/A category, which is lower than the average rating for the rest of the muni market. The lower average credit rating for the sector is due to issuers operating with more business-like risk, compared to issues such as general obligation bonds, which are often backed by the full faith and credit of the issuer, or a water and sewer issuer that often has a monopoly over services.
Airports make up most of the bonds in the sector, as illustrated in the chart below. They also tend to account for a greater proportion of the higher-rated part of the sector. On the other hand, mass-transportation bonds account for a greater share of the lower rated portion of the sector. The New York Metropolitan Transportation Authority (MTA) is one of the largest issuers in the whole muni market and accounts for a large share of the A- rated issuers in the sector. MTA is rated A3 by Moody’s and BBB+ by S&P, which Bloomberg averages out to A-.
Airports make up a large portion of the transportation sector
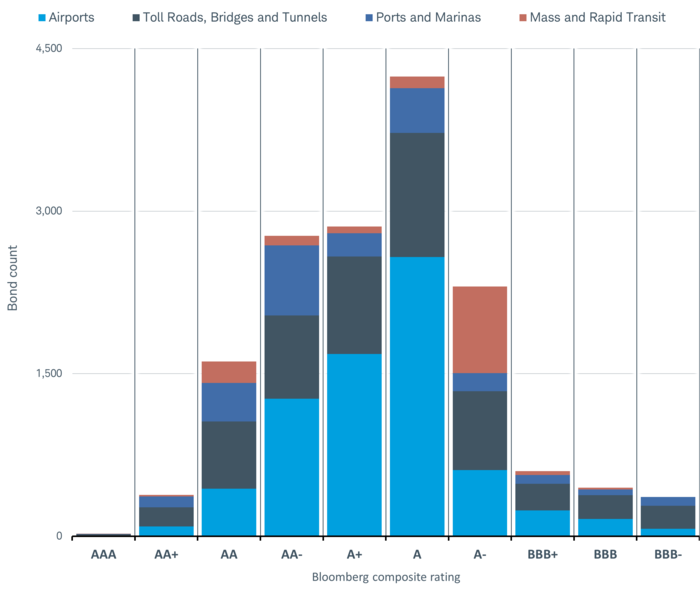
Source: Bloomberg, as of October 2, 2020. Does not include bonds with a Bloomberg Composite Rating that is below investment grade.
The transportation sector can add opportunities to add some lower-rated issuers
Overall, we suggest municipal bond investors focus the core of their portfolio on higher-rated issuers, those with ratings in the AA/Aa or above categories. However, more risk-tolerant investors could consider adding some A/A rated issuers for higher yields. Given the transportation sector’s average credit quality, it can present opportunities. If investing in the sector, here’s what to look out for:
Airports
The aviation industry has been upended by the coronavirus, with travel slowing to a crawl. Compared to a year ago, the number of travelers through TSA checkpoints is down roughly 65%, as illustrated in the chart below. The number of travelers is one of the most important factors that affects an airport’s credit quality. In March, Standard & Poor’s revised its outlook on the airport sector to negative and placed all not-for-profit airports on Creditwatch with negative implications, partly as a result of the decline in air traffic passengers.
The number of travelers using TSA checkpoints is down about 65% year over year


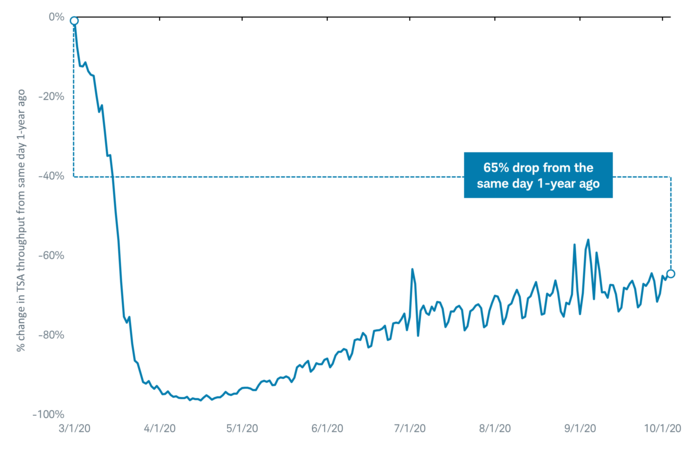
Source: Transportation Security Administration, as of 10/04/2020.
The airline sector faces a high degree of uncertainty in the future. Individuals’ willingness to resume air travel to more normal levels will likely depend on the spread of the virus. In addition, there are questions about what business travel will look like in the future, as many companies have been forced to operate in a remote environment and may continue to do so to reduce costs.
A bright spot for the sector is that prior to the coronavirus crisis the financial profile of the average airport was improving. Debt-service coverage was 1.69 times, which was the highest amount since prior to the 2008 recession, according to Moody’s Investors Service. In addition, days cash on hand was very strong at 659 days, up from 597 in 2017. Days cash on hand is roughly the amount of cash an issuer has available to cover the average daily cost of operations. Moreover, the airport sector received about $10 billion in aid through the Coronavirus Aid, Relief, and Economic Security (CARES) Act. The strong average liquidity and aid from the CARES Act will help cushion the financial blow of the slowdown of passenger traffic. We expect another round of aid will be passed that will assist the sector, but the timing and amount are in question.
Going forward, we are cautious of smaller regional airports in competitive markets. Larger, more-established airports should fare better. Those with already strained finances, which often coincides with a lower credit rating, may be at risk of downgrades. Also, airports serving domestic travel destinations or connecting flights have fared better than those with mostly business or international travelers, according to Moody’s. Until the spread of the virus slows, this is a trend that we expect will continue.
The median days cash on hand is strong for all airport types
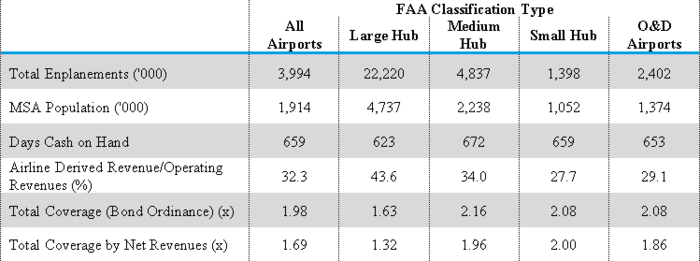
Source: Moody’s, as of 11/20/2019. Numbers are medians.
Mass transit
Contrary to what many may think, the largest mass-transit systems rely on other sources of revenues rather than fares alone, as illustrated in the table below. It’s important to note that the table shows 2018 fiscal year operating revenues, which are the most recently reported figures by Moody’s and may be different from the current composition of operating revenues. Although the decline in ridership puts negative pressure on operating revenues for mass-transit systems, support from other funding sources, strong coverage ratios, and high reserve funds help mitigate that pressure. In addition, some mass-transit bonds are backed by a sales tax or property tax, which is generally a stable revenue source.
Fares are not the dominant source of revenues for the largest mass-transit systems
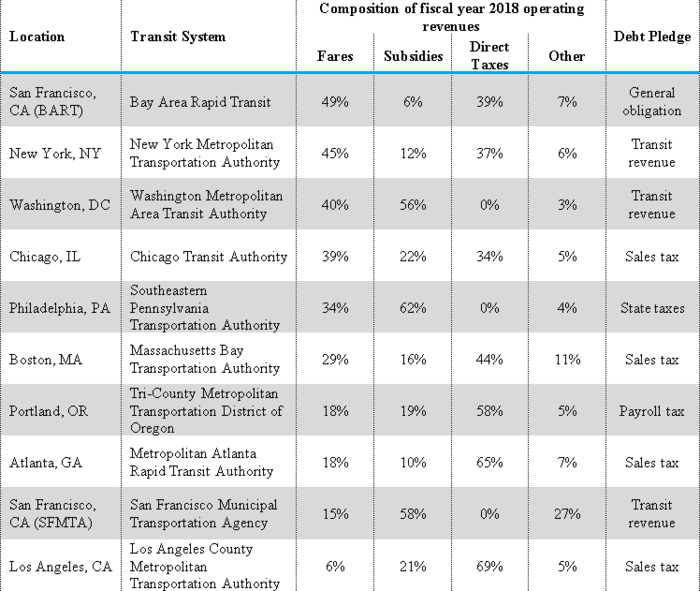
Source: Moody’s, as of 09/04/2019.
There are only 25 mass-transportation systems that issue bonds, according to Bloomberg. Given the small number of issuers, we’re going to give special focus to the issuer dominating the headlines lately and one of the largest issuers in the market—the New York Metropolitan Transportation Authority (MTA).
The MTA is responsible for providing commuter service for the city’s five boroughs, as well as service to other communities near the city. The MTA is vital to the city and arguably could be considered an essential service. However, ridership came to a screeching halt due to the virus. The senior-most revenue-backed bonds were downgraded to A3 by Moody’s on September 11th and BBB+ by S&P shortly thereafter. S&P downgraded the MTA due to a “very weak” debt service coverage, “mounting challenges” on “the economy, ridership, traffic, subsidies, and taxes” related to the coronavirus crises. The MTA received about $4 billion in aid from the CARES Act, but had used all that up by late July, according to MTA Chairman and CEO Pat Foye.
Given the MTA’s importance to the area, we expect that the MTA will continue to operate and service the New York metropolitan area. However, the future for bondholders is less clear. We expect continued headlines about the financial pressures facing the MTA, which could lead to bond price volatility. Moreover, both S&P and Moody’s have a negative outlook on the senior-most revenue-backed bonds, which means there may be further downgrades in the near term. Investors with a lower risk tolerance should consider whether they have both the risk capacity and tolerance for downgrades and price volatility.
Tolls
Toll roads have a long history in American society, with the first toll road dating back to 1792, between Philadelphia and Lancaster, Penn. Fast-forward to today and there are more than 70 different issuers of bonds associated with toll roads. It’s a sector that’s difficult to make generalizations about because the profile and credit risks of each toll road and issuer are not uniform. Like many other modes of travel, traffic slowed as a result of the coronavirus crisis, but the recovery has not been uniform. For example, passenger traffic has recovered more slowly than commercial traffic due to many commuters now being able to work remotely.
Important factors for toll facilities include the area in which it operates and its essentiality. For example, some toll facilities in areas with large mass-transit systems have benefited as riders have shifted from riding the bus or subway to driving, according to Moody’s, due to concerns about contracting the virus. Going forward, we think investors should focus on mature toll roads in areas with stable traffic patterns and high liquidity. Issuers with these characteristics often have higher credit ratings.
What to do now
From a bondholder’s perspective, we don’t think investors should avoid the transportation sector due to the risks that the coronavirus crisis poses. We suggest focusing on issuers with higher ratings. We expect these issuers will be able to better manage through the disruptions caused by the coronavirus crisis. Investors with a greater risk tolerance could consider adding some lower rated (A/A) rated issuers, but we suggest keeping the allocation small.
Investors looking for individual bonds can screen for issuers in the transportation sector by using the “Filter by Purpose Class” on Schwab.com. ETF and mutual fund investors can find a funds allocation on the “Portfolio” tab on Schwab.com.
Important Disclosures:
The information provided here is for general informational purposes only and should not be considered an individualized recommendation or personalized investment advice. The investment strategies mentioned here may not be suitable for everyone. Each investor needs to review an investment strategy for his or her own particular situation before making any investment decision.
All expressions of opinion are subject to change without notice in reaction to shifting market or economic conditions. Data contained herein from third party providers is obtained from what are considered reliable sources. However, its accuracy, completeness or reliability cannot be guaranteed.
Past performance is no guarantee of future results and the opinions presented cannot be viewed as an indicator of future performance.
Indexes are unmanaged, do not incur management fees, costs and expenses and cannot be invested in directly. For more information on indexes please see www.schwab.com/indexdefinitions.
Diversification strategies do not ensure a profit and do not protect against losses in declining markets.
Fixed income securities are subject to increased loss of principal during periods of rising interest rates. Fixed-income investments are subject to various other risks including changes in credit quality, market valuations, liquidity, prepayments, early redemption, corporate events, tax ramifications and other factors. Lower-rated securities are subject to greater credit risk, default risk, and liquidity risk.
Tax-exempt bonds are not necessarily suitable for all investors. Information related to a security's tax-exempt status (federal and in-state) is obtained from third parties, and Schwab does not guarantee its accuracy. Tax-exempt income may be subject to the alternative minimum tax. Capital appreciation from bond funds and discounted bonds may be subject to state or local taxes. Capital gains are not exempt from federal income tax.
All names and market data shown above are for illustrative purposes only and are not a recommendation, offer to sell, or a solicitation of an offer to buy any security.
The policy analysis provided by the Charles Schwab & Co., Inc., does not constitute and should not be interpreted as an endorsement of any political party.
Indices used in the first chart were the Bloomberg Barclays Municipal Bond: Education Index, Bloomberg Barclays Municipal Bond: Electric Index, Bloomberg Barclays Municipal Bond: GO Bond Index, Bloomberg Barclays Municipal Bond: Hospital Index, Bloomberg Barclays Municipal Bond: Housing Index, Bloomberg Barclays Municipal Bond: IDR/PCR Index, Bloomberg Barclays Municipal Bond: Leasing Index, Bloomberg Barclays Municipal Bond: Resource Recovery Index, Bloomberg Barclays Municipal Bond: Special Tax Index, Bloomberg Barclays Municipal Bond: Transportation Index, Bloomberg Barclays Municipal Bond: Water & Sewer Index, and the Bloomberg Barclays Tobacco Index.
Source: Bloomberg Index Services Limited. BLOOMBERG® is a trademark and service mark of Bloomberg Finance L.P. and its affiliates (collectively “Bloomberg”). BARCLAYS® is a trademark and service mark of Barclays Bank Plc (collectively with its affiliates, “Barclays”), used under license. Bloomberg or Bloomberg’s licensors, including Barclays, own all proprietary rights in the Bloomberg Barclays Indices. Neither Bloomberg nor Barclays approves or endorses this material, or guarantees the accuracy or completeness of any information herein, or makes any warranty, express or implied, as to the results to be obtained therefrom and, to the maximum extent allowed by law, neither shall have any liability or responsibility for injury or damages arising in connection therewith.
The Schwab Center for Financial Research is a division of Charles Schwab & Co., Inc.
(1020-0E74)
Membership required
Membership is now required to use this feature. To learn more:
View Membership BenefitsSponsored Content
Upcoming Virtual Events View All