Unlike most macro investors who are event-driven, RBA has always strictly followed fundamentals. Our models and indicators have been time-tested in multiple cycles over the past 30 years, and a deliberate and disciplined approach has so far served us well in the current unprecedented environment.
A measured strategy, however, can appear frustratingly slow to some investors during volatile periods because heightened volatility tends to shorten investors’ time horizons. The widespread fear of missing out (FOMO) on a near-term rally after a significant downdraft typically overwhelms fundamental factors. This short-term trading mentality seems to be happening again.
Today’s growing bullish consensus is based, as it is during every bear market, on the thought “the market will be ahead of the fundamentals.” The market, of course, moves ahead of the fundamentals, but the market’s forecasting can be error-prone and currently there is little mention of head fakes, value traps, potentially impotent policies, and significant later-order effects.
Fundamentals, not short-term technicals or FOMO, will ultimately determine the direction of the markets.
3 Stages of a bear market
Historically, there have been three stages to every bear market:
Phase 1. The bear market is temporary and won’t last. The market has already discounted the worst.
Phase 2. The fundamentals are worse than anyone could’ve imagined.
Phase 3. The bear market will never end. The economy will never recover. A “new normal” is forming.
The current bear market seems mired in Phase 1. Investors are increasingly attempting to call the market’s bottom, aggressive positions are more often announced and heralded, and criticism is growing toward more cautious investors. This is normal during Phase 1.
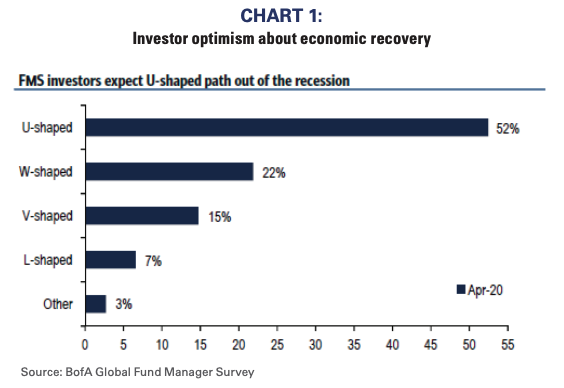
Phase 2 might occur when economic activity doesn’t “normalize” quite as investors expect. The recent Merrill Lynch Fund Manager Survey1 highlighted that 2/3rds of investors expect an optimistic “U” or “V” shaped recovery (see Chart 1). These investors are clearly looking for the economy to “return to normal,” which seems to leave the door open to disappointment.
Phase 3 occurs when investors give up hope. Instead of a majority looking for U or V recoveries, a despondent consensus typically looks for W or L. A “return to normal” is generally replaced with a “new normal.” Such despondency would likely be a very positive sign, but unfortunately still seems distant.

China’s non-production economy as a guide map for the US
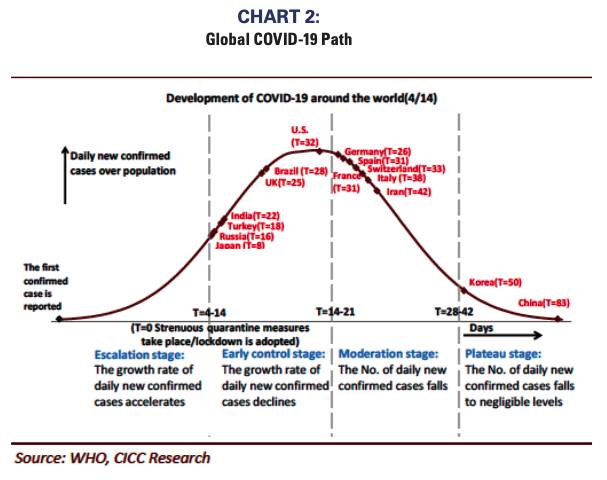
China’s COVID-19 path, by some measures, is approximately 50 days ahead of the US (See Chart 2), so China’s recovery might be a guide for the path of the US economy as COVID-19 subsides. It’s interesting that most investors expect a U or V recovery in the US when that hasn’t happened in China. China’s path has been very saucer-shaped at best.
China is a command economy. Production and lending are greatly influenced by the government and data suggest production is back to 90+% of pre-COVID levels. However, there has been a distinctly weaker recovery path for Chinese services.
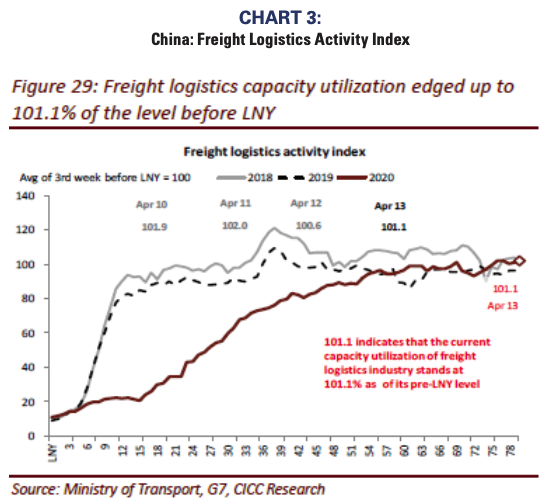
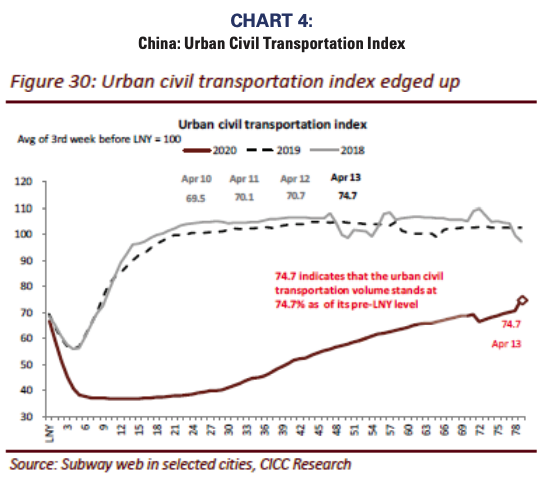
Charts 3 and 4 compare China’s recoveries in production-related transportation to human-related transportation. Whereas production transportation appears back to normal (101+% of pre-COVID levels), human transportation remains subdued (75%) as individuals are hesitant to congregate and re-engage.
The US is a service and consumption economy and not a production one, so it would seem the Chinese non-production experience is the better one to apply to the future US economy. Using those Chinese data as a guide, forecasts for a V recovery, or even a U recovery, in the US seem overly optimistic. The US economy will recover; that’s not our point. However, it seems that current economic expectations and growing investor optimism are based more on stock market momentum rather than on tangible recent COVID-19 experiences.
US investors seem very focused on market momentum and COVID-19 case statistics rather than attempting to estimate 2nd and 3rd order effects of the pandemic. Surely recent monetary and fiscal stimulus will help ameliorate these effects to some degree, but history shows initial public policy responses can prove anemic during major crises. Initial responses to both the S&L Crisis and 2008’s financial debacle are relevant examples.
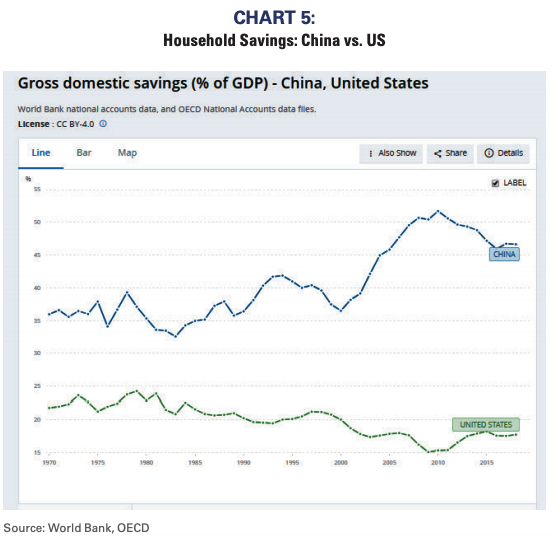
The Wall Street Journal on April 15th pointed out that 60% of US households have no meaningful savings to carry them through the pandemic. Chinese households have savings to offset income losses through tough periods, but this isn’t true in the US (See Chart 5). Because of the lack of household savings, the unfortunate path for the US economy could be negative multiplier effects grow as the pandemic lengthens. Without savings, the line between US recession and depression could be thinner than is generally perceived.
The early bird doesn’t catch the worm…better to be late.
Relying on fundamentals is often met with disbelief because investors believe the markets are fast and waiting for fundamentals to improve implies missing the bull market. First, every true multi-quarter/multi-year bull market has been based on fundamentals, so an approach that focuses on the underlying economic and financial causes of a bull market seems extraordinarily prudent.
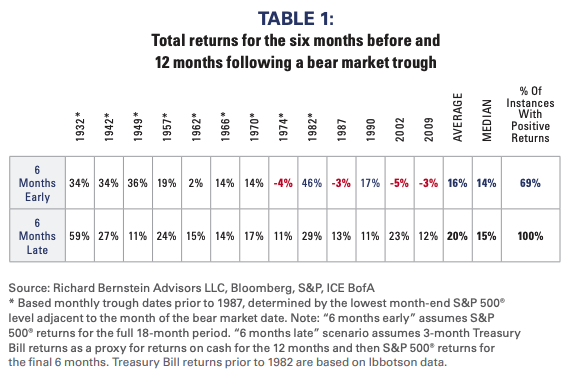
Second, history shows well that being 6 months late is preferable to being 6 months early. We did a study roughly 20 years ago showing it was superior to invest in Materials stocks 6 months after their relative performance trough than to invest 6 months early. The notion that one should “buy early but be there at the bottom” was an inferior strategy about 70% of the time. We subsequently applied the analysis to the overall market and got similar results.
Most recently, we updated our market study and the 70% rule still held. Waiting for fundamentals to turn is a superior strategy to attempting to time the market’s bottom. Table 1 summarizes our recent study.
FOMO vs. Fundamentals
Volatility can be unsettling to investors, but investors must stay dispassionate. The pressure to sell as the market collapses and the pressure to buy during subsequent rallies reeks of panic and typically leads to poor investment decisions. Have you ever heard anyone say, “I’m so glad I panicked?”. Of course not. The surest way to be dispassionate is to follow the fundamentals not the news flow or the market’s momentum.
2019’s weakening fundamental backdrop provided poor footing for the market when the dual black swans of COVID-19 and an oil shock hit the economy. Investors got caught up in the market’s momentum during 2019, but the fundamentals clearly suggested caution long before anyone heard of COVID-19.
Although every cycle has different catalysts, cycles do tend to follow a common path. The current Phase 1 optimism could lead to Phase 2 realism if the pandemic’s 2nd and 3rd order effects are bigger than are currently expected. Phase 2 could become Phase 3 if investors give up hope of a 2020 recovery.
Fundamentals, and not news flow and market momentum, will be RBA’s objective and unemotional guide for the highly uncertain path the economy and market take.
1 BofA Global Research: Global Fund Manager Survey, The FMS lows are in, April 14, 2020
INDEX DESCRIPTIONS:
The following descriptions, while believed to be accurate, are in some cases abbreviated versions of more detailed or comprehensive definitions available from the sponsors or originators of the respective indices. Anyone interested in such further details is free to consult each such sponsor’s or originator’s website.
Indexes are not available for direct investment.
The past performance of an index is not a guarantee of future results.
S&P 500®: The S&P 500® Index is an unmanaged, capitalization weighted index designed to measure the performance of the broad US economy through changes in the aggregate market value of 500 stocks representing all major industries.
3-Month T-Bill: ICE®BofAML® 3-Month US Treasury Bill Index. 3-Month T-Bill: ICE®BofAML® 3-Month US Treasury Bill Index. The ICE®BofAML® 3-Month US Treasury Bill Index is comprised of a single issue purchased at the beginning of the month and held for a full month. The Index is rebalanced monthly and the issue selected is the outstanding Treasury Bill that matures closest to, but not beyond, three months from the rebalancing date. 3-Month T-Bill returns prior to 1982 are based on Ibbotson data.
Nothing contained herein constitutes tax, legal, insurance or investment advice, or the recommendation of or an offer to sell, or the solicitation of an offer to buy or invest in any investment product, vehicle, service or instrument. Such an offer or solicitation may only be made by delivery to a prospective investor of formal offering materials, including subscription or account documents or forms, which include detailed discussions of the terms of the respective product, vehicle, service or instrument, including the principal risk factors that might impact such a purchase or investment, and which should be reviewed carefully by any such investor before making the decision to invest. RBA information may include statements concerning financial market trends and/or individual stocks, and are based on current market conditions, which will fluctuate and may be superseded by subsequent market events or for other reasons. Historic market trends are not reliable indicators of actual future market behavior or future performance of any particular investment which may differ materially, and should not be relied upon as such. The investment strategy and broad themes discussed herein may be unsuitable for investors depending on their specific investment objectives and financial situation. Information contained in the material has been obtained from sources believed to be reliable, but not guaranteed. You should note that the materials are provided “as is” without any express or implied warranties. Past performance is not a guarantee of future results. All investments involve a degree of risk, including the risk of loss. No part of RBA’s materials may be reproduced in any form, or referred to in any other publication, without express written permission from RBA. Links to appearances and articles by Richard Bernstein, whether in the press, on television or otherwise, are provided for informational purposes only and in no way should be considered a recommendation of any particular investment product, vehicle, service or instrument or the rendering of investment advice, which must always be evaluated by a prospective investor in consultation with his or her own financial adviser and in light of his or her own circumstances, including the investor’s investment horizon, appetite for risk, and ability to withstand a potential loss of some or all of an investment’s value. Investing is subject to market risks. Investors acknowledge and accept the potential loss of some or all of an investment’s value. Views represented are subject to change at the sole discretion of Richard Bernstein Advisors LLC. Richard Bernstein Advisors LLC does not undertake to advise you of any changes in the views expressed herein.
© Copyright 2020 Richard Bernstein Advisors LLC. All rights reserved.
PAST PERFORMANCE IS NO GUARANTEE OF FUTURE RESULTS
© Research Affiliates
Read more commentaries by Research Affiliates