The 10-year yield has broken back below a key level
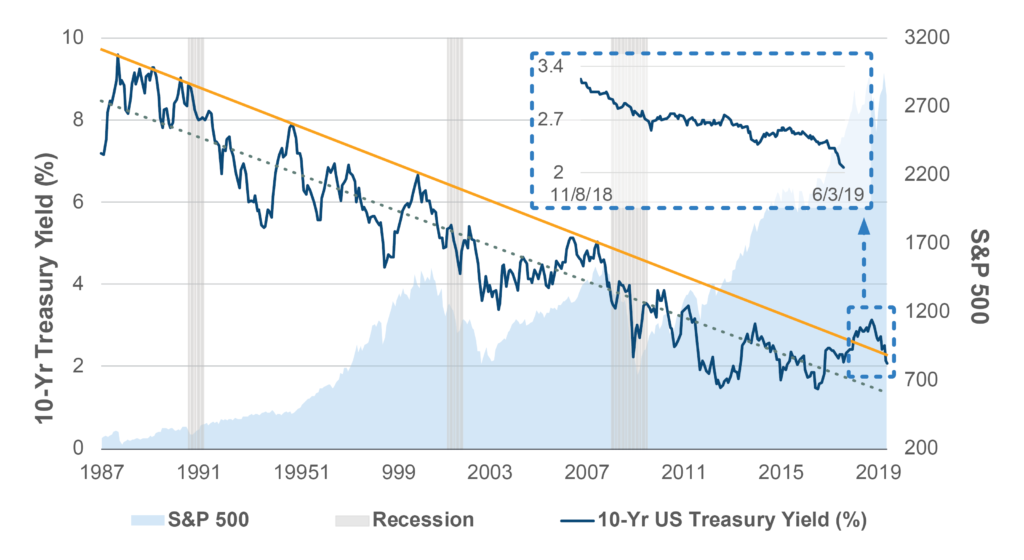
Four months ago during the first week of February, we asked the question here whether or not the 2.5-year uptrend of the 10-year Treasury yield from its all-time low in July 2016 marked the end of its multi-decade downtrend, or if it was merely a blip on the way to lower rates.
Since then, as of the writing of this post (market close on June 3, 2019), the yield on the 10-year Treasury has declined approximately 60 basis points, breaking back below the orange trend line tracing its historical peaks.
The decline has pushed the yield lower than the Fed funds target rate (2.50%, which is also the interest rate on excess reserves) by the widest margin (43 bps) since January 2008.
It is an odd thing to consider that banks holding the $1.4 trillion of excess reserves at the Fed earn more on this overnight rate than they can on today’s 10-yr or even 20-yr Treasury yields.
Related to this inversion, the futures market for Fed funds now indicates an implied probability of 98% that the Fed will cut its target rate by the end of 2019. But even with a cut of 25 basis points, the target rate would still be above today’s 10-yr yield.
Against the backdrop of an economy growing at 3%, an unemployment rate of 3.6% and solid corporate earnings growth, these falling yields and the strangely-shaped yield curve might at first glance seem to run counter to expectations.
Unless of course, rather than reflecting what is currently happening, these yields are projecting what is to come. If that is the case and the bond market is right, the end of the cycle appears to be nearing and a slowdown lies ahead.
Unless otherwise noted, data is sourced from Bloomberg.
Recipients must make their own independent decisions regarding any strategies or securities or financial instruments mentioned herein.
The products or services described or referenced herein may not be suitable or appropriate for the recipient. Many of the products and services described or referenced herein involve significant risks, and the recipient should not make any decision or enter into any transaction unless the recipient has fully understood all such risks and has independently determined that such decisions or transactions are appropriate for the recipient.
The results shown are historical, for informational purposes only, and do not guarantee future results.
Any discussion of risks contained herein with respect to any product or service should not be considered a disclosure of all risks or a complete discussion of the risks involved.
The recipient should not construe any of the material contained herein as investment, hedging, trading, legal, regulatory, tax, accounting or other advice. The recipient should not act on any information in this document without consulting its investment, hedging, trading, legal, regulatory, tax, accounting and other advisors.
The materials in this document represent the opinion of the authors and are not representative of the views of Milliman, Inc. Milliman does not certify the information, nor does it guarantee the accuracy and completeness of such information. Use of such information is voluntary and should not be relied upon unless an independent review of its accuracy and completeness has been performed. Materials may not be reproduced without the express consent of Milliman.
Data included in this document has been sourced from providers that Milliman FRM believes to be reliable from information available publicly or with consent of the provider of the source material. To the fullest extent permitted by law, no representation or warranty, express or implied is made by Milliman FRM as to the accuracy or completeness of the source data or any other information in this document.