Just how much is the Fed shaping the yield curve?
Investors who have been paying attention to the Fed know that it has raised rates eight times since late 2015 and that this has lifted the short end of the yield curve.
Perhaps less well known is that since October 2017, the Fed has reduced the size of its balance sheet by approximately $340 billion. But that hasn’t meant that it has stopped buying bonds altogether.
The pre-determined pace of Fed tapering, now at $50 billion per month, combined with the maturity schedule of the bonds on its balance sheet, has meant that the Fed has still purchased hundreds of $billions worth of bonds over this period.
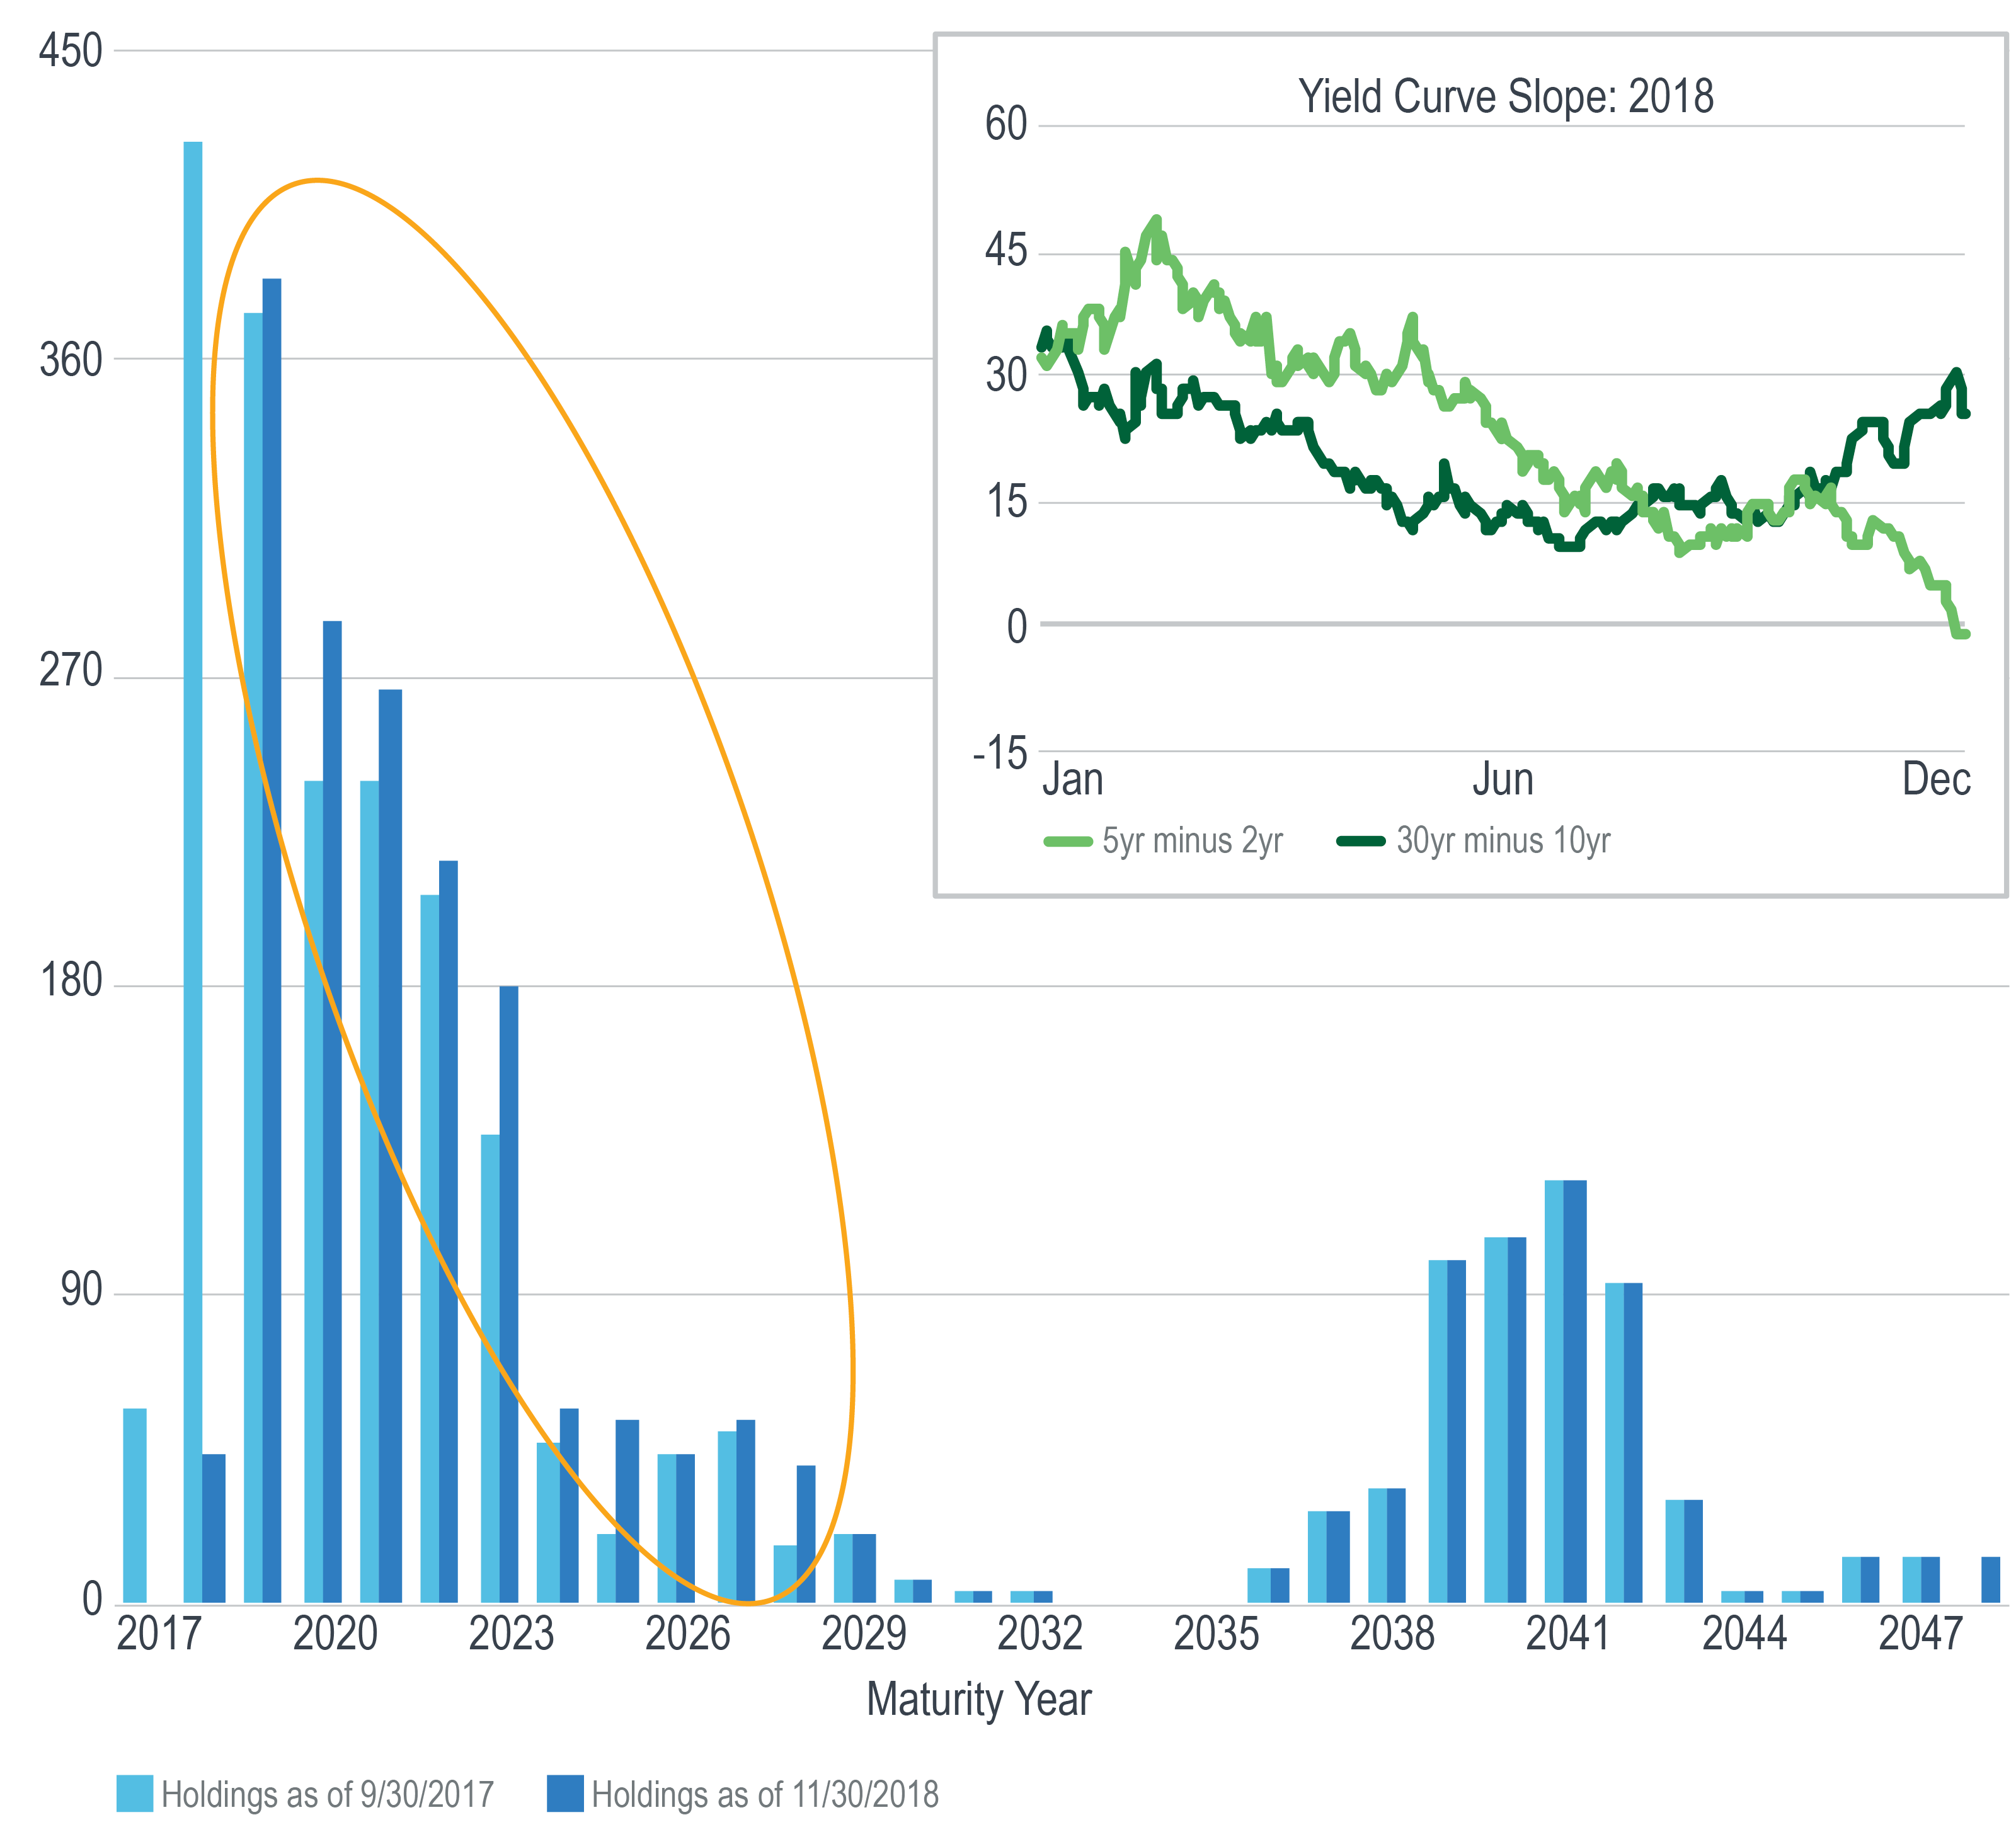
Worth noting, however, is where on the curve it has focused its buying; more than 90% has gone into bonds maturing by 2028.
On December 3, 2018, the yield on the 5-yr Treasury fell below the yield on the 2-yr Treasury, a condition that the Fed seems to have contributed to.
By virtue of raising the Fed Funds rate, it has pushed the 2-yr yield higher; by virtue of focusing its purchases on intermediate tenors, it has generated downward pressure on the 5-yr.
Meanwhile, as the short end has been flattening into inversion, the long end has been getting steeper, with an expanding gap between the 30-yr and 10-yr yields. It is arguably no coincidence that the Fed has carried out very little of its buying activity in that stretch of the curve, evidenced in the chart by the lack of any difference between the light and dark blue bars in the years 2035 and longer.
As of December 6, 2018, the futures market indicated a 64% probability of a rate hike at the Fed’s meeting on December 19, 2018. With the 2-yr at 2.70% and the 10-yr at 2.86%, investors may well see more of the curve invert before the year is through.
Unless otherwise noted, data is sourced from Bloomberg.
Recipients must make their own independent decisions regarding any strategies or securities or financial instruments mentioned herein.
The products or services described or referenced herein may not be suitable or appropriate for the recipient. Many of the products and services described or referenced herein involve significant risks, and the recipient should not make any decision or enter into any transaction unless the recipient has fully understood all such risks and has independently determined that such decisions or transactions are appropriate for the recipient.
The results shown are historical, for informational purposes only, and do not guarantee future results.
Any discussion of risks contained herein with respect to any product or service should not be considered a disclosure of all risks or a complete discussion of the risks involved.
The recipient should not construe any of the material contained herein as investment, hedging, trading, legal, regulatory, tax, accounting or other advice. The recipient should not act on any information in this document without consulting its investment, hedging, trading, legal, regulatory, tax, accounting and other advisors.
The materials in this document represent the opinion of the authors and are not representative of the views of Milliman, Inc. Milliman does not certify the information, nor does it guarantee the accuracy and completeness of such information. Use of such information is voluntary and should not be relied upon unless an independent review of its accuracy and completeness has been performed. Materials may not be reproduced without the express consent of Milliman.
Data included in this document has been sourced from providers that Milliman FRM believes to be reliable from information available publicly or with consent of the provider of the source material. To the fullest extent permitted by law, no representation or warranty, express or implied is made by Milliman FRM as to the accuracy or completeness of the source data or any other information in this document.


