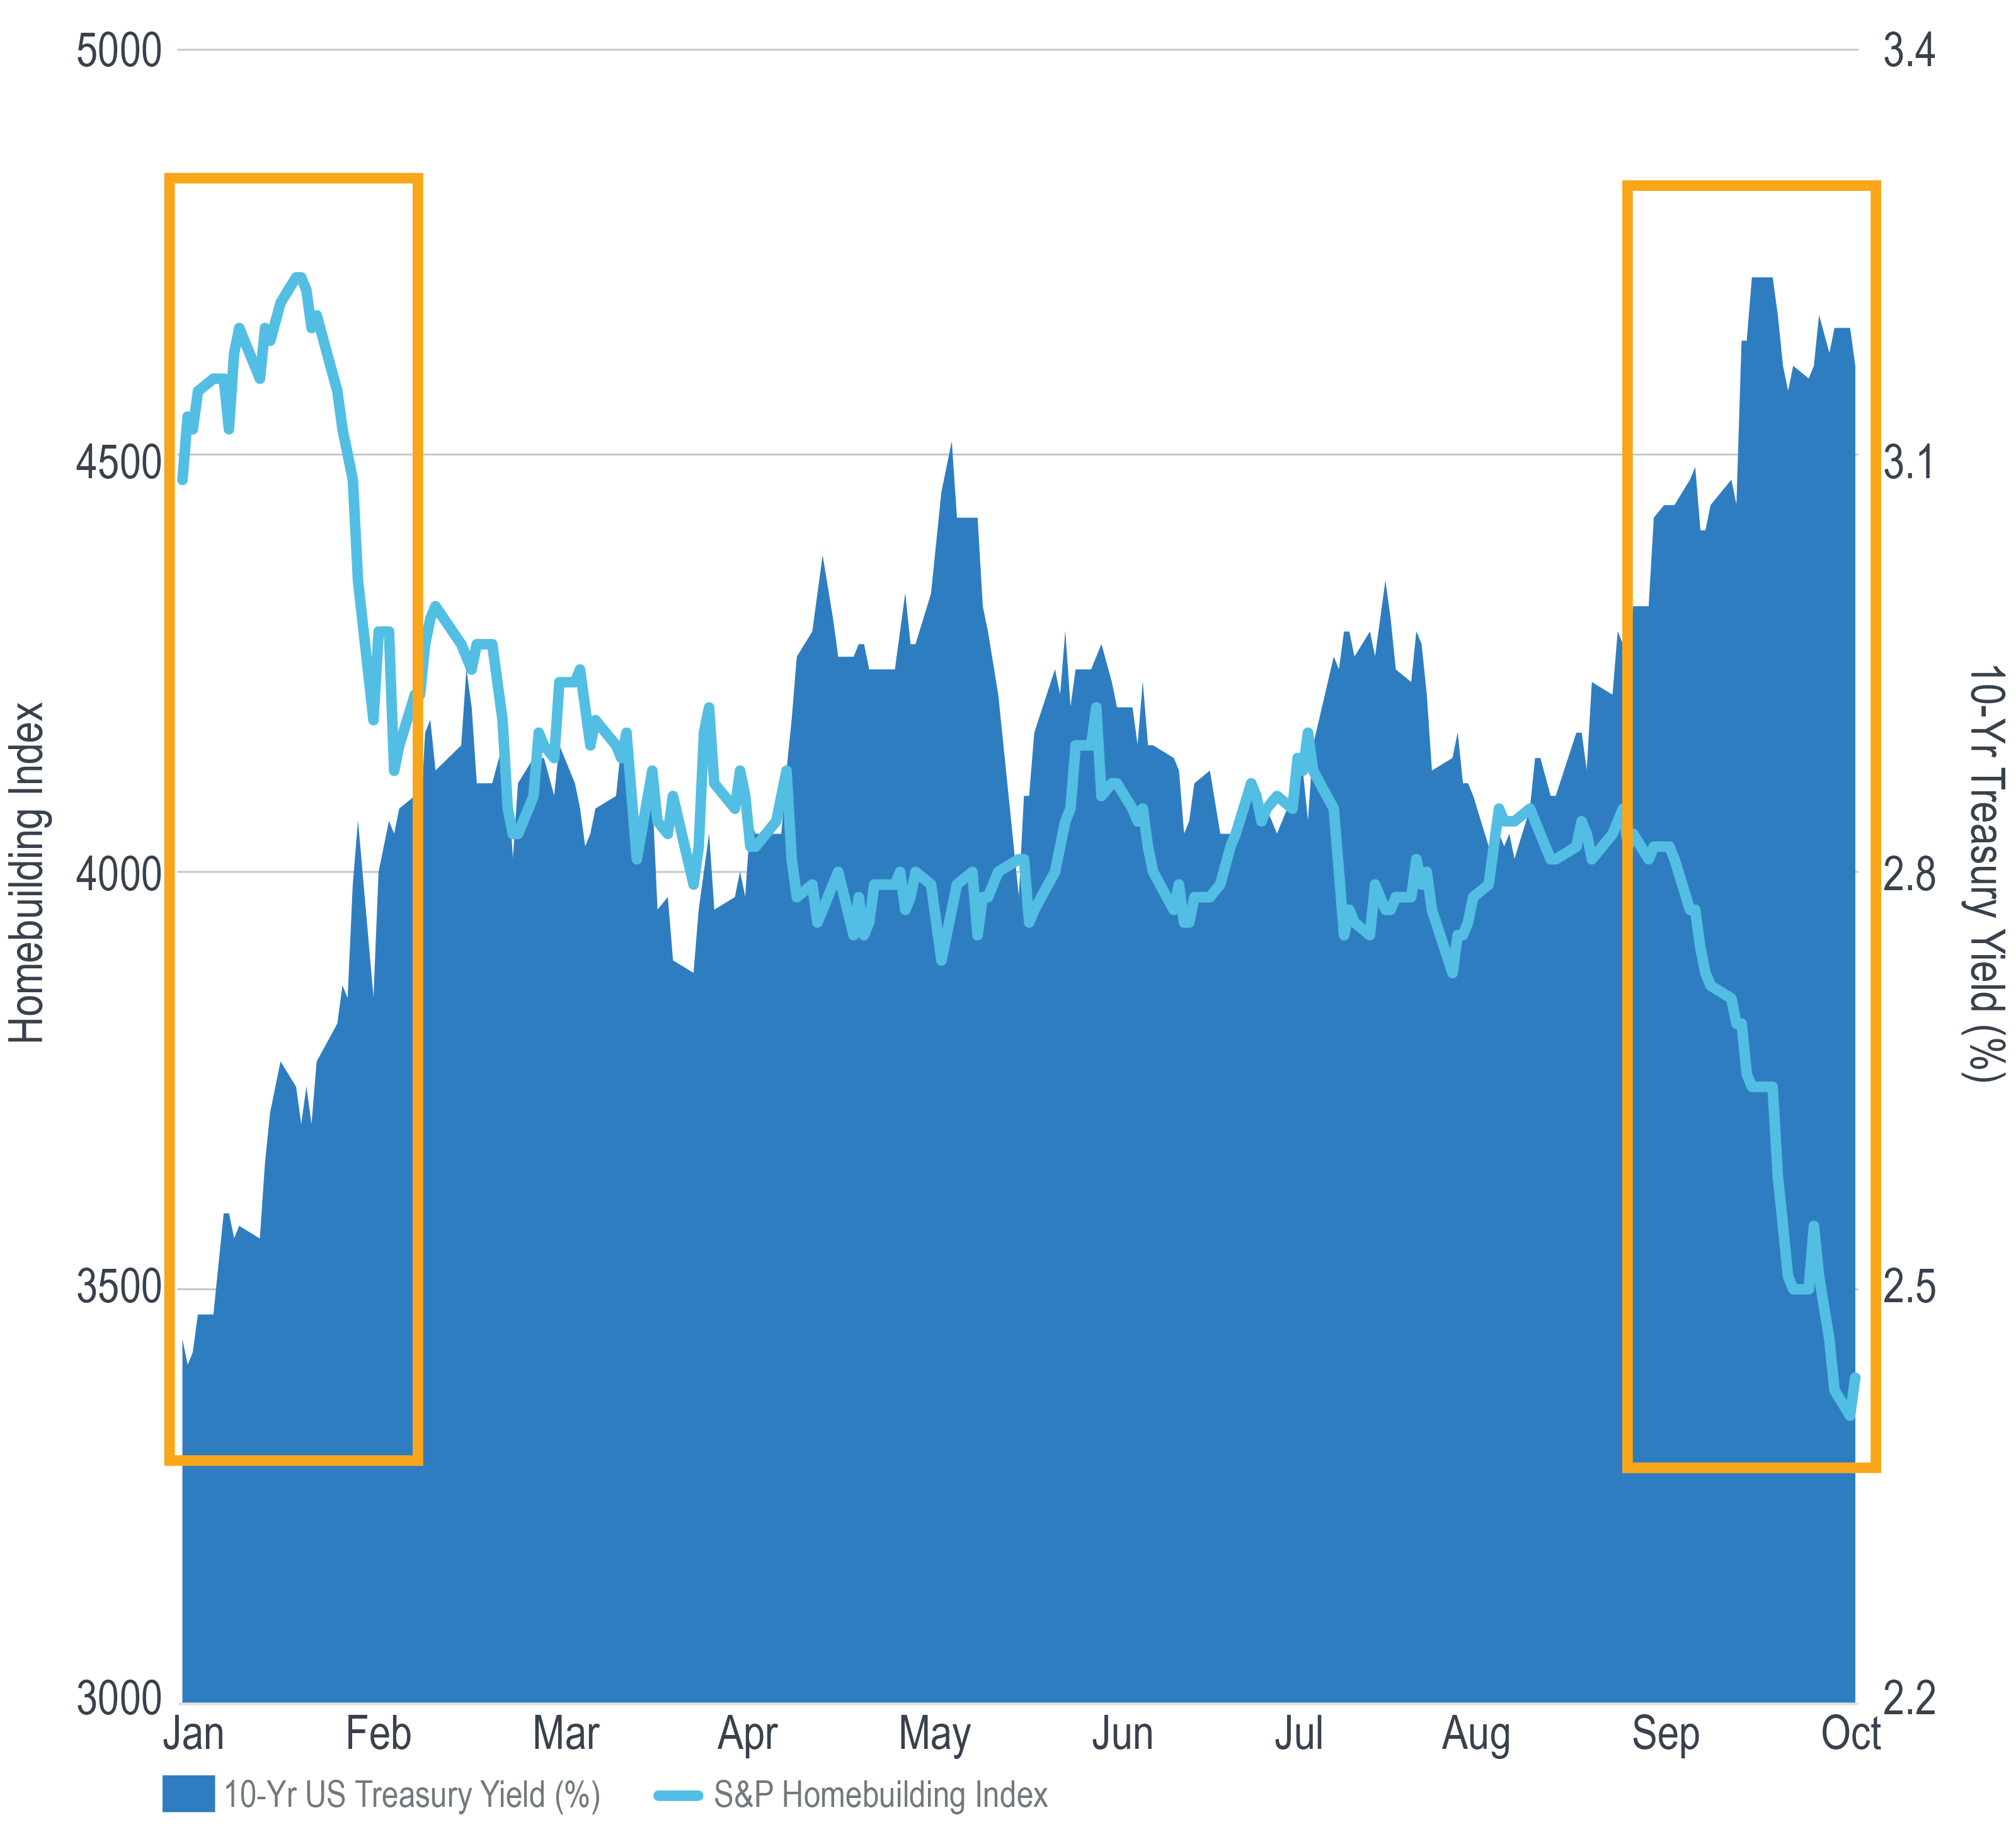
The yield on the 10-Year US Treasury bond has climbed from 2.41% at the start of 2018 to as high as 3.24% in early October.
The bulk of the move has come in two waves; the first in January and February, and the second in September and October. In both instances, the S&P Homebuilding Industry Index declined sharply, as rising mortgage rates made it more expensive to finance a home purchase.
While the Fed doesn’t explicitly control the long end of the yield curve, it certainly has the ability to put pressure on it. By virtue of raising short-term rates and by continuing to let more of its maturing balance sheet roll off without reinvesting, the Fed has generated upward pressure on the longer end of the curve.
For many years the Fed tempered its intention to normalize policy so as to not risk disrupting the recovery.
More recently, however, with Chairman Powell at the helm, the Fed has exhibited more confidence that the economy can withstand the continued removal of accommodation.
This month the housing and stock markets have shown they may not have the stomach to digest the tightening pace that the Fed has indicated. Even though Fed policy is still accommodative by historical measures, it is still much tighter relative to where it was for the previous eight years.
As December’s FOMC meeting draws nearer, investors will no doubt be closely monitoring how the Fed interprets financial markets and whether or not they affect future policy decisions.
Unless otherwise noted, data is sourced from Bloomberg.
Recipients must make their own independent decisions regarding any strategies or securities or financial instruments mentioned herein.
The products or services described or referenced herein may not be suitable or appropriate for the recipient. Many of the products and services described or referenced herein involve significant risks, and the recipient should not make any decision or enter into any transaction unless the recipient has fully understood all such risks and has independently determined that such decisions or transactions are appropriate for the recipient.
The results shown are historical, for informational purposes only, and do not guarantee future results.
Any discussion of risks contained herein with respect to any product or service should not be considered a disclosure of all risks or a complete discussion of the risks involved.
The recipient should not construe any of the material contained herein as investment, hedging, trading, legal, regulatory, tax, accounting or other advice. The recipient should not act on any information in this document without consulting its investment, hedging, trading, legal, regulatory, tax, accounting and other advisors.
The materials in this document represent the opinion of the authors and are not representative of the views of Milliman, Inc. Milliman does not certify the information, nor does it guarantee the accuracy and completeness of such information. Use of such information is voluntary and should not be relied upon unless an independent review of its accuracy and completeness has been performed. Materials may not be reproduced without the express consent of Milliman.
Data included in this document has been sourced from providers that Milliman FRM believes to be reliable from information available publicly or with consent of the provider of the source material. To the fullest extent permitted by law, no representation or warranty, express or implied is made by Milliman FRM as to the accuracy or completeness of the source data or any other information in this document.


