All Asset All Access, March 2018
Membership required
Membership is now required to use this feature. To learn more:
View Membership BenefitsSUMMARY
- We’ve designed and manage the All Asset strategies to be true diversifiers, mitigating risk in times when a conventional portfolio is likely to struggle.
- It’s too early to know whether the recent setback for U.S. stocks was a hiccup or an indication that the second-longest bull market in history is coming to a close. But we are quite confident that the valuation difference between mainstream U.S. stocks and bonds and All Asset’s Third Pillar markets (including emerging markets, real assets and high yield bonds) speaks to significant outperformance potential for the latter over the next 10 years.
- Recent research on equity valuations by the Federal Reserve Board of San Francisco corroborates Research Affiliates’ findings: Subdued levels of macroeconomic volatility help explain the currently elevated CAPE ratios (cyclically adjusted price/earnings). However, even taking this into account, today’s high valuations still portend low future returns.
- The discretionary use of limited leverage – up to 33⅓% of total assets – permits the All Asset All Authority Fund to alter its overall risk composition and further diversify away from mainstream equity beta.
Rob Arnott, founding chairman and head of Research Affiliates, assesses the outlook for market volatility and how the All Asset suite is designed to manage and even thrive in turbulent environments; Omid Shakernia, Research Affiliates’ senior vice president of asset allocation, discusses how macro factors inform the outlook for equity valuations; and John Cavalieri, PIMCO asset allocation strategist, describes the management of leverage in the portfolios. As always, their insights are in the context of the PIMCO All Asset and All Asset All Authority funds.
Q: Could you reflect on recent market conditions? If increased turbulence and market pressure persist, how do you expect the All Asset strategies to fare?
Arnott: Firstly, we should acknowledge a bit of volatility is normal. A relentless low-volatility bull market is not. With a 10% correction in just nine trading sessions, the equity markets in early February reminded us that they don’t always go up, and that volatility is itself volatile. In recent months, I’ve often joked that we’re seeing the biggest bubble in market history … not a stock or bond market bubble, but a bubble in complacency. Markets can drop surprisingly fast – surprising for those who have forgotten the lessons of 2008–2009!
One of my colleagues is fond of saying that diversification is a regret-maximizing strategy. In a bull market, we regret every penny we have in diversifying markets; in a bear market, we wish we had a whole lot more invested in diversifiers. With diversifying Third Pillar markets as their home base, the All Asset strategies have always been explicitly designed as diversifiers; they won’t behave like mainstream stock and bond holdings.1 (We define Third Pillar markets to include such diversifying sectors as emerging markets, real assets and high yield bonds.)
It’s too early to know whether the recent setback for U.S. stocks is a hiccup, or the second-longest bull market in history has come to a close. Those who have explored our Asset Allocation Interactive (AAI) tool on the Research Affiliates website know we have little confidence in anyone’s ability to pick market turning points, but we are quite confident that valuation tells us a lot about long-term returns. The arithmetic of long-term returns is simple: The future return is the yield, plus growth in income, plus or minus any changes in valuation levels. Changing valuation levels tend to swamp the other two factors for short-term investors, but in our view, yield-plus-growth is utterly dominant for long-term investors.
Prior to these recent market dislocations, two broadly held, consensus-driven expectations were that the U.S. stock rally would persist and market volatility would remain subdued. We knew that – as always – these conditions would reverse. But we didn’t know when. As we discussed in the June 2017 All Asset All Access, “While we’d be naïve to try to time the turn, U.S. stocks seem ripe for reversal, with disappointment or turbulence likely to strike in the not-too-distant future.” Our AAI website at the end of January 2018 showed a forecast of exactly 0.0% for S&P 500 real returns over the coming 10 years, including dividends but net of inflation. That’s not a particularly impressive return, especially before fees and trading costs!
For Third Pillar market indexes, we show an average estimated real return of 2.7% over the next 10 years.2 And that’s if we own all of them, including the ones that are fully priced. A more tactical allocation is currently priced to offer around 4% above inflation, according to our estimates, for the coming decade. This is before any alpha PIMCO may deliver on the underlying strategies that we use in the All Asset suite, any alpha from our RAE strategies, or any alpha from our tactical asset allocation preferences. Does this mean that the All Asset strategies will beat stocks by 2.7% this year? Of course not. We can do far better than this – or far worse – depending whether we enter a bear market or resume our bull market, already the second-longest in U.S. stock market history.
If history is a guide, our strategies tend to offer value-added in precisely those environments that savage a mainstream 60/40 portfolio (60% S&P 500 / 40% Bloomberg Barclays U.S. Aggregate Bond Index).3 Specifically, consider every day in the history of the All Asset strategy (which launched on 31 July 2002) in which the S&P 500’s daily return fell in its worst decile and the VIX (volatility index) soared to its highest decile as measured across that same 15½-year span. These are the days – and there are 140 such days during that time frame, through 9 February 2018 – when most investors rue an overly equity-centric portfolio and wish they had more diversifiers.
In these conditions, a U.S. 60/40 portfolio plunged by a daily average of −1.66%. Over the same span, All Asset Fund delivered an average daily return of −0.53% (institutional shares, after fees). All Asset All Authority Fund, a more differentiated and even more diversifying Third Pillar strategy that launched on 31 October 2003, fell a scant −0.42% on those days, on average (institutional shares, after fees), delivering a daily value-add over a 60/40 portfolio that averaged 1.37%. Put a different way, All Asset cut losses by 70% on those bottom-decile rough market days, while All Authority cut losses by 80%. Importantly, we consistently provided diversification: Our strategies beat a passive U.S. 60/40 portfolio in almost 98% of these occasions.4 (Of course, this belongs in the context of overall fund performance; see Figure 1. The All Asset portfolios may not have performed as well relative to a 60/40 in an up or less volatile equity market.)

So it’s no surprise then that our strategies helped to buffer investor portfolios against the recent market sell-off (see Figure 2). We’ve regularly reminded investors that the All Asset strategies tend to thrive in weak and choppy market conditions. True to our mission of being a true diversifier, we’ve designed and manage these strategies to mitigate damage in times when a conventional portfolio is likely to struggle.

Most investors love to buy whatever has given them the most joy and profit in recent years, and shun whatever has inflicted pain. But any extravagantly priced investment will likely fall in the former category, and bargains generally fall in the latter category. For this very reason, most investors, like moths drawn to a bug-zapper, just can’t resist chasing their recent winners and shunning diversifiers late in a bull market. It’s sad. But we can choose to behave differently. We can choose to lighten our exposure to the priciest markets and buy the bargains.
Q: The Federal Reserve Bank of San Francisco discusses a model that seeks to explain variations in CAPE ratio based on macroeconomic variables. Can you share your thoughts on this approach and how it relates to your research?
Shakernia: The S&P 500’s cyclically adjusted price/earnings (CAPE) ratio of 33.8x on 31 January 2018 surpassed the valuations reached on the eve of the crash of 1929, entering a rarefied air with the technology bubble of the late 1990s as the only historic precedent. Naturally, this has stirred a healthy debate on whether the market is once again in bubble territory – and recent volatility has jolted many investors and prompted greater scrutiny – or whether “this time is different.” In a recent Research Affiliates article, Rob Arnott and co-authors provide a rich survey and discussion5 of the various explanations that have been proposed to the elevated CAPE ratios.
Unsurprisingly, stock valuations have been on the minds of monetary policymakers: The minutes of the July 2017 Federal Open Market Committee (FOMC) meeting show that the members “considered equity valuations in their discussion of financial stability” and “a couple of participants noted that favorable macroeconomic factors provided backing for current equity valuations.” Turning to the question above, the Federal Reserve Bank of San Francisco (FRBSF) Economic Letter6 from November 2017 proposes a model to explain linkages between stock valuations, as measured by CAPE levels, and macroeconomic factors, including potential GDP growth, the core inflation rate and an estimate of the natural rate of interest,7 known as r*. The Fed model explains 70% of changes in CAPE levels over the past five decades, and suggests that most of the equity price run-up since 2009 can be explained by recent macroeconomic conditions.
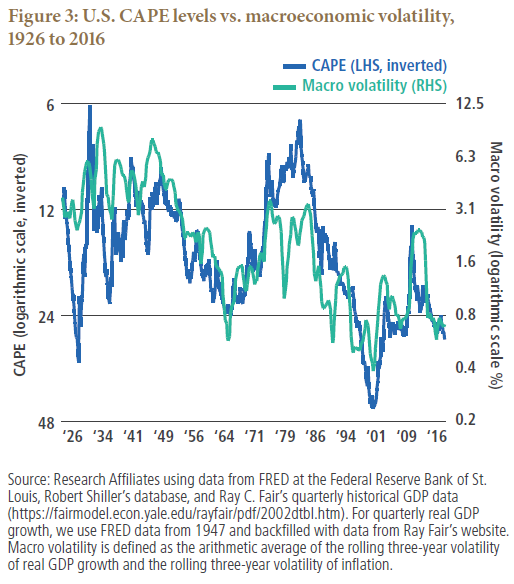
The premise of the Fed article is consistent with our findings: Equity valuations are linked with macroeconomic conditions. In a recent article,8 we showed that much of the variation in CAPE ratios can be explained by variations in macroeconomic volatility (a combination of GDP growth and inflation volatility). Times of low macroeconomic risk and uncertainty are associated with high prices and low equity risk premiums. Figure 3 demonstrates the relationship between macroeconomic volatility and CAPE levels. The variables in the Research Affiliates analysis are considerably correlated with those of the Fed paper – periods of low inflation, strong growth and lower r* tend to be associated with lower macroeconomic volatility. The same theory underpins both FRBSF’s and our findings.
Our main caveat with the FRBSF model is with its real-time implementability as a tool in making investment decisions. While the FRBSF model works well to explain past CAPE ratios, it may not necessarily be as useful in a predictive setting. Why? A key explanatory variable of the FRBSF model, r*, is based on a model9 that includes look-ahead bias because it is estimated with future data, and r* is also subject to real-time measurement error. While useful in an analysis of historical conditions, major issues arise when r* is used to forecast the future in a real-time setting. Indeed, over a five-decade historical span, we find the r*-based model better explains past CAPE levels (70% explanatory power) versus our macroeconomic volatility-based model (64%). However, the latter more effectively predicts one-year-ahead changes in CAPE levels (15% explanatory power) versus the former (10%).
So, while we agree that considering macroeconomic conditions is important in assessing stock market valuations, we believe investors benefit from capturing these linkages in a more robust and real-time implementable way. Having said that, we wholeheartedly agree with the main conclusion: Today’s high valuations portend low future returns, and investors extrapolating the recent price run-up in forming expectations of future returns are likely to be disappointed.
Q: Is leverage used in the management of the two funds, All Asset and All Asset All Authority, and if so, what are the parameters and process?
Cavalieri: The summarized answer is that PIMCO All Asset Fund seeks to implement its asset allocation approach without using leverage, whereas PIMCO All Asset All Authority Fund can and does use leverage, subject to specific limitations.
As quick background, recall that the two All Asset funds each operate as a mutual fund of underlying PIMCO mutual funds, nearly 60 at our disposal, which collectively cover the span of global liquid asset classes and strategies that, in our view, create a complete opportunity set aligned with the objectives of the two All Asset funds.
For All Asset Fund, our investment approach is straightforward: Every dollar invested is allocated across a targeted mix of underlying PIMCO funds10 that reflects the optimal portfolio as determined by Research Affiliates’ asset allocation process. So hypothetically, if $100 (after the effect of fees) is invested in All Asset Fund, then $100 of exposure to the underlying funds is obtained. We seek a 1:1 ratio, with no intent for leveraged exposure.
For All Asset All Authority Fund, we employ the same approach except we also have flexibility to employ a limited degree of leverage. Specifically, our prospectus allows leverage up to a maximum of 33⅓% of total assets, which can alternatively be stated as 50% of net assets, or 1.5x leverage.11 So the same hypothetical $100 investment into All Asset All Authority Fund can be paired with a maximum of $50 of borrowings to obtain up to $150 of underlying PIMCO fund exposure. This would be a 1:1.5 ratio or 1.5x leverage, the legal maximum permitted under the prospectus, though in practice we have typically used 1.4x as our effective maximum, so that market moves don’t force us to constantly rebalance our positions. Of course, we are under no obligation to use leverage in All Asset All Authority; it is discretionary flexibility, and our appetite for leverage varies with the cost of funding (which is related to Libor) and the potential return we estimate would result from the incremental exposures we would obtain.
That being said, we have used that flexibility over most of All Asset All Authority’s life. Since its launch in October 2003, leverage has been used 98% of the time, with an average ratio of 1.28x and a maximum of 1.45x (in November 2014). Interestingly, the use of leverage has not resulted in materially greater total risk relative to All Asset, its unlevered sister fund. Over their mutual lives, the total volatility as measured by standard deviation of All Asset All Authority and All Asset has been 8.89% and 8.63%, respectively. Instead, the leverage has typically been used to alter the composition of risk, by increasing exposure to diversifying, inflation-sensitive Third Pillar markets while simultaneously reducing exposure to the mainstream First Pillar U.S. equity markets. This is intended to produce a more diversifying, Third-Pillar-centric portfolio. Quantitatively, this increased diversification can best be seen in All Asset All Authority’s lower average equity beta compared with All Asset (0.34 in All Authority versus 0.43 in All Asset), despite their similar levels of total risk.
To be fair, All Asset All Authority Fund’s enhanced diversification is also attributable to an ability to hold one underlying PIMCO fund that is not eligible to All Asset. That is the PIMCO StocksPLUS Short Fund, which gains exposure to the inverse of the S&P 500 (via S&P futures, not by physically short-selling stocks).
The ability to concurrently use modest leverage and an equity market hedge – both as a risk offset against levered long positions or, when needed, as an outright bear market hedge (in 2008, for example) has resulted in All Asset All Authority outperforming All Asset in periods when the S&P 500 has been down. Of course, the flip side of incremental diversification has meant that All Asset All Authority has lagged All Asset when U.S. stocks are gaining.
Some investors also inquire if there is “implicit leverage” in the two All Asset funds by virtue of certain underlying PIMCO funds that may themselves employ leverage. These questions typically center on those PIMCO funds that combine two exposures into one, such as PIMCO CommodityRealReturn Strategy Fund, which gains diversified commodities exposure through futures contracts and collateralizes them with an actively managed portfolio of U.S. Treasury Inflation-Protected Securities (TIPS), or PIMCO RAE Fundamental PLUS Fund, which invests in equity-linked instruments alongside a complementary alpha-generating portfolio of actively managed high quality fixed income.
Even though these PIMCO funds, and others with similar construction, do provide concurrent exposure to two market betas, they do not provide leveraged economic exposure. Rather, each of these funds is benchmarked to a single, unlevered index (such as the Bloomberg Commodity Index or the S&P 500) and tracks this “beta 1.0” index with a limited tracking error budget, as would be expected of any actively managed strategy. So while we are certainly taking on active risks beyond the passive benchmark, we are not creating multiples of market risk, which would equate to a leveraged exposure. Rather we are allocating some of our active risk budget to the fixed income part of the portfolio, which we believe can provide a more attractive risk-adjusted opportunity for adding alpha beyond the returns of the primary index. To be sure, PIMCO has decades of experience managing these types of unlevered, “index plus” portfolios in seeking to deliver index-like risk with excess return potential, for the benefit of direct investors in those funds as well as indirect investors through the All Asset funds.
The All Asset strategies represent a joint effort between PIMCO and Research Affiliates. PIMCO provides the broad range of underlying strategies – spanning global stocks, global bonds, commodities, real estate and liquid alternative strategies – each actively managed to maximize potential alpha. Research Affiliates, an investment advisory firm founded in 2002 by Rob Arnott and a global leader in asset allocation, serves as the sub-advisor responsible for the asset allocation decisions. Research Affiliates uses their deep research focus to develop a series of value-oriented, contrarian models that determine the appropriate mix of underlying PIMCO strategies in seeking All Asset’s return and risk goals.
1 Mainstream stocks and bonds are generally not core holdings for the All Asset strategies. We own U.S. stocks only when we believe they’re cheap, and in our view, they haven’t been cheap for quite a long time. We own U.S. bonds when we believe they’re cheap (offering high real yields) or when we want a risk-off posture.
2 In this estimate, Third Pillar markets are proxied by the Bloomberg Barclays U.S. Corporate High Yield Index (U.S. high yield), J.P. Morgan GBI-EM Index (emerging market local bonds), MSCI EM Index (EM equities), Bloomberg Barclays U.S. Treasury U.S. TIPS Index (U.S. Treasury Inflation-Protected Securities), FTSE NAREIT Index (real estate investment trusts) and Bloomberg Commodity Index (diversified commodities).
3 We’ve discussed this further in recent editions of All Asset All Access in November 2017 and June 2017.
4 Since their respective launches through 9 February 2018, we delivered positive value-add versus a 60/40 portfolio in 137 of 140 daily observations for All Asset Fund, and 104 of 107 for All Asset All Authority Fund.
5 Rob Arnott, Vitali Kalesnik and Jim Masturzo, “CAPE Fear: Why CAPE Naysayers Are Wrong,” Research Affiliates, January 2018
6 Kevin J. Lansing, “Stock Market Valuation and the Macroeconomy,” Federal Reserve Bank of San Francisco Economic Letter 2017-33, November 2017
7 This is the short-term real interest rate consistent with trend GDP growth and stable inflation.
8 Michele Mazzoleni, Omid Shakernia, Michael Aked, “Quest for the Holy Grail: The Fair Value of the Equity Market,” Research Affiliates, March 2017
9 This r* model is based on a paper authored by two Fed officials: Thomas Laubach and John C. Williams, “Measuring the Natural Rate of Interest,” The Review of Economics and Statistics, 85(4), November 2003
10 This includes a broad list of PIMCO mutual funds, actively managed PIMCO ETFs and smart beta PIMCO ETFs. For a complete list of eligible underlying PIMCO funds, please refer to the prospectus for All Asset Fund and All Asset All Authority Fund.
11 If $100 is invested in All Asset All Authority and an additional $50 of asset exposure is obtained via leverage, then total assets would be $150. Leverage as a percent of total assets would therefore be 33⅓% ($50/$150). This can alternatively be expressed as 50% leverage on net assets ($50/$100), or 1.5x leverage. These are all equivalent statements.
DISCLOSURES
Investors should consider the investment objectives, risks, charges and expenses of the funds carefully before investing. This and other information are contained in the fund’s prospectus and summary prospectus, if available, which may be obtained by contacting your investment professional or PIMCO representative or by visiting www.pimco.com. Please read them carefully before you invest or send money.
The terms “cheap” and “rich” as used herein generally refer to a security or asset class that is deemed to be substantially under- or overpriced compared to both its historical average as well as to the investment manager’s future expectations. There is no guarantee of future results or that a security’s valuation will ensure a profit or protect against a loss.
Past performance is not a guarantee or a reliable indicator of future results. The performance figures presented reflect the total return performance for Institutional Class shares (after fees) and reflect changes in share price and reinvestment of dividend and capital gain distributions. All periods longer than one year are annualized. The minimum initial investment for Institutional class shares is $1 million; however, it may be modified for certain financial intermediaries who submit trades on behalf of eligible investors.
Investments made by a Fund and the results achieved by a Fund are not expected to be the same as those made by any other PIMCO-advised Fund, including those with a similar name, investment objective or policies. A new or smaller Fund’s performance may not represent how the Fund is expected to or may perform in the long-term. New Funds have limited operating histories for investors to evaluate and new and smaller Funds may not attract sufficient assets to achieve investment and trading efficiencies. A Fund may be forced to sell a comparatively large portion of its portfolio to meet significant shareholder redemptions for cash, or hold a comparatively large portion of its portfolio in cash due to significant share purchases for cash, in each case when the Fund otherwise would not seek to do so, which may adversely affect performance.
Differences in the Fund’s performance versus the index and related attribution information with respect to particular categories of securities or individual positions may be attributable, in part, to differences in the pricing methodologies used by the Fund and the index.
There is no assurance that any fund, including any fund that has experienced high or unusual performance for one or more periods, will experience similar levels of performance in the future. High performance is defined as a significant increase in either 1) a fund’s total return in excess of that of the fund’s benchmark between reporting periods or 2) a fund’s total return in excess of the fund’s historical returns between reporting periods. Unusual performance is defined as a significant change in a fund’s performance as compared to one or more previous reporting periods.
Return estimates are based on Research Affiliates LLC proprietary research and are for illustrative purposes only and are not a prediction or a projection of return. Return estimates are an estimate of what an asset class may return on average over the specified time period based on a set of assumptions that may or may not be realized. Actual returns may be higher or lower than those shown and may vary substantially over shorter time periods. Hypothetical and simulated examples have many inherent limitations and are generally prepared with the benefit of hindsight. There are frequently sharp differences between simulated results and the actual results. There are numerous factors related to the markets in general or the implementation of any specific investment strategy, which cannot be fully accounted for in the preparation of simulated results and all of which can adversely affect actual results. No guarantee is being made that the stated results will be achieved. Return estimates may vary from PIMCO capital market assumptions.
A word about risk:
The fund invests in other PIMCO funds and performance is subject to underlying investment weightings which will vary. Investing in the bond market is subject to risks, including market, interest rate, issuer, credit, inflation risk, and liquidity risk. The value of most bonds and bond strategies are impacted by changes in interest rates. Bonds and bond strategies with longer durations tend to be more sensitive and volatile than those with shorter durations; bond prices generally fall as interest rates rise, and the current low interest rate environment increases this risk. Current reductions in bond counterparty capacity may contribute to decreased market liquidity and increased price volatility. Bond investments may be worth more or less than the original cost when redeemed. Investing in foreign denominated and/or domiciled securities may involve heightened risk due to currency fluctuations, and economic and political risks, which may be enhanced in emerging markets. Commodities contain heightened risk including market, political, regulatory, and natural conditions, and may not be suitable for all investors. Mortgage and asset-backed securities may be sensitive to changes in interest rates, subject to early repayment risk, and their value may fluctuate in response to the market’s perception of issuer creditworthiness; while generally supported by some form of government or private guarantee there is no assurance that private guarantors will meet their obligations. High-yield, lower-rated, securities involve greater risk than higher-rated securities; portfolios that invest in them may be subject to greater levels of credit and liquidity risk than portfolios that do not. Investing in securities of smaller companies tends to be more volatile and less liquid than securities of larger companies . Inflation-linked bonds (ILBs) issued by a government are fixed-income securities whose principal value is periodically adjusted according to the rate of inflation; ILBs decline in value when real interest rates rise. Equities may decline in value due to both real and perceived general market, economic, and industry conditions. Entering into short sales includes the potential for loss of more money than the actual cost of the investment, and the risk that the third party to the short sale may fail to honor its contract terms, causing a loss to the portfolio. The use of leverage may cause a portfolio to liquidate positions when it may not be advantageous to do so to satisfy its obligations or to meet segregation requirements. Leverage, including borrowing, may cause a portfolio to be more volatile than if the portfolio had not been leveraged. Derivatives and commodity-linked derivatives may involve certain costs and risks such as liquidity, interest rate, market, credit, management and the risk that a position could not be closed when most advantageous. Commodity-linked derivative instruments may involve additional costs and risks such as changes in commodity index volatility or factors affecting a particular industry or commodity, such as drought, floods, weather, livestock disease, embargoes, tariffs and international economic, political and regulatory developments. Investing in derivatives could lose more than the amount invested. Thecost of investing in the Fund will generally be higher than the cost of investing in a fund that invests directly in individual stocks and bonds. Diversification does not ensure against loss.
There is no guarantee that these investment strategies will work under all market conditions or are suitable for all investors and each investor should evaluate their ability to invest long-term, especially during periods of downturn in the market. Investors should consult their investment professional prior to making an investment decision.
Bloomberg Barclays U.S. Aggregate Index represents securities that are SEC-registered, taxable, and dollar denominated. The index covers the U.S. investment grade fixed rate bond market, with index components for government and corporate securities, mortgage pass-through securities, and asset-backed securities. These major sectors are subdivided into more specific indices that are calculated and reported on a regular basis. The Bloomberg Barclays U.S. Corporate High-Yield Index the covers the USD-denominated, non-investment grade, fixed-rate, taxable corporate bond market. Securities are classified as high-yield if the middle rating of Moody’s, Fitch, and S&P is Ba1/BB+/BB+ or below. The index excludes Emerging Markets debt. Bloomberg Barclays U.S. TIPS Index is an unmanaged market index comprised of all U.S. Treasury Inflation Protected Securities rated investment grade (Baa3 or better), have at least one year to final maturity, and at least $250 million par amount outstanding. Performance data for this index prior to 10/97 represents returns of the Barclays Inflation Notes Index. The Bloomberg Commodity Total Return Index is an unmanaged index composed of futures contracts on 22 physical commodities. The index is designed to be a highly liquid and diversified benchmark for commodities as an asset class. The FTSE National Association of Real Estate Investment Trusts (NAREIT) Equity Index is an unmanaged market weighted index of tax qualified REITs listed on the New York Stock Exchange, American Stock Exchange and the NASDAQ National Market System, including dividends.JPMorgan Government Bond Index-Emerging Markets Global Diversified Index (Unhedged) is a comprehensive global local emerging markets index, and consists of regularly traded, liquid fixed-rate, domestic currency government bonds to which international investors can gain exposure. The MSCI Emerging Markets Index is a free float-adjusted market capitalization index that is designed to measure equity market performance of emerging markets. The MSCI Emerging Markets Index consists of the following 21 emerging market country indices: Brazil, Chile, China, Colombia, Czech Republic, Egypt, Hungary, India, Indonesia, Korea, Malaysia, Mexico, Morocco, Peru, Philippines, Poland, Russia, South Africa, Taiwan, Thailand, and Turkey. The S&P 500 Index is an unmanaged market index generally considered representative of the stock market as a whole. The index focuses on the Large-Cap segment of the U.S. equities market. It is not possible to invest directly in an unmanaged index.
This material contains the opinions of the manager and such opinions are subject to change without notice. This material has been distributed for informational purposes only and should not be considered as investment advice or a recommendation of any particular security, strategy or investment product. Information contained herein has been obtained from sources believed to be reliable, but not guaranteed. No part of this material may be reproduced in any form, or referred to in any other publication, without express written permission. PIMCO is a trademark of Allianz Asset Management of America L.P. in the United States and throughout the world.
PIMCO Investments LLC , distributor, 1633 Broadway, New York, NY, 10019 is a company of PIMCO.
CMR2018-0227-319284
© PIMCO
Membership required
Membership is now required to use this feature. To learn more:
View Membership Benefits