Volatility Awakened In February After Two-Year Hibernation
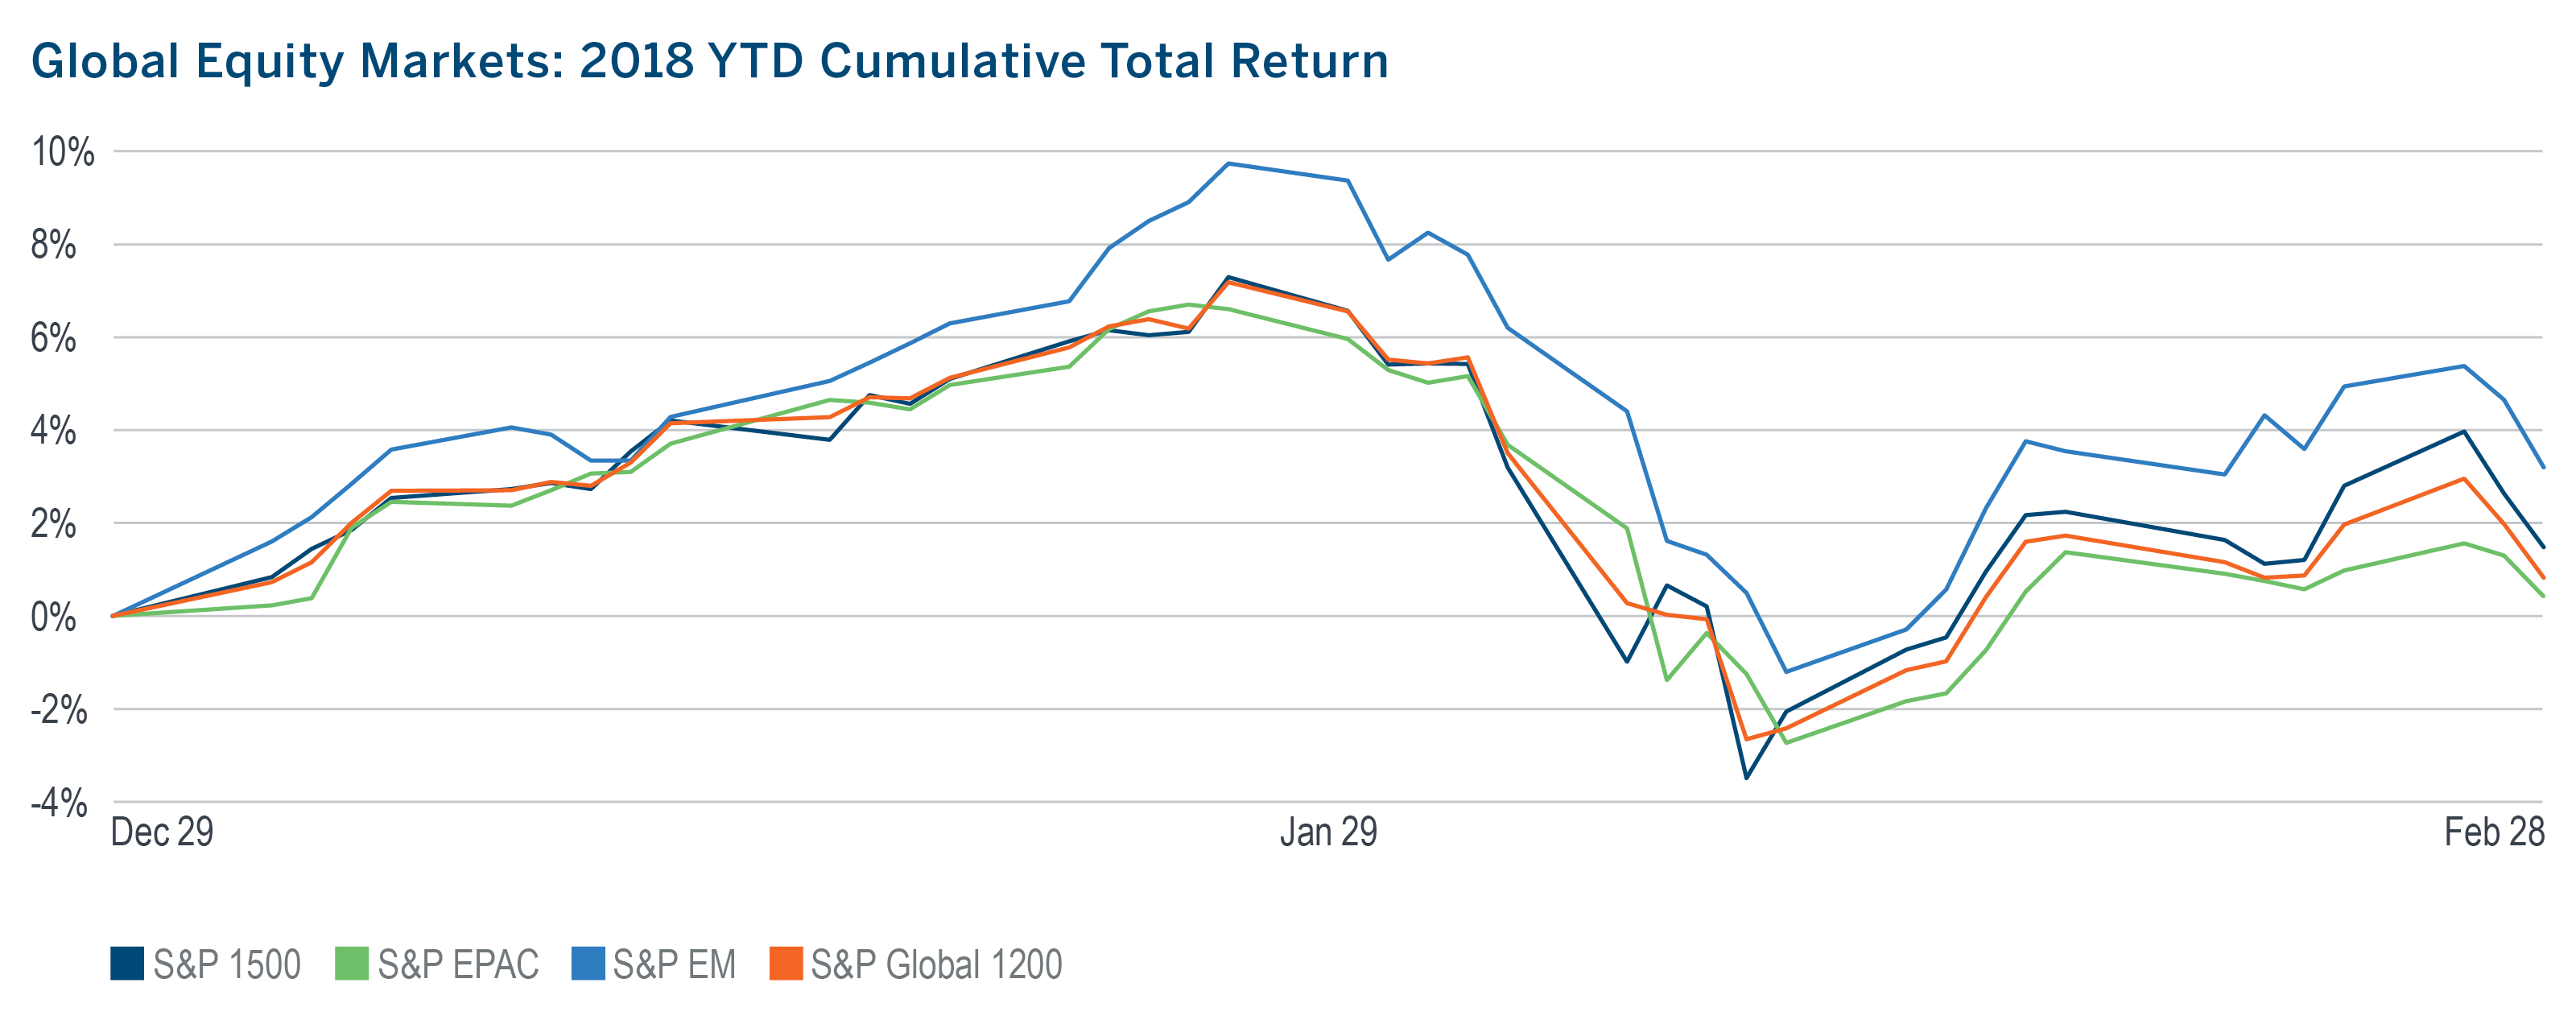
After 15 consecutive months of positive returns, the global equity market posted its first negative monthly return since October 2016 and its highest monthly volatility since June 2016.
Up more than 7% ytd into late January, the global equity market quickly changed direction and sold off more than 9% in less than two weeks.
February saw 12 daily moves in the S&P 500 of at least 1%, already 50% more than 2017’s total of eight. In addition to higher realized volatility, the VIX spiked to its highest level since August of 2015.
The start of February’s downturn coincided with two economic data surprises. Larger-than-expected growth in both payrolls and average hourly earnings triggered fears that the Fed would begin to tighten policy at a faster rate than previously expected.
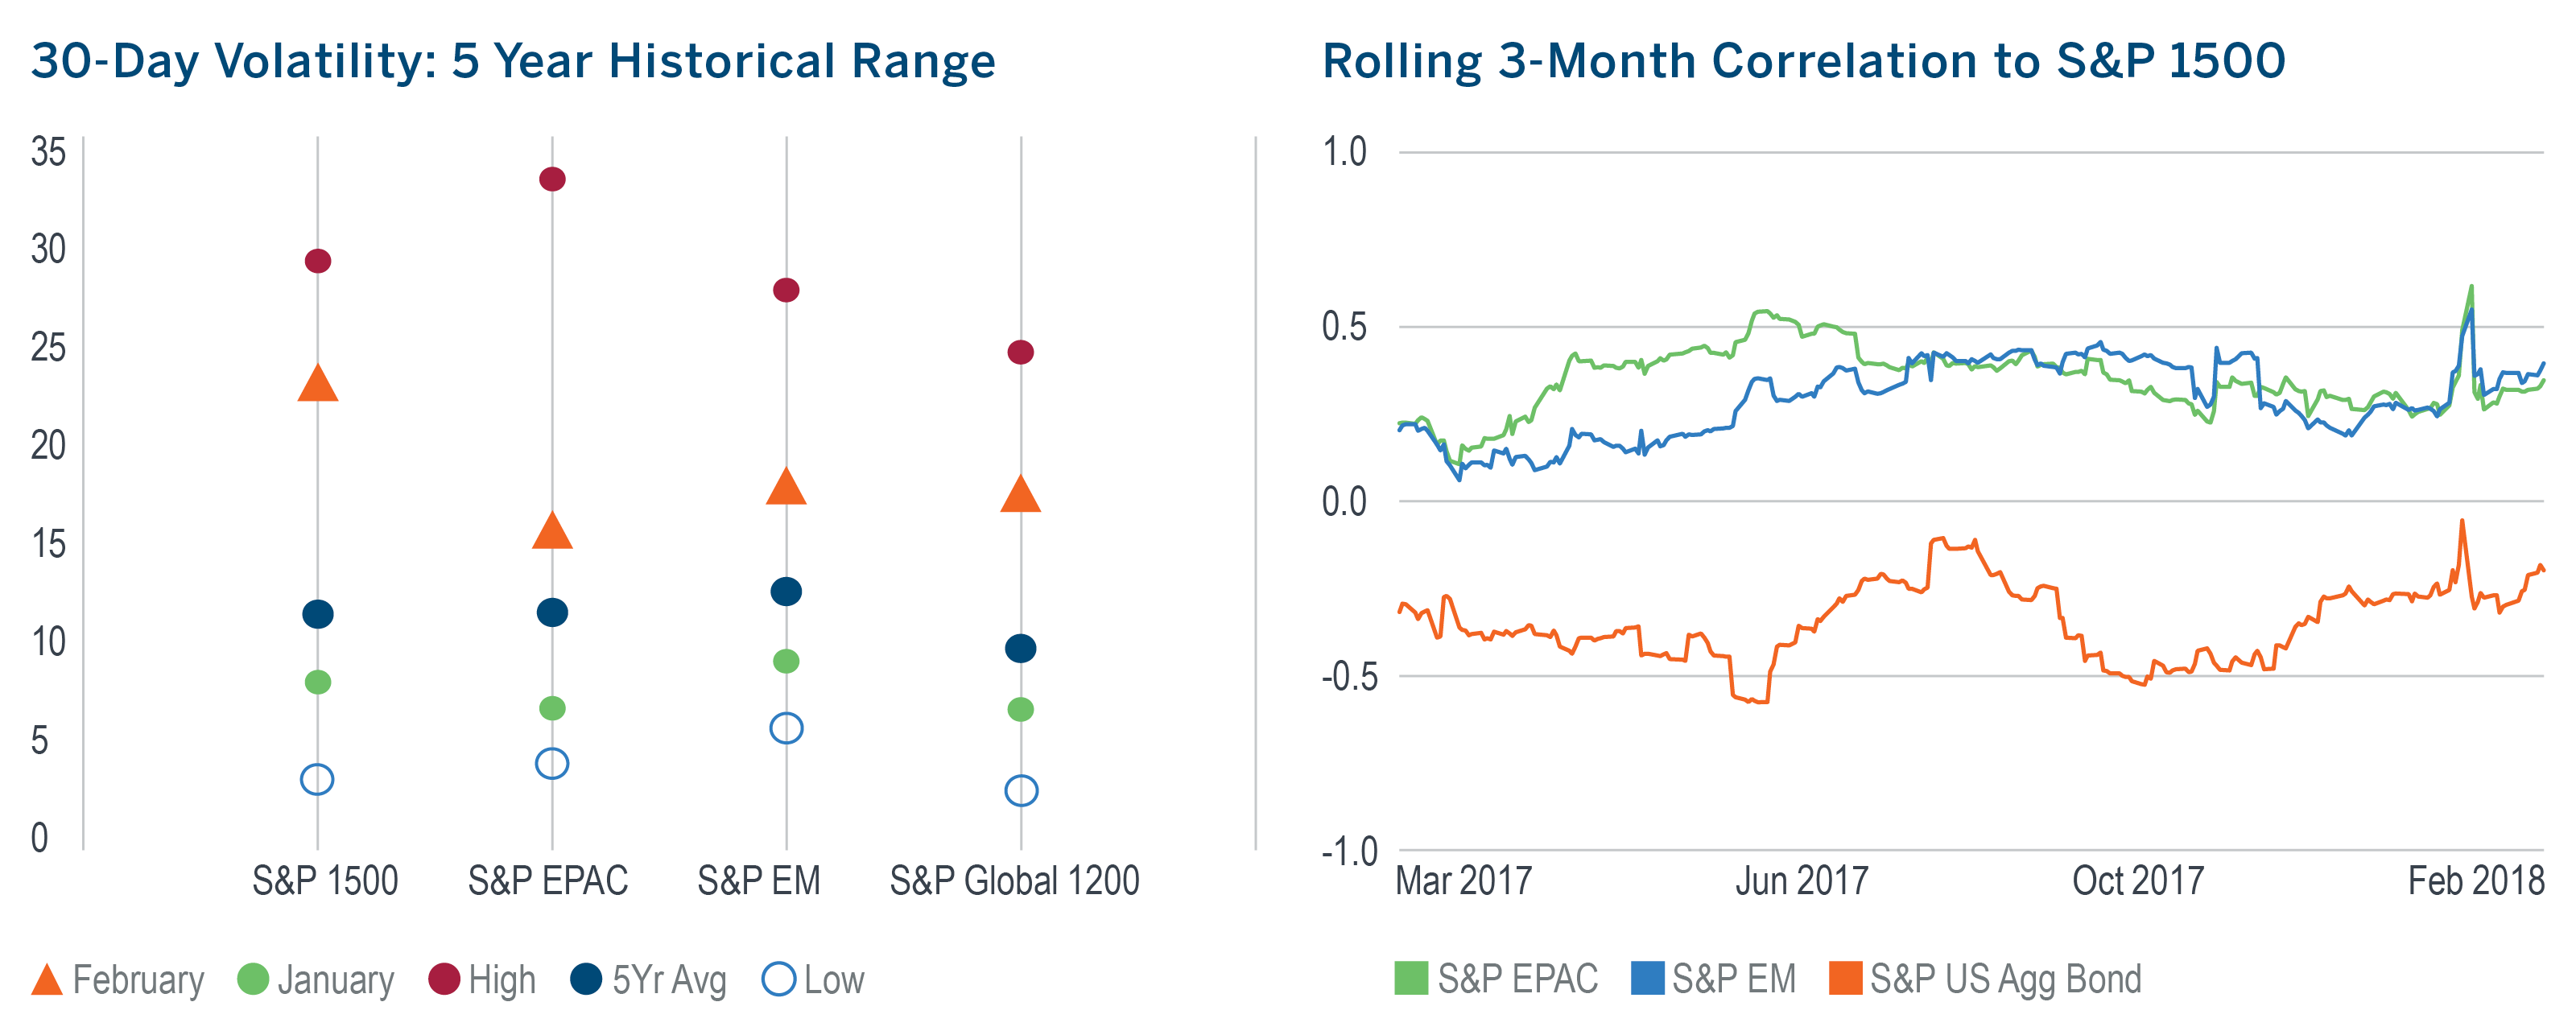
As is often the case in times of market stress, February’s downturn saw correlations across market segments and asset classes push higher.
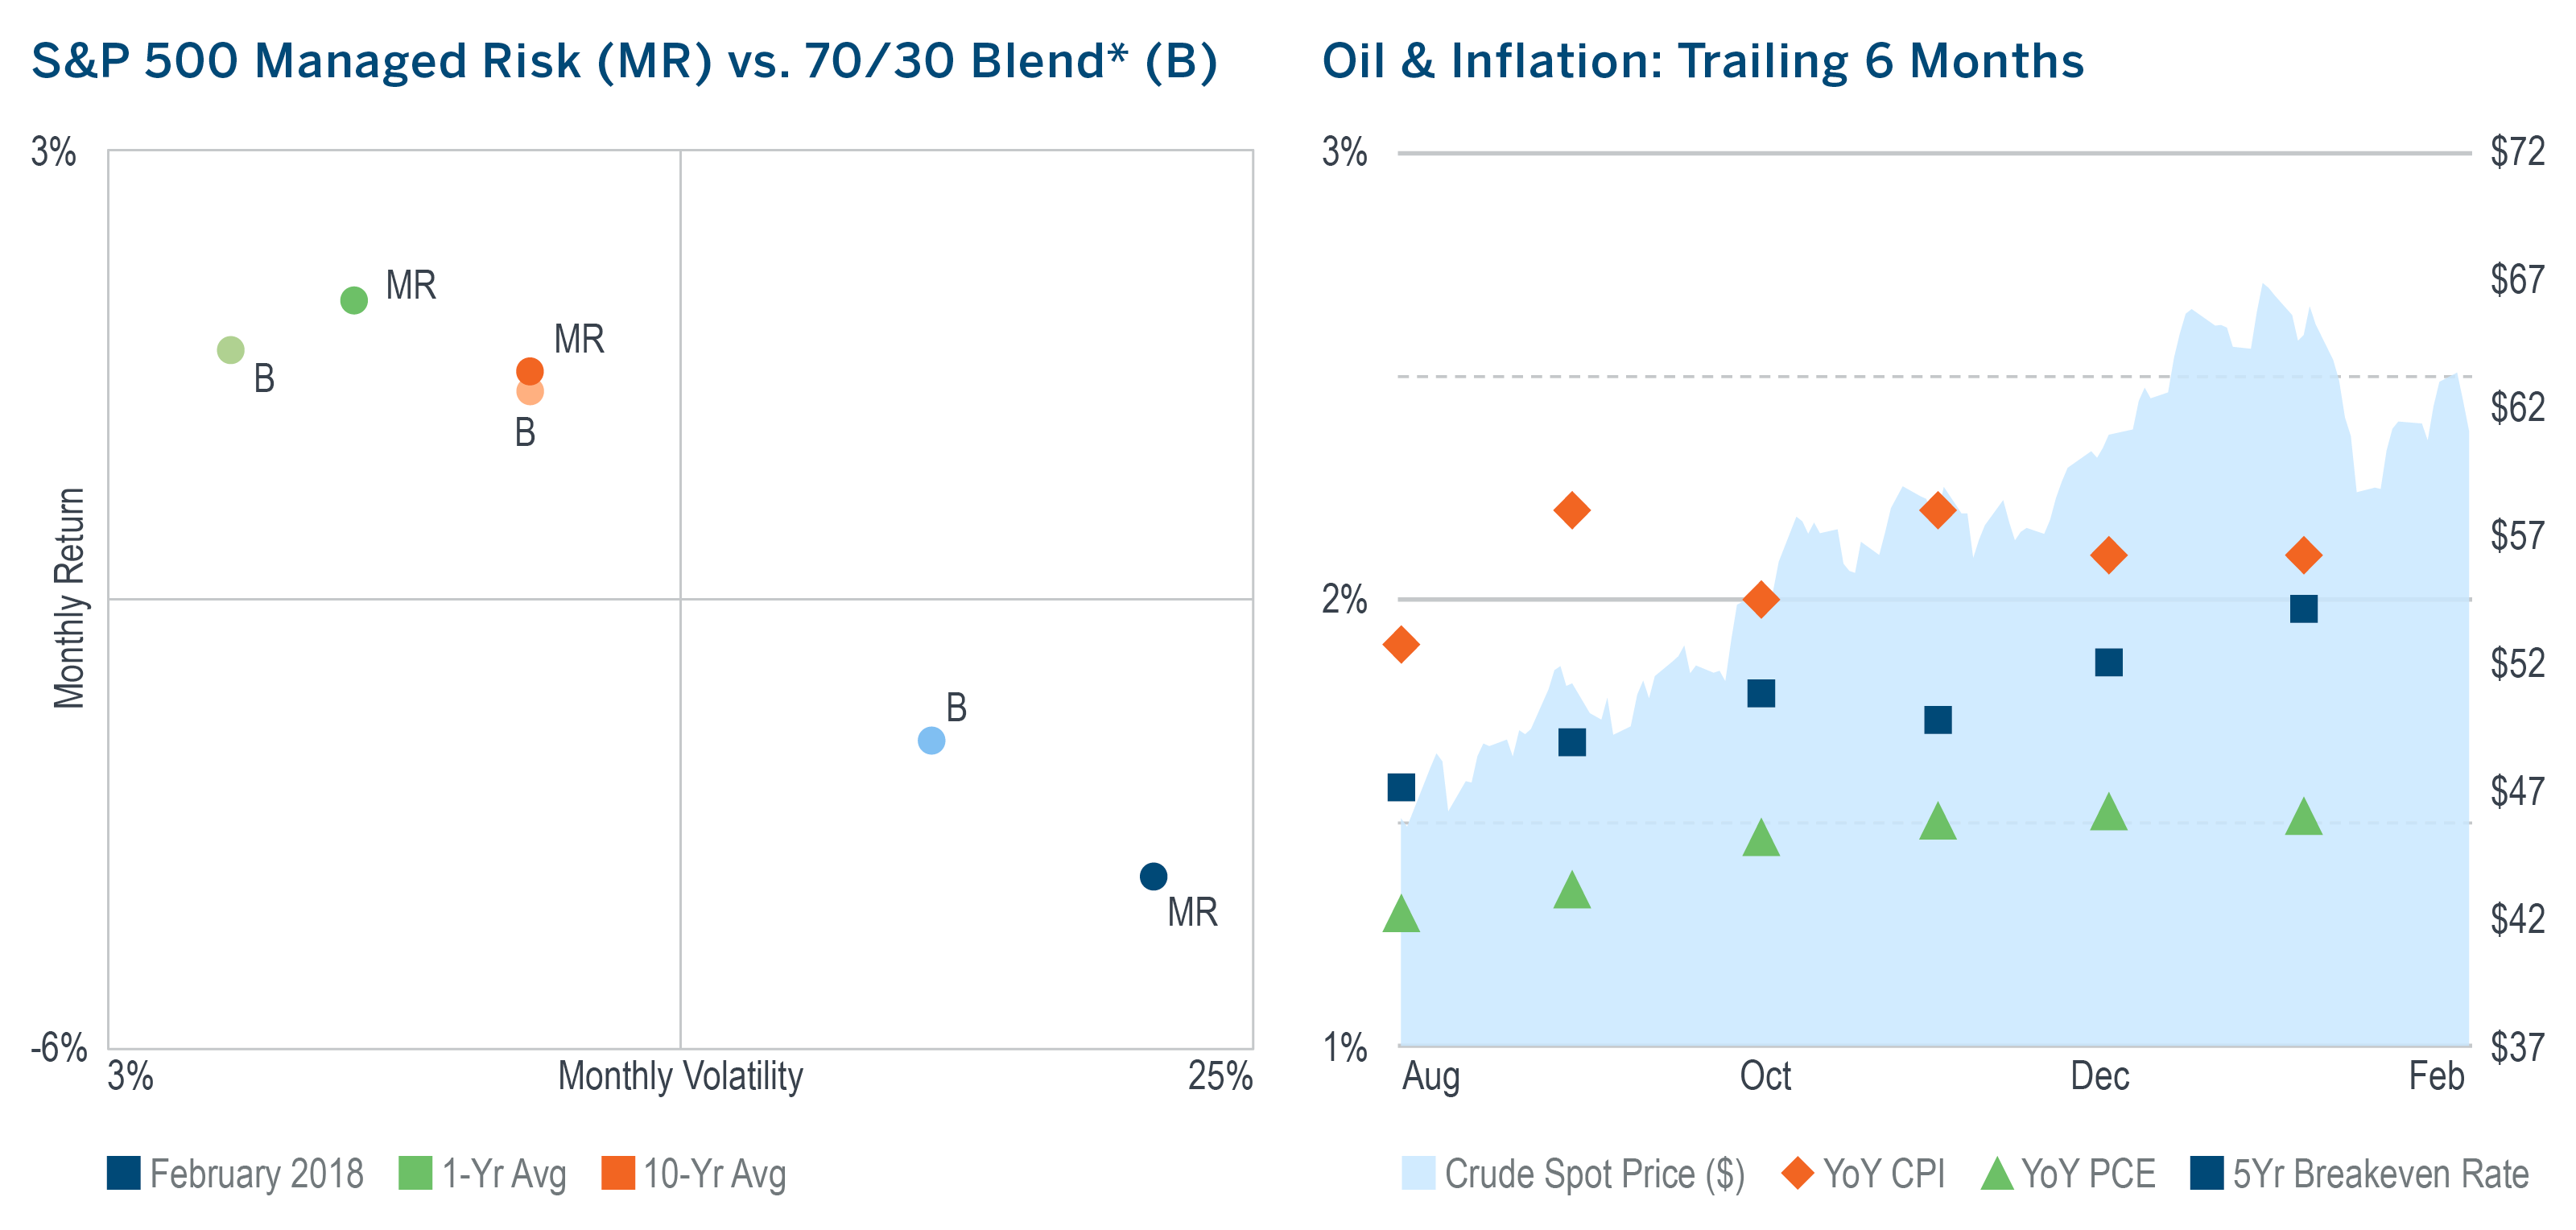
Managed Risk Investing
Higher market volatility in February meant that the S&P 500 Managed Risk Index, which has an 18% vol cap and no fixed allocation to bonds, reduced its equity allocation for the first time in 18 months. After starting February at a 100% equity allocation, it was reduced down to 60% before finishing the month at 72%.
Its hedge position helped to limit its participation in both the downturn and the subsequent upturn so that it exhibited less volatility than the S&P 500, but trailed its return by 59 bps for the month.
Over the last 10 years, the Managed Risk Index has exhibited the same average monthly volatility as a 70/30 blend*, while generating an average excess monthly return of 20 bps.
If early-month hints of higher inflation stoked fear, the mid-month release of actual inflation numbers probably helped to assuage it.
The price of oil finished the month lower, while year-over-year CPI and PCE were unchanged.
The US bond market’s return was negative for the second month in a row as rates moved higher and credit spreads widened.
*As measured by the S&P 500 Index and the S&P US Aggregate Bond Index.
Download pdf here
Recipients must make their own independent decisions regarding any strategies or securities or financial instruments mentioned herein.
The products or services described or referenced herein may not be suitable or appropriate for the recipient. Many of the products and services described or referenced herein involve significant risks, and the recipient should not make any decision or enter into any transaction unless the recipient has fully understood all such risks and has independently determined that such decisions or transactions are appropriate for the recipient.
Past performance is not indicative of future results. Index performance information is for illustrative purposes only, does not represent the performance of any actual investment or portfolio, and should not be viewed as a recommendation to buy/sell. It is not possible to invest directly in an index. Any hypothetical, backtested data illustrated herein is for illustrative purposes only, and is not representative of any investment or product.
Any discussion of risks contained herein with respect to any product or service should not be considered a disclosure of all risks or a complete discussion of the risks involved.
The recipient should not construe any of the material contained herein as investment, hedging, trading, legal, regulatory, tax, accounting or other advice. The recipient should not act on any information in this document without consulting its investment, hedging, trading, legal, regulatory, tax, accounting and other advisors.
The materials in this document represent the opinion of the authors and are not representative of the views of Milliman, Inc. Milliman does not certify the information, nor does it guarantee the accuracy and completeness of such information. Use of such information is voluntary and should not be relied upon unless an independent review of its accuracy and completeness has been performed. Materials may not be reproduced without the express consent of Milliman.
MIL_COM_1 2/18_2/19 © 2018 Milliman Financial Risk Management LLC
For financial professional use only. Not intended for public distribution. Unless otherwise noted, data is sourced from Bloomberg.