At Sprott, our investment thesis for gold is significantly long-term in scope. We believe gold’s methodical advance since 2000 has had more to do with the growing disconnect between productive output (GDP) and ever-inflating claims on that output (debt and equity valuations), than with short-term fluctuations in variables such as CPI-type inflation or interest rates. Because we view gold as a highly productive, portfolio-diversifying asset until such time as these gaping imbalances are finally resolved (through default or debasement or both), we are generally loath to focus on short-term projections for gold markets. However, the current alignment of fundamental, technical and quantitative factors underpinning gold markets has become so asymmetrical to the upside, we have developed high confidence for an imminent and potentially significant rally in precious-metal valuations.
Post-election advances in market-sentiment measures are now clashing head-on with intransigent U.S. realities of excessive debt, dismal productivity, structural under-employment and chronic economic stratification. In short, the Trump-induced reflation trade is dying a quick death amid epic (mis)positioning. In this report we provide a short precis of our updated reasoning for an allocation to gold, followed by a visual tour of our “top-ten” list of technical and quantitative factors we see powering gold’s developing advance.
In our 2017 Investment Outlook, we made the case that excessive U.S. debt levels all but preclude significant Fed tightening. We suggested that, with total U.S. credit-market debt of $66 trillion atop U.S. GDP of only $18.8 trillion, any sustained increase in fed funds target rates would catalyze immediate upticks in a wide array of financial-stress measures, as well as surging default rates in sketchier components of the U.S. debt pyramid. To us, the greatest shortcoming of consensus economic analysis has been failure to recognize the cumulative and corrosive damage which eight years of ZIRP and QE have inflicted on the market dynamics of nearly every global industry. By artificially depressing interest rates for so long, global central banks have destroyed time preferences, inflated sales by borrowing from the future, and completely distorted legacy sales practices and consumer buying habits. The U.S. has evolved into a “zero-down, zero-percent” society, for everything from cars to leaf-blowers, to jewelry to big-screen TV’s. Manufacturing supply chains have expanded across the globe, enabled by the reduced cost-of-time in a ZIRP world. The day of reckoning for trillions-of-dollars-worth of uncompetitive U.S. businesses (and credits) has been postponed by the palliative of illusory (ZIRP) financial conditions. As the Fed attempts to migrate from the zero bound, these profound economic changes will not be reversed without significant pain and dislocation.
We believe the three FOMC rate hikes since December 2015, (together with consequent U.S. dollar strength and curve-steepening), have already set in motion a cascading downward spiral in crucial sectors of the U.S. economy, such as retail and automobiles. Somewhat at odds with recent upticks in consumer sentiment, March retail sales (released 4/14) declined 0.2%. Together with February’s harsh downward revisions (from +0.1% to -0.3%), retail sales have now registered their steepest two-month tumble in over two years. During the same two months, the BLS reports payrolls shed 60,600 retail jobs (seasonally adjusted), the worst two-month drop since 2008. Ten U.S. retailers have already filed for bankruptcy during early 2017 (compared to only nine during all of 2016), with several industry heavyweights suddenly on the ropes (Sears, Gymboree, Nine West). Prominently featured in the current rash of retail insolvencies is a recurring theme of excessive corporate leverage. Morgan Stanley (3/29/17) reports major U.S. retailers shuttered 2,087 stores in Q1 2017, up nearly 70% from the Q1 2016 total. Bank of America (3/14/17) estimates that February U.S. department-store-spending collapsed at an historic 15% year-over-year pace.
We are not suggesting that weak retail sales and heightened stress among retail credits have arisen solely from recent Fed tightening. Obviously, there are monumental changes occurring in retail delivery channels. Our point is that eight years of ZIRP have delayed inevitable rationalization of hundreds-of-billions-of-dollars-worth of outdated retail formats and outmoded brick-and-mortar storefronts and malls. Three FOMC rate hikes have quickly ignited a painful reckoning process which will now crystalize significant capital losses throughout the retail sector. Each additional FOMC rate hike will only broaden and accelerate the writedowns.
No industry has been more disfigured by the Fed’s easy-money policies than the U.S. automobile industry. During the past eight years, cheap Fed credit has engrained zero-percent financing gimmicks at the very heart of U.S. automobile consumption. Contemporary auto-financing terms have evolved towards borderline ridiculous (record average principal balances, ever-lengthening loan periods, rising prevalence of negative-equity trade-ins). Lured by skinny “cost of money” calculations, lease penetration-rates roughly doubled in the five years through 2016. Even used-car pricing has remained remarkably buoyant amid such ample cheap credit.
Many will view as coincidence that key metrics in the U.S. auto industry have suddenly frayed amid the Fed’s December/March (FOMC) two-step. March U.S. vehicle sales slumped to 16.53 million SAAR (versus 17.3 million estimate), despite a 15% year-over-year increase in new-car incentives, to a record $3,768 per car, or 10.4% of average suggested retail (JD Powers). The all-important NADA used-car price index fell 3.8% in February, its sharpest decline since November 2008. Lease volumes have quickly reversed, coincident with accelerating rates of lease turn-ins, exacerbating the used-car pricing picture. Morgan Stanley (3/31/17) estimates the confluence of reinforcing factors now afoot in auto markets could lead to a 50% collapse in used-car pricing during the next five years. Figure 1: Cumulative % Net Losses by Subprime ABS Vintage (2006,7,8,15,16Q1,16Q2) [S&P, UBS]
As in the retail sector, the unfolding reversal of fortune in the auto industry cannot be blamed exclusively on the Fed’s recent tightening moves. However, eight years of ZIRP fostered huge imbalances between truly economic demand and artificially inflated consumption which will now plague auto manufacturers, creditors and financiers for years to come. Once again, every FOMC rate hike will only exacerbate the downturn. Given the fact that 2016-vintage subprime auto ABS structures are already underperforming 2007/2008 vintage securitizations (Figure 1, above), we view probabilities for two additional Fed hikes this year (and three more in 2018) as significantly below consensus.
Despite downticks in commercial bank lending and tightening of commercial banking standards during Q1 2017, U.S. equity markets continued to set new all-time highs. Consensus attributes buoyant equity markets to post-election upticks in sentiment measures and strengthening “soft” economic statistics. A popular theory suggests hard economic data will soon follow suit. We disagree strongly with this analysis. Importantly, we believe U.S. asset markets were given enormous support during the first quarter from an important source of liquidity which has garnered almost no attention in financial media.
Between 10/26/16 and 3/15/17, the U.S. Treasury drew down its “general account” balances at the Fed from $429 billion to $38 billion (Figure 2, below). Coupled with pro-rata credits of earned interest due the Treasury on Fed Treasury holdings (roughly $150 billion annually), Treasury withdrawals from its Fed account totaled some $450 billion in little over a four-month period. As the Treasury paid its bills with this cash (previously dormant on the Fed’s balance sheet), an amount of liquidity was injected into the commercial banking system equal to roughly 7% of GDP, or significantly greater than the rate of stimulus from QE3! Andy Lees (MacroStrategy Partnership) informs us that there is simply no historical precedent for such a concentrated drawdown of Fed balances by Treasury, the next closest having been drawdown of an amount half as large over a period twice as long, just prior to the market dislocation of August 2015. Over the next several months, we expect U.S. asset markets to feel a pronounced pinch from extinguishment of this unprecedented liquidity source.
Figure 2: U.S. Treasury Deposits on Federal Reserve Balance Sheet (2005-3/15/17)
[Federal Reserve, MacroStrategy Partnership]
In recent weeks, whether due to investor recalibration of Trump’s prospects in effecting lasting economic change, or simply due to growing recognition that even successfully implemented policies will take years to address legacy imbalances, market euphoria has clearly tempered. Simultaneously, we believe, cumulative effects of the Fed’s three rate hikes have set in motion a cycle of long-overdue debt rationalization. Complicating matters, the Atlanta Fed announced (4/14/17) that its GDPNow forecast for Q1 2017 has shrunk all the way to 0.5% (from 3.4% on 2/1/17), which would mark the weakest GDP growth during a quarter in which the Fed has hiked rates since Chairman Volcker did so in February 1980. Finally, as shown in Figure 3, on the following page, the U.S. Treasury reported 4/12/17 that trailing-twelve-month federal tax receipts posted in March their fourth straight month of year-over-year percentage declines (-1.3%), with corporate tax receipts measuring the steepest collapse (-16.7%) since September 2008. Perhaps tanking tax receipts shed a bit of light on the Treasury’s recent rundown of its Fed deposits!
Figure 3: Trailing 12-mos. Percentage Change Total Federal Tax Receipts (1972-March 2017)
[U.S. Treasury, Meridian Macro]
We expect the second quarter of 2017 to witness reversal of what we perceive to be unsustainable year-to-date trends in many asset, currency and interest-rate markets. By way of example, as shown in Figure 4, below, eroding expectations for GDP and S&P 500 earnings have yet to be reflected in valuations for the S&P 500 Index itself. Something has to give, and reigning equity valuations appear substantially vulnerable.
Figure 4: S&P 500 Index, Consensus Estimates S&P 500 2017 EPS, Atlanta Fed Q1 2017 GDPNow
(1/1/17-4/13/17) [Bloomberg, Atlanta Fed, Zero Hedge]
With respect to precious metals, we have rarely observed such a confluence of gold-supportive technical and quantitative variables across such a wide spectrum of relevant asset classes. While we are the first to admit no one can predict the future path of the gold price, we are intrigued by the degree to which these traditional valuation tools are aligning in gold’s favor. In the next section of this report, we present a largely visual review of the ten most compelling variables supporting our contention that gold prices are poised for a potentially significant advance. Given dominant institutional positioning and proximity to important support levels for each of these variables, the slope of the gold advance we envision may prove surprisingly steep.
© Sprott Asset Management
Read more commentaries by Sprott Asset Management
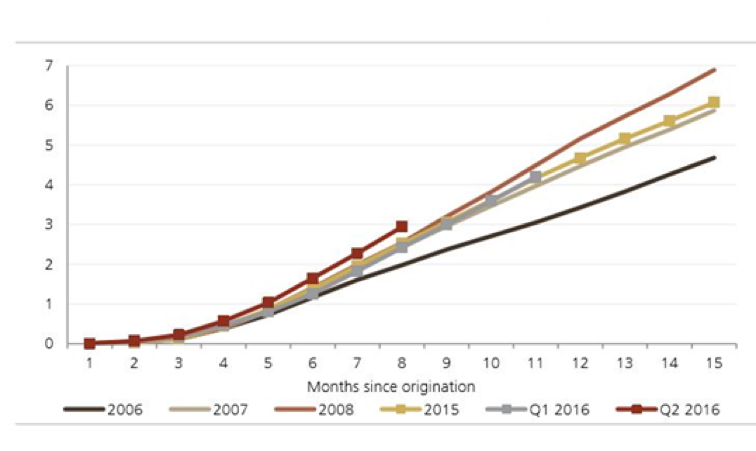 Figure 1: Cumulative % Net Losses by Subprime ABS Vintage (2006,7,8,15,16Q1,16Q2) [S&P, UBS]
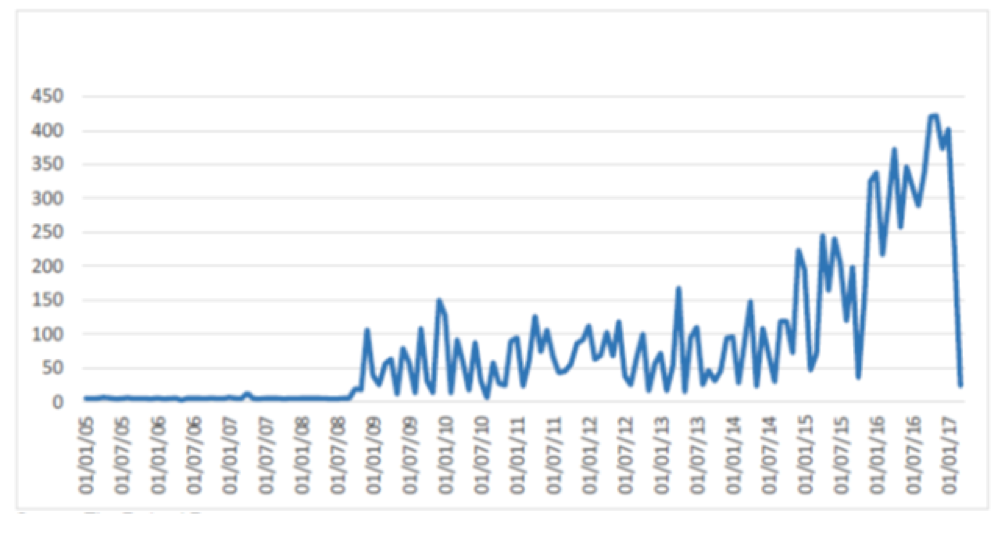 Figure 2: U.S. Treasury Deposits on Federal Reserve Balance Sheet (2005-3/15/17)
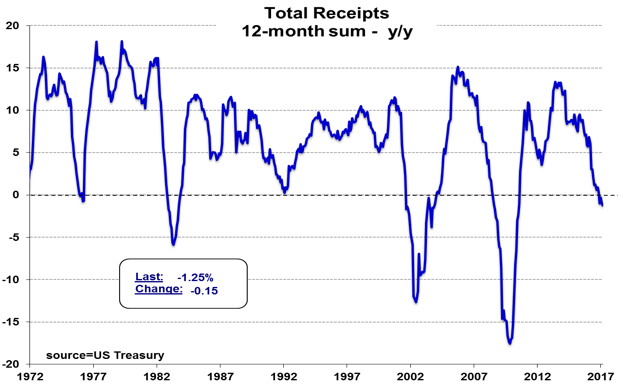
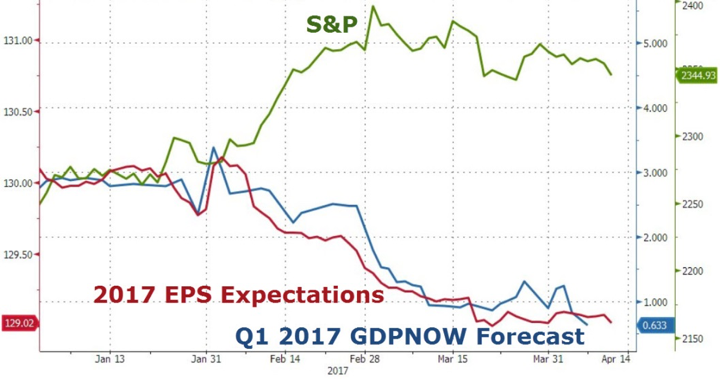 Figure 4: S&P 500 Index, Consensus Estimates S&P 500 2017 EPS, Atlanta Fed Q1 2017 GDPNow


