The S&P 1500 notched its seventh consecutive calendar month of positive returns amidst exceptionally low volatility.
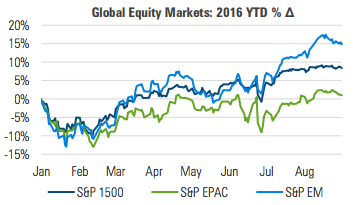
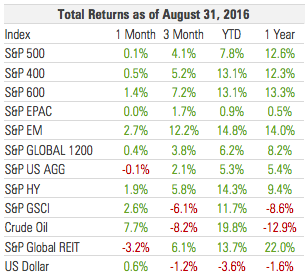
EM EQUITIES SOLIDIFIED THEIR LEADERSHIP AS GLOBAL STOCK MARKETS EXTENDED POSITIVE YTD PERFORMANCE
Emerging market equities finished the month 2.7% higher, while US and international developed markets struggled to generate momentum:
Figure 1
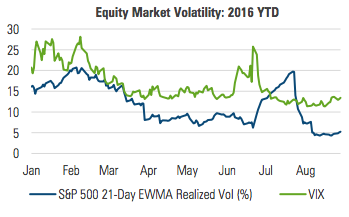
In August the realized volatility of the S&P 500 was 5.8%. Since the turn of the century, the only calendar month to exhibit lower volatility was November 2014:
Figure 2
MANAGED RISK PORTFOLIOS
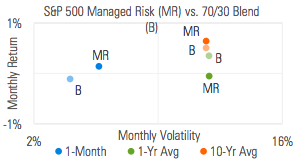
The S&P 500 Managed Risk Index (which has a 0% bond allocation and volatility target of 18%) ended July with an equity allocation of 100% and maintained that allocation throughout the month of August amidst exceptionally low market volatility.
Given its 100% equity allocation throughout the month, the return of the S&P 500 Managed Risk Index matched that of the S&P 500, and marginally outperformed a 70/30 stock/bond blend:
Figure 3
“Don’t put all your eggs in one basket” is an interesting, if not slightly misleading expression. It brings to mind earlier times when farmers might take their eggs into town to sell at the local market or general store.
A farmer operating by this guideline might distribute his eggs into several baskets before taking them into town so that if one basket is dropped, he’d still have other baskets of eggs to sell.
What this expression fails to capture is the circumstances that might cause a basket to be dropped in the first place. Sometimes external circumstances play no role; the farmer may simply lose his grip on the basket and drop it. Other times, external circumstances come more into play. Whether travelling by foot, by horseback, or by wagon, if the path becomes more difficult to travel, all of the eggs (whether in one basket or several) face a greater chance of being broken.
For the farmer to reduce the likelihood of losing eggs, he’ll need to understand and manage the risks. That may mean waiting for more favorable road conditions or working with someone who can help.
This idea also holds true with stock investing. As markets become more volatile, they often become more correlated at the same time. As indicated in figure 4, the correlations of international equity and EM equity to US equity over the last year tended to increase when global stock market volatility rose:
Figure 4
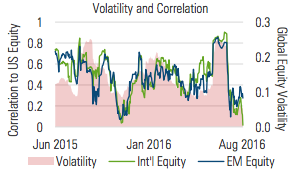
If correlations increase as volatility rises, the risk-management benefit of diversification is diminished.
Rather than relying solely on diversification for risk management, a managed risk approach seeks to maximize equity exposure while pursuing a volatility target.
By dynamically reducing its equity allocation during periods of high volatility, a managed risk approach mitigates a portfolio’s participation in the largest drawdowns while seeking to maximize participation when volatility is low.
MARKET COMMENTARY
While all broad segments of the global stock market finished the month higher, they did not all move with the same magnitude. The traditionally riskier segments saw larger moves while others were more muted. In the US, small cap stocks lead the way, pushing their year-to-date return to 13.1%. Outside the US, EM stocks returned 2.7%, raising their 2016 return to 14.8%.
European equity markets, as measured by the Euro Stoxx 50 Index finished August higher, but remain 5.1% in the red year to date. UK stocks moved higher even as the pound finished the month largely unchanged.
Investors also sought out higher risk in fixed income markets as high yield bonds returned 1.9% while the US aggregate investment grade bond market finished marginally lower.
What a difference a year makes. In 2015, August was the most volatile month. Year to date in 2016 it is the least volatile. Heading into August 2015, a Fed rate hike seemed to be a real possibility, until the market sharply sold off in response to intervention by the Chinese government:
Figure 5
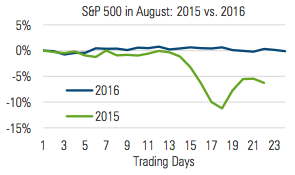
One year, and one rate hike later, investors looked to the Fed’s Jackson Hole symposium in late August for hints about the future of monetary policy. Fed Chair Janet Yellen explicitly expressed confidence in the effectiveness of monetary policy, but also admitted that the “pre-crisis toolkit was inadequate to address the range of economic circumstances that we faced.”
She went on to note that, “policy makers…may wish at some point to consider additional [policy] options,” implicitly acknowledging the limits of monetary policy. Fiscal policy is one of the options she and others mentioned during the symposium. The same idea was discussed in these pages earlier this year, although not from the demand-side approach that seems to be prevalent at the Fed.
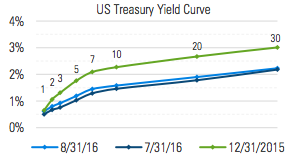
The US yield curve shifted slightly higher in August, perhaps in response to increased expectations of an increase in the fed funds rate before the end of the year. Not unlike stocks, the yield on the 10-year Treasury bond was stable, trading in a narrow range between 1.5% and 1.6%:
Figure 6
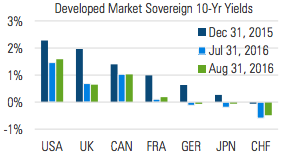
Outside the U.S., yields were also stable, in most cases finishing the month marginally higher, but still well below levels from the beginning of the year:
Figure 7
INFLATION: TO HEDGE OR NOT TO HEDGE?
When it comes to deciding whether or not to hedge inflation with Treasury Inflation Protected Securities (TIPS), arguably the most important consideration is an investor’s expectation of inflation relative to the market’s expectation.
TIPS differentiate themselves from traditional Treasury bonds in three basic ways:
1. Their principal increases with inflation, as measured by the Consumer Price Index.
2. The rate of interest paid by TIPS is a function of the adjusted principal, which means the interest payments can rise and fall with inflation and deflation.
3. At maturity, investors are paid the greater of the adjusted principal or the original principal.
One way the market signals its expectation for inflation is through the difference between the yields of TIPS and their corresponding nominal Treasury bonds.
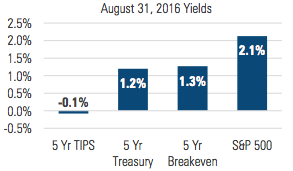
For example, at the end of August, the 5-year TIPS yield was -0.1%, while the 5-year Treasury bond yield was 1.2%. Given that both securities have the same credit risk, the excess yield on the 5-year Treasury bond can be viewed as an inflation premium. It’s what the market is demanding as compensation for inflation over the next 5 years. Sometimes it’s referred to as the “breakeven rate”, referring to the minimum amount of inflation necessary for TIPS to generate the same return as nominal Treasury bonds of the same maturity.
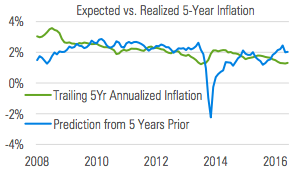
So how reliable has this measure of expected inflation actually been at predicting inflation? The Federal Reserve maintains indexes of constant maturity TIPS yields. Subtracting these yields from their Treasury bond counterparts offers a time series of historical inflation expectations:
Figure 8
Subtracting the blue line (predicted) from the green line (realized) generates the following chart, showing how much inflation exceeded or fell short of expectations:
Figure 9
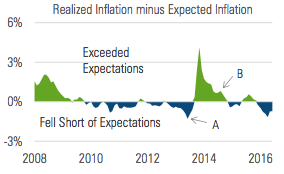
In figure 9, point A shows that the 1.3% annualized five-year rate of inflation on June 30, 2013 fell short of the expectation of 2.3% from five years earlier. Point B shows that the 2.0% annualized five-year rate of inflation on July 31, 2014 exceeded the expectation of 1.3% from five years prior.
The instances where inflation exceeds expectations by a wide margin are associated with the financial crisis and the bursting of the tech bubble. In those instances, it wasn’t that inflation was abnormally high, but rather that expectations were abnormally low.
Apart from these periods of market turmoil, inflation in recent years has tended to fall short of expectations. When that happens, Treasury bonds outperform TIPS.
However, even if inflation exceeds expectations going forward, we believe the low starting yields and high level of interest rate risk result in a risk/reward profile that make TIPS and Treasury bonds a relatively unattractive option for investors:
Figure 10
If the yield on a five-year Treasury bond purchased at the end of August increased 25 basis points by year end, the loss would be approximately 1% in four months. A move of that magnitude would be even worse for TIPS. As bad as that sounds, there is recent precedent for even greater severity.
In 2013 when then Fed chair Ben Bernanke hinted at the possibility of tapering Fed asset purchases, the yield on the fiveyear Treasury increased 120 bps, from 0.65% to 1.85% in four months, resulting in a total return of -4.6%.
Figure 11
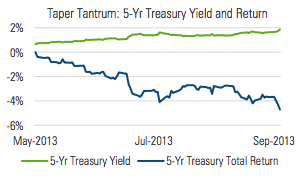
The Fed didn’t end up tapering until many months later, but the event is nonetheless illustrative of the extent to which bonds can be affected by just the prospect of tighter monetary policy.
So what are investors to do? With bonds, they face the risk of rising rates, while with equities they face the risk of volatility. Surveying such a landscape can be a discouraging prospect, but it need not end in a “pick your poison mentality.”
We believe the higher dividend yield of stocks along with their ability to keep up with inflation make them more appealing than bonds. A managed risk approach to equity investing can offer investors a way to hedge inflation while also seeking to manage the risk of market volatility and protecting against severe and prolonged drawdowns.

Milliman Financial Risk Management LLC is a global leader in financial risk management to the retirement savings industry. Milliman FRM provides investment advisory, hedging, and consulting services on over $166 billion in global assets (as of June 30, 2016).
Established in 1998, the practice includes professionals operating from three trading platforms around the world (Chicago, London, and Sydney).
Milliman is among the world's largest providers of actuarial and related products and services. The firm has consulting practices in healthcare, property & casualty insurance, life insurance and financial services, and employee benefits. Founded in 1947, Milliman is an independent firm with offices in major cities around the globe.
For further information: MILLIMAN.COM/FRM