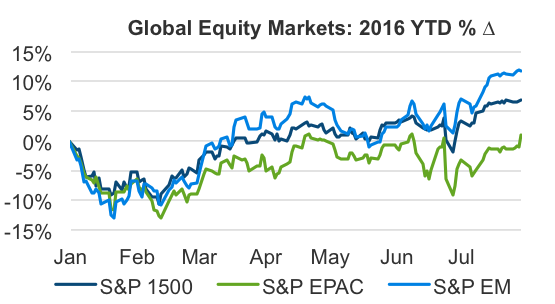
STRONG PERFORMANCE IN JULY PUSHED INTERNATIONAL DEVELOPED MARKETS INTO THE BLACK YEAR-TO-DATE
As 2016 has unfolded, the disparity between international developed equity markets (EPAC) and the rest of the world has become increasingly pronounced:
Figure 1
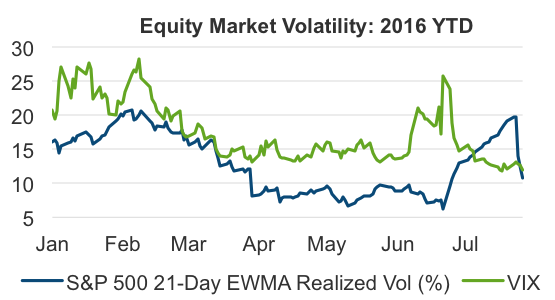
The first half of 2016 began and ended with sharp increases in volatility. To start the second half, implied volatility steadily declined even as realized volatility increased before dropping off sharply at the end of the month:
Figure 2
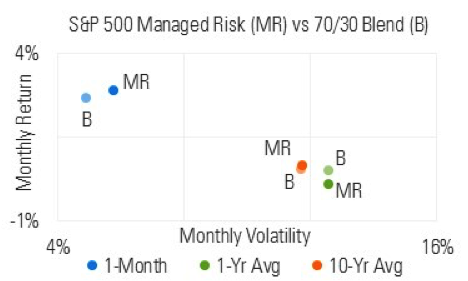
The S&P 500 Managed Risk Index (which has a 0% bond allocation and volatility target of 18%) began July with an equity allocation of 70%. As Brexit-related volatility moderated, the index steadily increased its equity allocation, finishing the month at 100%.
Relative to its 1-year and 10-year averages, the S&P 500 Managed Risk Index in July generated a return that was higher with volatility that was lower:
Figure 3
In years past, conventional risk management has relied almost exclusively on diversification via asset allocation. At a basic level this has meant maintaining an allocation of bonds alongside an equity portfolio. To the extent that such an approach has been effective, it has in large part been a function of the bond market environment over the past several decades.
In addition to low correlation, bonds also provided a source of meaningful returns. Today, however, bond yields have never been lower and their interest rate sensitivity never higher:
Figure 4
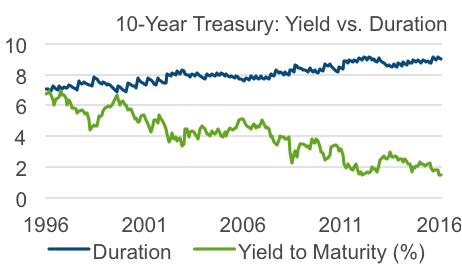
In the face of such a poor risk/return trade off, bonds no longer offer the viable diversifying, risk-managing characteristics that they did in decades past.
Rather than relying solely on a fixed allocation to bonds for risk management, a managed risk approach seeks to maximize equity exposure while pursuing a volatility target. By dynamically reducing its equity allocation during periods of high volatility, a managed risk approach mitigates a portfolio’s participation in the largest drawdowns while seeking to maximize participation when volatility is low.
MARKET COMMENTARY
With the Brexit vote still close in the rear view mirror, the U.S. stock market as measured by the S&P 1500 Index generated a total return of 3.8% in July, its sixth consecutive positive monthly return. Small cap stocks have led the way.
In Europe, the stock market has left little doubt about who it perceived to be the winners and losers after the Brexit vote. The FTSE 100 Index, comprised of the 100 most highly capitalized companies traded on the London Stock Exchange, is 8.3% higher since the end of May. Meanwhile, the Euro Stoxx 50 Index is down 1.8% over the same period.
For all the pre-vote prognostications of how poorly the UK would fare outside the EU, the resulting depreciation of the pound has buoyed UK equities and made UK exports cheaper.
|
Total Returns as of July 31, 2016 |
||||
|
Index |
1 Month |
3 Month |
YTD |
1 Year |
|
S&P 500 |
3.7% |
5.8% |
7.7% |
5.6% |
|
S&P 400 |
4.3% |
7.1% |
12.6% |
5.5% |
|
S&P 600 |
5.1% |
7.5% |
11.6% |
6.0% |
|
S&P EPAC |
5.0% |
0.9% |
0.9% |
-6.9% |
|
S&P EM |
5.1% |
5.6% |
11.8% |
1.0% |
|
S&P GLOBAL 1200 |
4.3% |
4.0% |
5.8% |
0.8% |
|
S&P US AGG |
0.6% |
2.2% |
5.4% |
5.2% |
|
S&P HY |
2.3% |
4.5% |
12.1% |
5.6% |
|
S&P GSCI |
-9.3% |
-5.8% |
8.9% |
-10.3% |
|
Crude Oil |
-13.5% |
-10.3% |
11.2% |
-14.0% |
|
S&P Global REIT |
4.6% |
9.9% |
17.5% |
18.5% |
|
US Dollar |
-0.4% |
1.8% |
-4.2% |
-2.3% |
After trending sharply lower in June, interest rates in July continued to move lower during the first week before rebounding and finishing the month largely unchanged:
Figure 5
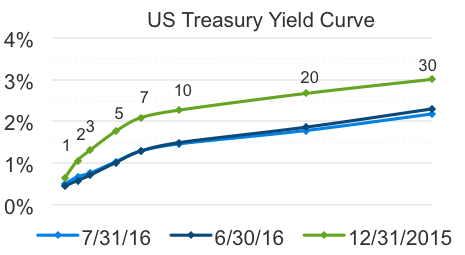
Outside the U.S., the pessimistic outlook kept yields in low or even negative territory. Germany issued the eurozone’s first negative-yielding 10-year bond at auction, while in Switzerland not a single government bond at any point on the curve offered a positive yield to maturity at month end.
From June 23 (the day before the vote) through the end of July, the 10-year UK sovereign yield fell nearly 70 basis points, reducing its yield by half, even as the value of British pound declined by 10% against the euro and US dollar.
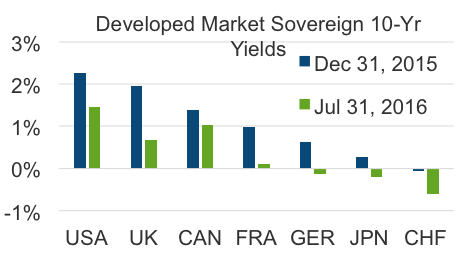
Figure 6
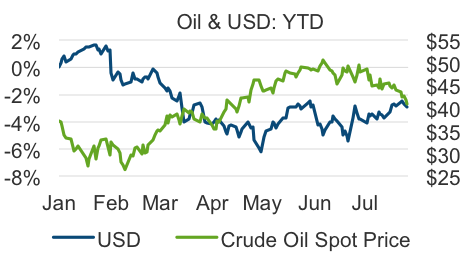
July’s release of GDP data registered a year-over-year expansion of the US economy by a meagre 1.2%. Oil was down 13.5% in July (its largest monthly decline since July 2015) as additional production came on line and inventories remained elevated. The US dollar was down marginally during the month, reflecting ongoing expectations of a relatively dovish Fed policy stance:
Figure 7
HAVE CENTRAL BANKS BECOME TOO IMPORTANT?
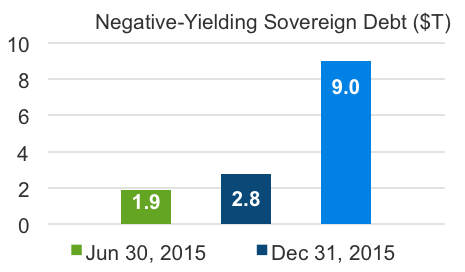
As yields around the globe have moved lower, zero continues to prove not to be a lower bound. The downward shift in the world’s yield curves has resulted in an increasing amount of the world’s sovereign debt trading at a negative yield.
As indicated in figure 8, the face value of developed market sovereign bonds (as measured by the BofA ML Global Government Index) trading at negative yields has increased more than fourfold in the last year. When yields hit their low on July 8, negative yielding debt had increased to $9 trillion (38% of the face value in the index), from less than $2 trillion in June 2015. This does not include the $1.5 trillion of inflation linked bonds that also trade at negative yields:
Figure 8
In some sense, negative yields seem like a contradiction. Who in their right mind would buy a bond knowing that, held to maturity, it will lose money? How does it make sense that the issuer of a bond should get paid for borrowing money rather than the investor for lending it? It seems to contradict the most fundamental tenets of investing.
Or does it? To borrow a quote from Atlas Shrugged, “Contradictions do not exist. Whenever you think that you are facing a contradiction, check your premises. You will find that one of them is wrong.”
If nothing else, negative yields imply heightened uncertainty and lack of confidence about the future. By accepting negative yields, investors seem to be saying that they prefer the small, but predictable losses from negative yielding bonds than the uncertainty of putting the money elsewhere.
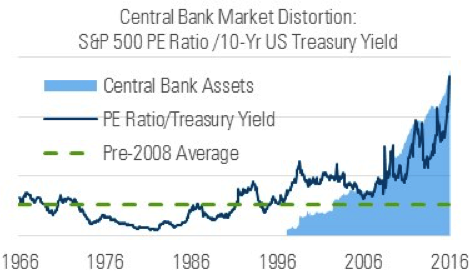
At the same time, investors who need greater returns than bonds can offer are piling into stocks, pushing valuations to their highest level in more than five years. Considering yields and valuations together paints a picture of market distortion, the likes of which hasn’t been seen in the last 50 years:
Figure 9
Arguably the greatest contributor to this dynamic is the increased role and level of involvement of central banks in the global, post-crisis economy. In the years after the financial crisis, assets at the Fed, ECB and Central Bank of Japan have grown to more than $12 trillion while short-term rates have been kept near or below zero. This prolonged accommodation and the uncertainty surrounding its curtailment are having a distorting effect.
A business owner or investor may have a firm understanding of economics and how markets work, but who can truly know the changing mind of a central banker? In 2016 alone, sentiment among Fed governors has shifted significantly. How are investors and business owners to plan confidently for the future when the future of monetary policy is so uncertain?
In 2016 the Federal Reserve has issued 25 press releases and its governors have made no less than 19 public speeches. Each of these gets reported in part or whole by the media around the world. From a behavioral perspective, this arguably inflates the importance of the Fed and its counterparts to levels that are less than optimal for the healthy functioning of the global economy.
In the minds of consumers and investors, it leaves the central banks seeming indispensable for the economy to operate. In the minds of central bankers, it arguably biases them toward action that serves to maintain a heightened level of their own (perceived) importance.
How might the economy perform if participants weren’t hanging on every word the central banks utter or waiting on pins and needles for every policy announcement? How would entrepreneurs, business owners and investors (who are subject to real profits and losses) act differently if unpredictable central bankers (non-economic investors) weren’t such a disproportionate determinant of the cost of credit and liquidity?
To the extent that it would reduce uncertainty and in turn generate greater economic activity, the Fed and the other central banks would do well to reduce their involvement in financial markets and make themselves less important. Of course saying it is one thing and doing it is another. It goes against the grain of human nature; everyone wants to be more important, not less.
Setting that aside for a moment, even if Fed policy were perfectly predictable, its efficacy is being offset by its own heightened regulations. While the Open Market Committee continues to provide a high level of accommodation, the Fed’s regulatory arm is implementing rules to contain risk in the banking system. This has the effect of putting downward pressure on the supply of credit and upward pressure on its cost:

To quote President Lincoln, “a house divided against itself cannot stand.” In an environment such as this, where yields are low or negative, investors can ill afford to forego equity exposure. At the same time, as Fed-generated uncertainty persists, proactively managing the risk of equity exposure remains critically important.


