Q: You have often made comments about ‘performance chasing,’ and its impact on investor outcomes. What do you say to the patient investor who is understandably frustrated at the length of this bear market in “Third Pillar” assets?
Robert Arnott: I completely understand the frustration. Even though most investors have far less invested in the Third Pillar than they invest in U.S. stocks, a grinding three-year bear market in an unfamiliar set of asset classes is painful and is clearly testing our investors’ patience. We are grateful for your steadfastness and confidence during this daunting bear market in Third Pillar markets.
We think investors urgently need three things that our conventional Two Pillar investments (mainstream U.S.-centric stocks and bonds) will not provide: true diversification into out-of-mainstream markets, attractive relative valuations, and protection from rising inflation expectations. Many of you chose our strategies for these very reasons. The early weeks of this year are reminding us why we wanted diversification in the first place and are showcasing our very low correlation with mainstream stocks and bonds; we’ve been up on some of the very worst days for U.S. stocks.
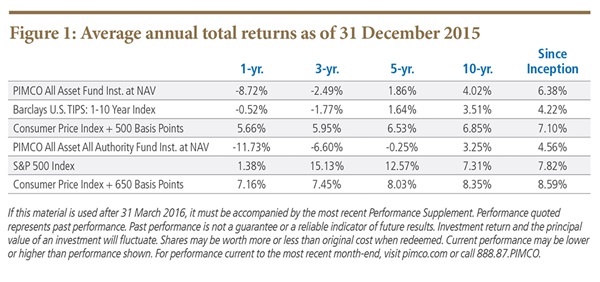
The three years from 2013 through 2015 delivered a 7% loss in the All Asset Fund. Objectively, this is not a bad outcome in a bear market. But itfeels awful, given the superb performance of our core First Pillar (mainstream stock) investments. All Authority lightly leverages this loss, and then shorts U.S. stocks (in a continuing bull market) to reduce our beta, and to pare back the only risk we have that’s highly correlated with our clients’ Two Pillar core holdings. That’s a “Texas hedge.” The result? A three-year return of -18%. Ouch!
With bonds sharply lagging stocks from 2012 to 2015, few investors have bailed out of bonds in frustration. Bonds are familiar diversifiers. The Third Pillar is less familiar; it’s a relatively new category of diversification for most investors. So, we’re seeing the consequences of a three-year bear market in Third Pillar asset classes, paired with the pain of experiencing losses in unfamiliar markets (“I didn’t really have to buy these markets, after all … get me outta here!”).
Asset allocation relies on diversification across time, as well as diversification across markets. Diversification across time is sometimes wonderful and sometimes painful. Three years ago, I said that there are no bargains, that everything is fully priced, including the Third Pillar markets. Despite these concerns, money was pouring in. Back then, we said that we’re watching and waiting for the Third Pillar to be priced at bargain levels, and that this would happen when investors are more concerned about deflation than inflation. That time is now.
Naturally, now that there are some excellent bargains in the Third Pillar, and inflation fears have evaporated (creating high odds of rising inflation expectations), we’re seeing outflows. Inflows and outflows are entirely normal in our business, and they are almost always trend-chasing. I do find it disheartening to know – beyond any reasonable doubt – that most of these redemptions are moving out of our bargain markets, and back to mainstream markets that offer nosebleed valuations and painfully low yields.
Most investors chase past performance, not future performance. Why? Most investors want more of whatever investments have given them great joy and profit, and will shun whatever investments have caused them pain, even if the prospective future returns are now horrible on the former and excellent on the latter. It’s in our blood to behave this way! From an evolutionary standpoint, we are conditioned to seek the safety of crowds and view being outside the herd as risky.
When some of our investments have treated us very well, providing comfort and profit in an environment of optimism and complacency, we want more of the same, even though we know that markets reward neither comfort nor performance-chasers. When fear and pessimism are endemic, investors feel pain from even modest losses; the natural reaction is to exit whatever is causing pain. And yet, fear and pessimism create bargains. Bargains cannot exist in the absence of fear!
Our urge to double down on recent successes and abandon yesterday’s laggards is so powerful that most investors, individual and institutional alike, inflict devastating damage to their wealth, by buying high and selling low. In previous Insights, I’ve referred to Russell Kinnel’s seminal “Mind the Gap” white paper for Morningstar, which shows that the average mutual fund delivers dollar-weighted returns averaging 280 basis points less than their time-weighted returns.1 Funds earn terrific results on a modest asset base, attracting inflows; the disappointments are then experienced on a larger asset base, leading to outflows. Dare we give away 280 basis points out of the skinny rewards on offer, in today’s low-yield environment?
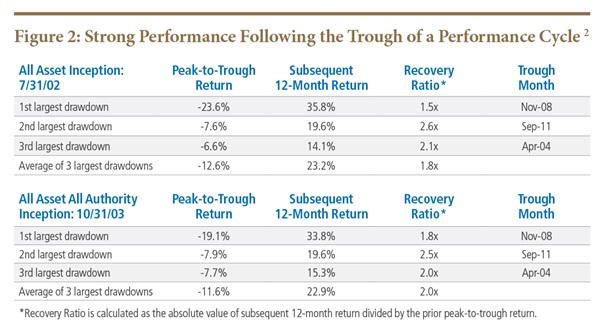
While past is not prologue, the history of the All Asset strategies also suggests that we capture meaningful returns and profoundly surpass prior losses, as soon as twelve months following a snap-back off the bottom of a performance cycle. Let’s observe the All Asset strategies’ three historically worst peak-to-trough returns, prior to their current drawdowns of -14.5% for All Asset and -19.6% for All Authority, as of December 31, 2015. As displayed in Figure 2, when our strategies hit their nadir, the average subsequent 12-month return was 23%, surpassing the prior average loss by approximately two-fold!
We’ve seen this before. The following parallels come to mind: the Nifty Fifty of 1971-72, laying a foundation for the 1973-74 bear market, the overreaching in 1985-87, setting the stage for the crash of 1987, the Biotech Bubble of 1989-90, the Tech Bubble of 1995-99, and the Housing Bubble of 2006-2008. Each of these was a huge bull market in U.S. stocks, leading to lofty valuations for the most beloved growth stocks; each laid a foundation for superbsubsequent performance for diversifying markets, which had fallen profoundly out of favor.
Our best opportunity to pivot into deep value, or an increased focus on Third Pillar diversifiers, is when they are shunned. We cannot know when the current cycle will turn; but, we believe that prospective performance from our strategies will be superb in the next three to five years. Morningstar reports that an all-time record of 31 “liquid alternatives” funds (diversifiers!) closed their doors in 2015. Is this a buy signal or a sell signal? In one way, the Third Pillar behaves much like mainstream stocks: once value-oriented Third Pillar markets turn, the recovery is often swift and powerful.
Q: How do you view the portfolio’s positioning in Emerging Market asset classes, particularly after a challenging 2015?
Brightman: Many investors mistake a bear market for diminished prospective returns. From the rear-view mirror, the bear market in emerging markets has been painful. When we look out of the windshield, however, these very asset classes offer the highest potential returns3 available to today’s opportunistic investor. So, the exodus from emerging markets is a wonderful opportunity – and quite possibly the trade of a decade – for the long-term investor.
With global stock markets selling off in early 2016 following a challenging 2015, and jittery investors pulling the sell trigger on their risky investments, the fear of emerging markets is pervasive. A number of events – slowing growth in China, an unexpected depreciation of the Renminbi, tumbling commodity prices, Middle East tensions, and recessions in Brazil and Russia – have applied downward pressure on emerging market stock, bond, and currency prices. We are sympathetic to those alarmed by these events and recognize that this understandable fear creates today’s bargain prices. While markets are not efficient, neither are they irrational.
We are increasingly confident of our positioning in emerging market stocks and bonds, which represents an allocation of 35% in All Asset and 39% in All Asset All Authority, as of December 31, 2015. Offering high yields, favorable demographic trends, strong productivity growth prospects, and a long-term trend of improving credit quality, emerging market asset classes are secularly attractive. Valuations, which are both compelling relative to their individual histories and relative to other market opportunities, makes emerging markets even more attractive today.
Across commonly used valuation metrics, emerging market equities are exceptionally cheap. We tend to look at the Shiller P/E, which divides real prices by the ten-year average of real earnings per share, because it allows the price-to-earnings relationship to be viewed in the context of multiple business cycles.4 As of January 31, 2016, emerging market equities are priced at a Shiller P/E5 multiple of 10x, ranked in the lowest 4th percentile since 1990. We find six times in the last 25 years when the emerging markets’ Shiller P/E multiple dipped below 10x. How did these stocks perform after reaching these bargain-basement multiples? Five years later, emerging market equities delivered an impressive average cumulative return of 188%!
These results are not singular to emerging markets. Across all countries, when Shiller P/E multiples get depressed to dirt cheap levels, reversion to normal valuations has followed, leading to strong subsequent returns. We mapped the cumulative five-year return path of 13 developed and emerging countries,6 returns once each country’s valuation multiple dips below 10x. Figure 3 shows that once Shiller P/E falls below 10x, the average cumulative five-year return is an impressive 118%.
During 2015 we also experienced an extraordinary divergence in performance between growth and value, similar to tech bubble of the late 1990s, as I highlighted in past Insights. EM value stocks underperformed growth stocks by more than 5% per annum over the last 3 years ending December 31, 2015, a value premium that sank to the bottom decile of all rolling three-year outcomes since January 1997. What results transpired after value was thus savaged? EM value stocks outperformed growth stocks by an average of 6.7% three years later and 7.3% five years later. Of course, this result hardly surprises. It is a manifestation of a core tenet of our investment philosophy: the largest and most persistent active investment opportunity is long-horizon mean reversion.7
1 Kinnel, Russel. (2005) “Mind the Gap: How Good Funds Can Yield Bad Results.” Morningstar FundInvestor, vol 13, no. 11, July: 1-3. Kinnel compared the average dollar-weighted returns (return to the investors) against time-weighted returns (return to the fund) over the previous 10 years across 17 equity mutual fund categories. In every category, the dollar return lagged the time weighted return with the average slippage equal to 2.8% annually.
2 For All Asset, the drawdown periods are as follows: March 2008 to August 2009, August 2011 to December 2011, April 2004 to August 2004, and September 2014 to current. For All Asset All Authority, the drawdown periods are as follows: March 2008 to June 2009, April 2011 to December 2011, April 2004 to September 2004, and May 2013 to current.
3 As of December 31, 2015, our ten-year expected returns are 7.9% for emerging market stocks. Our expected returns for all other major asset classes, as well as our methodology, can be viewed on our website. http://www.researchaffiliates.com/assetallocation/Pages/Core-Overview.aspx
4 Although the Shiller P/E is widely adopted by many practitioners, its critics often point to the following: It’s skewed by including depressed earnings from the financial crisis. This is true, but it also includes the pre-crisis all-time high earnings. The purpose is to smooth earnings over the cycle, and it does just that. Low global interest rates support higher valuation multiples. Even under this assumption, many countries have current multiples well outside of their historical bounds.
5 The emerging market CAPE ratio is based on the MSCI Emerging Market Index (prices and earnings in U.S. dollars), which provides earnings data starting in 1995. Prior to 1995, the MSCI Index data were augmented by data from Global Financial Data (GFD), which reports both total return and price index data for emerging markets. Using this data it is possible to infer the dividend yield for each period that is used, along with the average payout ratio, from the current MSCI data to calculate the earnings per share and CAPE prior to 2005. Details on creating an historical emerging markets index can be found in the Credit Suisse Global Investment Returns Yearbook, 2014.
6 Countries include U.S, Australia, Canada, France, Hong Kong, Italy, Spain, United Kingdom, Brazil, Indonesia, Poland, Russia, and Turkey.
7 A central tenet of our investment philosophy is that mean reversion is the largest and most persistent active investment opportunity. Please see our Fundamentals, “Our Investment Beliefs” by Chris Brightman, Jonathan Treussard, and Jim Masturzo (October 2014). https://www.researchaffiliates.com/Our%20Ideas/Insights/Fundamentals/Pages/316_Our_Investment_Beliefs.aspx