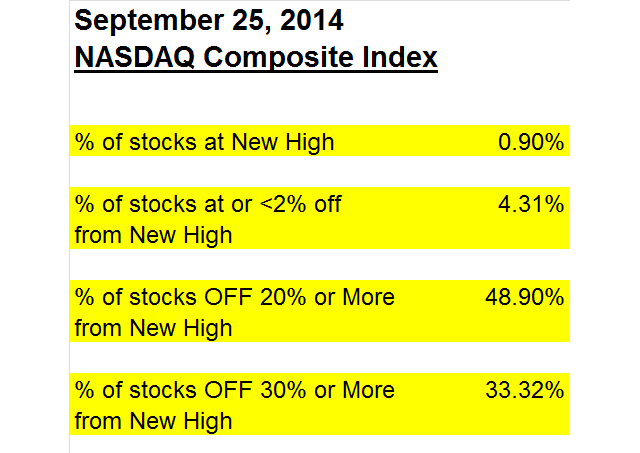
As of September 25, 2014 the NASDAQ Composite index is up 6.95% year-to-date, despite the recent downturn in the market. The darling tech stocks continue to come up with new and innovative ideas for products and services to drive their bottom lines. The NASDAQ is only down -2.86% from the high it made on September 2, 2014. One could conclude that the NASDAQ is indeed solid and that this is just another passing correction before it pushes on to higher levels.
What if I told you that 1,251 (48.9%) of the 2,558 stocks in the NASDAQ Composite index were down 20% or more from their 52-week high as of September 25? Would you still think that the NASDAQ seemed healthy? What if I told you that 852 (33.3%) of the stocks were down 30% or more from their 52-week high? You may be surprised. These statistics are in the following table.
It would be natural to question this information because the two ideas don't seem to fit together. The NASDAQ just hit a recent high, yet here we find that 48.9% of the stocks are down 20% or more from their 52-week highs. The former suggests that the index is strong and ready to push higher. The latter sounds like an index in the midst of a bear market. You may wonder how this could be.
The answer is market capitalization, which is a total dollar market value of all of a company's outstanding shares and is commonly used to determine its size. The NASDAQ is a market capitalization based index. This means that the larger the market capitalization of any given stock, the more the returns of that stock count for in the index's performance. The largest stock by market capitalization in the NASDAQ Composite index is Apple, with a 7.3% representation. That's a very large portion of return.
To further show the disparity between the larger capitalization and smaller capitalization stocks in the NASDAQ composite index, let's take the top 200 and bottom 200 stocks by market capitalization as of September 25, 2014. Each group of 200 represents approximately 7.8% of the 2,554 stocks in the NASDAQ composite index by number. The top 200 stocks in the NASDAQ Composite index by market capitalization, while being 7.8% by number, represent just shy of 75% of the entire market capitalization for the NASDAQ. This means the remaining 2,354 stocks, just a bit over 92% of the stocks in the index, represent only 25% of the index's market capitalization. That's heavily skewed.
If we look at the year-to-date returns from these two groups of stocks, we see something even more amazing. The top 200 market capitalization stocks have an average year-to-date return of 13.92%. Meanwhile the bottom 200 market capitalization stocks have an average year-to-date return of -10.49%. Yes, that is a negative. There is a pretty drastic difference between the two groups of stocks at the opposite ends of the market capitalization spectrum.
You may think that if we included more stocks from the lower market capitalization levels, the results will improve. Let's see. If we include all the other stocks with year-to-date returns, excluding the top 200 market capitalization stocks, we end up with a return of -1.97%. Yes, the return did improve, but -1.97% is still a far cry from the +13.92% of the top 200 market capitalization stocks.
What does this tell us? First, the larger capitalization stocks count for much more than the smaller stocks even though there are far more of the smaller stocks in number. In fact, the year-to-date returns for the top 8% of stocks by number are carrying the index for the remaining 92%. The market capitalization effect is making the index appear to be strong by hitting new highs when it is actually weak, based on an average numerical basis.
When a few large darling stocks carry the index higher while the rest lag, we refer to it as a narrow rally in stocks. Narrow rallies are a sign of weakness and are an insight into the true health of the market at large.
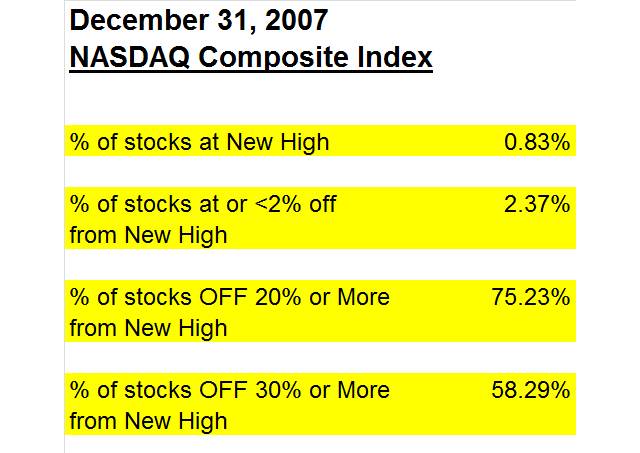
We saw a similar narrowing of the stock participation in the NASDAQ Composite index in the time leading up to the market crash back in 2008. As of December 31, 2007, the NASDAQ was up 9.81% year-to-date. In the following table, we see that 75% of the stocks by number in the NASDAQ composite index were down 20% or more from their 52-week highs as of December 31, 2007. 58% of the stocks by number were down 30% or more from their 52-week highs. This is similar to the narrowing we are seeing today. It can be seen as an early indication that something is amiss and careful monitoring is called for.
Sincerely,
Sean Hanlon, CFP®
Chairman, CEO and Chief Investment Officer
The NASDAQ Composite Index is an unmanaged, market-weighted index of equities traded on the National Association of Securities Dealers Automated Quotation System. Past performance is not a guarantee of future results. This Market Commentary is limited to the dissemination of general information pertaining to its investment advisory services and is not suitable for everyone. The information contained herein should not be construed as personalized investment advice. There is no guarantee that the views and opinions expressed in this newsletter will come to pass. Investing in the stock and bond markets involves gains and losses and may not be suitable for all investors. Information presented herein is subject to change without notice. Hanlon has experienced periods of underperformance in the past and may also in the future. The returns represented herein are total return inclusive of reinvesting all interest and dividends. Hanlon Investment Management ("Hanlon") is an SEC registered investment adviser with its principal place of business in the State of New Jersey. Hanlon and its representatives are in compliance with the current registration and notice filing requirement imposed upon registered investment advisers by those states in which Hanlon maintains clients. Hanlon may only transact business in those states in which it is notice filed, or qualifies for an exemption or exclusion from notice filing requirements. Any subsequent, direct communication by Hanlon with a prospective client shall be conducted by a representative that is either registered or qualifies for an exemption or exclusion from registration in the state where the prospective client resides. For information pertaining to the registration status of Hanlon, please contact Hanlon or refer to the Investment Adviser Public Disclosure web site (www.adviserinfo.sec.gov). For additional information about Hanlon, including fees and services, send for our disclosure statement as set forth on Form ADV from Hanlon using the contact information herein. Please read the disclosure statement carefully before you invest or send money. Not all Hanlon clients are in the strategies discussed herein.
© Hanlon Investment Management


