EPV: Establishing Predictive Value (i.e., Relative Outperformance)
‘EPV: Establishing Predictive Value’ utilizes <U/O> Applied Indexation to refine assigned benchmarks and examine causality among variables.
EPV: Establishing Predictive Value (i.e., Relative Outperformance)is a linear narrative outlining general limitations in third party data provider presentations and implied effects on peer group analytics. Reconciling the modulation of data with nomenclature is one facet of the qualitative assessments associated with quantitative analysis. In the end, perhaps an opportunity to improve already good processes.
From a recentEPVexercise . . .
As a major industry leading independent data and research publisher, Morningstar provides publicly accessible proprietary data as a complement to major indexes globally.
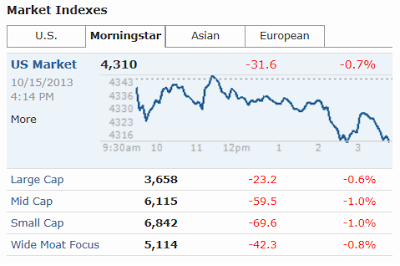
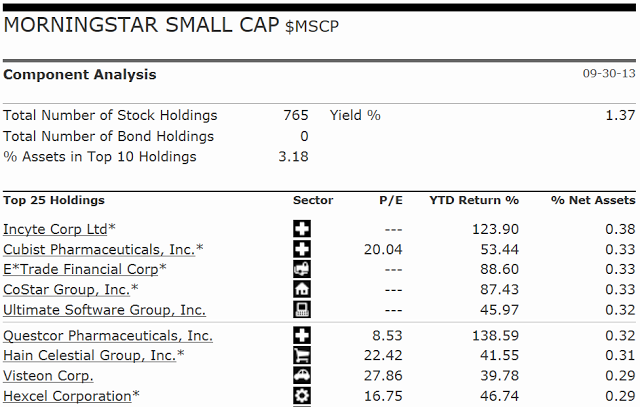
In this example we look at its Small-cap Index, component member HXL and its Industry Peers cross-referenced with <U/O> Matrix.
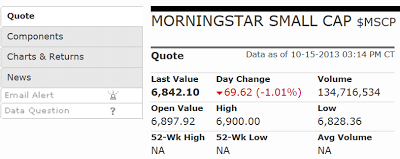
Empirically we establish HXL index placement and corporate profile . . .
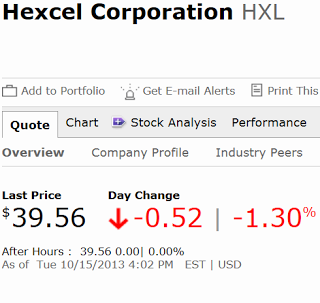
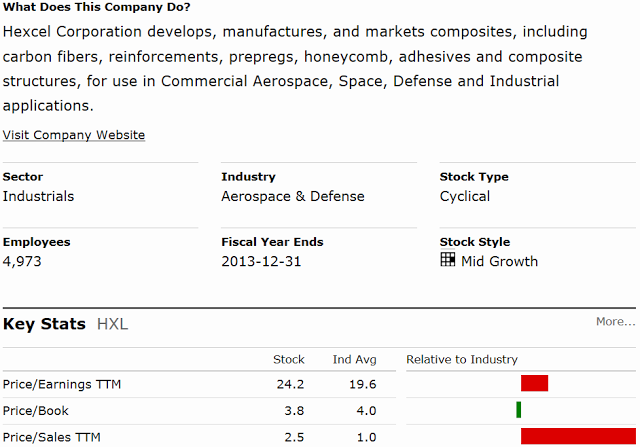
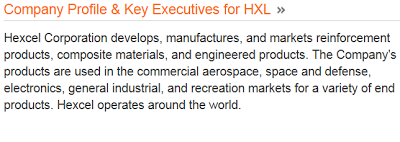
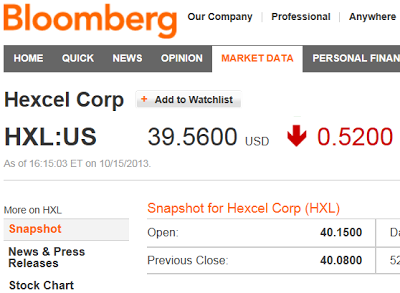
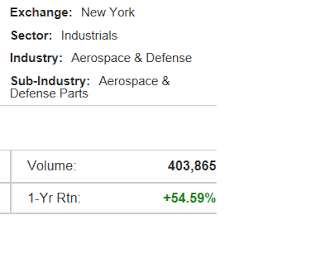
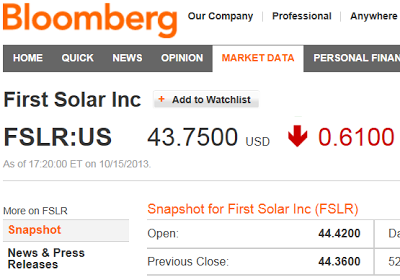
. . . and confirm HXL company description via Bloomberg.
A sample of HXL Industry Peers presented by Morningstar includes major air- and spacecraft manufactures . . .
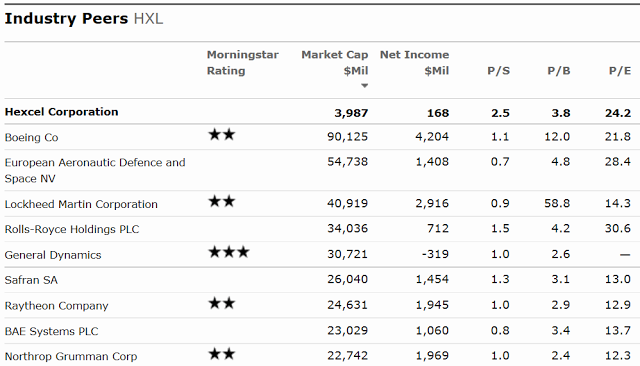
. . . though HXLfinal products are raw material inputs and fabricated parts within the Aerospace & Defense Industry major players’ finished goods.

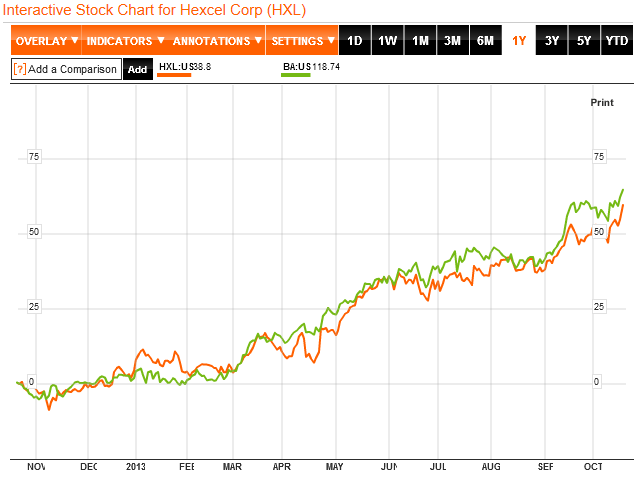
Clearly Boeing is a major driver of valuation in the industry as the chart below of both BA and HXL equity price performance illustrates. However, no distinctions are made among HXL Industry Peers relative to the Aerospace & Defense supply chain—there is no tiering of component member contributions to sequential stages in the manufacturing process.
Including HXL as a Mid-cap Growth Stock Style component member is an outlier in Morningstar’s Small-cap Index; below, we again observe a sample of HXL Key Stats and those Relative to Industry which likely skew comparables based on Industry Classification.
Noting the Sector Industrials and Industry Aerospace & Defense assignments above, Morningstar’s custom portfolio feature also duplicates HXL subindustry designation Aerospace & Defense under the heading Stock Industry/Fund Category. Bloomberg effectively replicates the assignment with HXL Sub-Industy modifier Aerospace & Defense Parts.
Generally, simple refinement of Morningstar and Bloomberg Sector/Industry/Subindustry classifications can reflect both the predominant nature of a company’s operational profile and proportionality of segment operations. As the top-down meets the bottom-up in this case a Subindustry assignment of say Composite Materials affords the analyst flexibility to source designated data, improve computed comparables accuracy and capture a newfound degree of modularity.
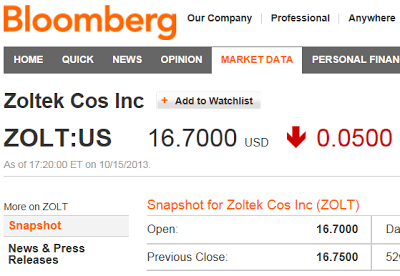
Testing the hypothesis, an excerpt of<U/O> Matrix (2Q13) lends three specific Segment/Classification(s) plus corresponding indicator inversions within defined peer groupings sharing common areas of overlap as input providers (Wind, Automotive) among varied capitalizations across geography:
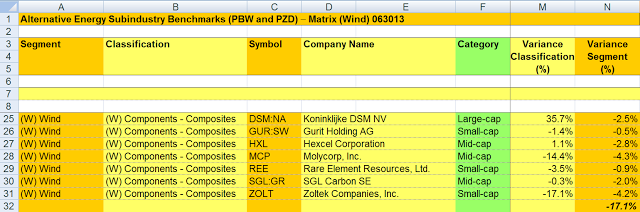
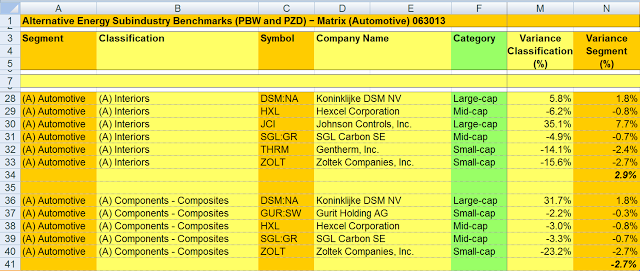
Comparing common ZOLT and HXL business segment profiles, note the ordinal rankings and profile strength in related inversions. The degree of variance established by ZOLT relative to HXL captured above is further reinforced by the quantitative relationships within the Automotive segment below—these relationships hold true in prior and current sampled periods.
<U/O> Applied Indexation applications of relative strength inverse indicators frame the subsequent acquisition of ZOLT as a global niche player and provide for corresponding equity outperformance on a relative basis (1-Yr Rtn: ZOLT +111%, HXL +55%).

As an aside, the negative inversions noted in MCP and REE above support the dual application of indicators to capture both accelerating and deteriorating fundamental assessments of corporate performance. Please note prior publication EPV: Establishing Predictive Value (i.e., Performance Attribution) detailing the capability to lever <U/O> methodology in overweighting outperforming Segments/Classifications/component members as well as underweighting underperforming positions of respective industry leaders and laggards in support of directional price movements among subcycles within greater cyclicalities as well to add, lever, divest or short exposure based on demand characteristics and future expectations (e.g., overweight underperforming or underweight outperforming positions).
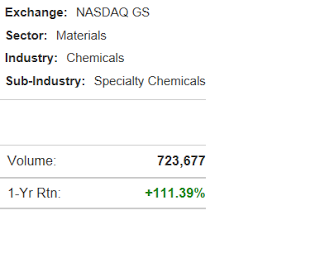
In another example, we consider the evolution of the Solar industry relative to the source material of its genesis—silicon. The raw material used to make semiconductor chips is also used as the primary input for photovoltaic solar panels; dual-use manufacturing facilities provide for the output of both. FSLR incorporates semiconductor technologies in operations though utilizes only 1-2% of the silicon in traditional solar module manufacturing. A second point to consider, solar panels generate energy as a source of electricity not a final application of digital technology. Please note differences in Morningstar and Bloomberg Sector/Industry/Subindustry classifications:
1) Morningstar:
2) Bloomberg:
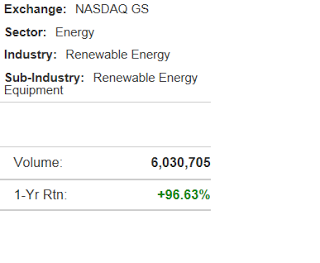
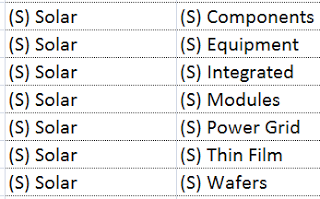
Blending both methodologies provides for an improved Energy/Renewable Energy/Solar classification; including the <U/O> Matrix segment classification Energy/Solar/Thin Film lends more granularity.
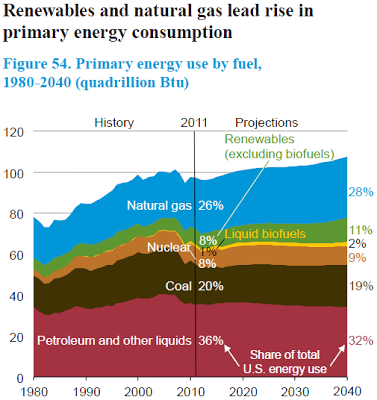
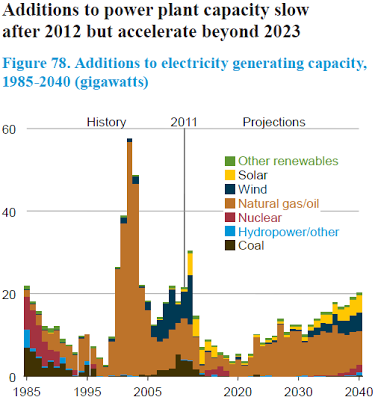
For traditionalists, independent reference is useful for confirmation. From the US Energy Information Administration Annual Energy Outlook 2013:
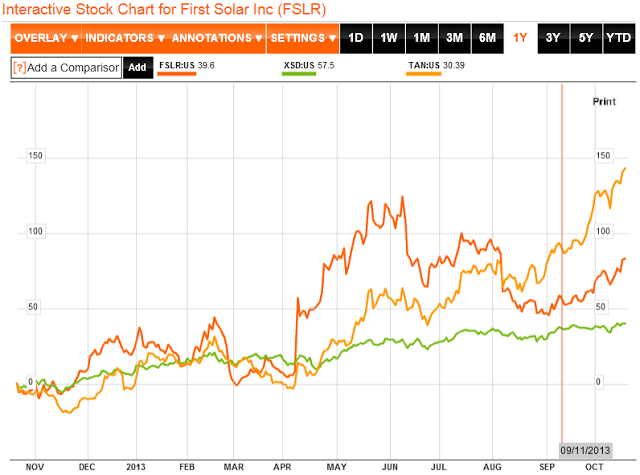
Morningstar’s Quantitative Fair Value Assessment calculation above is an outstanding area of interest with respect to valuation. As noted graphically below, peer group valuations differ among semiconductor and solar companies (XSD - SPDR S&P Semiconductor ETF, TAN - Guggenheim Solar ETF):
Examples of refined nomenclature presented in EPV: Establishing Predictive Value (i.e., Relative Outperformance) suggest an evolution in categorization to fully characterize investment universe representation is warranted. Demonstrated <U/O> Platform applications of benchmark analysis and indexation are intended to improve the quality of data, performance attribution and peer group analytics. Intuitively, valuation necessitates specific business segment rationalizations and related metrics.
Finally, one may ask if modification of institutionalized nomenclature contributed by comparables and comparable assignments embedded in proprietary methodologies can be aggregated to ultimately realize outperformance as a standalone model portfolio. Though not intended as a static derivative quantitative equity strategy (effectively Long all <U/O> Matrix component members with negative inversions), against a market capitalization weighted blended PBW/PZD performance benchmark 2013 numbers are: 1Q13 7.9% (-42 basis points to benchmark); 2Q13 15.1% (+81 bps); 3Q13 18.1% (+144 bps); YTD as of 093013 46.6% (+192 bps).
Inverse indicators are based on the variance between component member market capitalization and respective portfolio position weighting relative to peers in each<U/O> Matrix segment and classification. Predominantly, small- and mid-cap companies within the sample group possess (or trend to) corresponding negative indicators (portfolio position weight greater than proportionate market capitalization); mid-caps exhibit both leadership and lag, small-caps demonstrate volatility of outperformance/underperformance in sensitivity to price and demand changes. Without exception large-cap companies maintain positive indicators reflecting the dominance of capitalization within a classification, counter-cyclicality of conglomerates during off business cycles and/or lag effect in up markets.
Absent standard filters detailed in quarterlySummary Templates, causality among variables is established graphically by equity price performance of sample group presented independently and among relative peers over a one year period in tandem with a five period<U/O> Matrix segment/classification data point legend. Indicators capture forward period trends utilizing featured and/or peer indicator inversions.
Appendix:
The premise of refining an assigned benchmark to create a more relevant ‘Tier 2 – Relative Value’ grouping viaNomenclatureis conferred in sampled single and multivariate scenarios whereby inverse indicators embed company performance/forecasts, publicly available information and analyst projections to the extent by which a component member deviates from a market-weighted (neutral) posture.
The placement of determined PBW/PZD component members within <U/O> Matrix segments and classifications provides an investment narrative supporting a general portfolio strategy to achieve Alpha, whereby variance of classification relative to company-specific operating segments identify and isolate above trend growth rates based on fundamental sector drivers.
<U/O> Applied Indexation embedded in <U/O> Matrix details 3rd and 4th degree indexation methodology for use across economic sectors and asset classes. The resulting characteristics of exchange-listed component members, such as those engaged in emerging technologies with differentiated capitalization levels, can be apportioned for further examination without exclusion due to the finite nature of indexation. By managing concurrent cycles, change in a particular industry can be characterized and anticipated.
The methodology inherent in the digital products developed and supported by the <U/O> platform are intended to serve as a quantitative reference and instructional resource in addition to a template for client services. The execution of a strategy which captures the attributes of an assigned benchmark, transcends industries and fulfills requisite investment mandates efficiently creates a turnkey product adding velocity to the research process. Once a relevant benchmark is established, deconstruction of its elements may begin to detail the quantitative characteristics of its component members. Structuring the assigned benchmark in accordance with a standardized process establishes relativity and a basis of comparison for further computations.
Published research serves as both a quantitative reference and instructional resource in addition to a template for client services. Metrics may be modified to accommodate the universe of sector, industry and subindustry research. For assistance implementing the aforementioned concepts within your financial/economic models or investment research process, please note three levels of consultation: Qualitative – Support, Quantitative – Directed and Quantitative – Fundamental.
© Universal Orbit