When I was practicing law (full time for twenty years of my working life), I always had to be aware of the requirements for proof. By “the preponderance of the evidence” in a civil case, and “beyond a reasonable doubt” in a criminal matter were the standards.
In the financial markets, the standards are a bit different – much more lax despite all the money involved. Most advisors seem to use a mix of headline reading, CNBC watching, and their “feel” for the market at any given time to determine where they stand.
My involvement in the markets was different. I came at it from the quantitative side. From the very beginning (way back in 1968), my interest stemmed from attempts to use the computer to eliminate those subjective judgment calls.
While this methodology is still not ready for prime time in terms of replacing our jury system in the courts, it provided a lot of answers for me. It allowed me to use an evidence-based approach to investing, built on solid research.
“Why?” Because when you research based on past numerical relationships, your own emotions and judgments and all the little behavioral tricks we all engage in that can fool us, just don’t enter into the buy or sell decisions. Instead, with the computer, you are just testing your logical reasoning for the trade against past prices. There’s no way to code a hunch or a gut feeling in programming a computer.
You would think that such an approach would render decisions in the financial markets as relatively “black or white.” And it is true, in any strategy that has been developed quantitatively using a computer, it is just that – you are either “in” or you are “out.”
When I look at these strategies right now, the proof is rather conclusive. With all of the strategies that we offer that look at whether it is a good time to be in stocks or out of stocks, overwhelmingly they vote for “in.”
This is unanimously true of all of our intermediate-term systems. Classic, Market Leaders, VAN, STF, all of the rotation systems like Evolution, Faith Focused Investing, Next Generation, and all of the select strategies, like Best Tech and Sector Select, are invested at the maximum equity level permitted. In fact, VAN and STF are at maximum 200% leverage!
Yet this is not necessarily the case in our shorter-term strategies, like S&P Tactical Patterns, Third Day, PSI, Systematic Advantage and Contrarian S&P Trading. These are mixed. Some are invested in stocks, while others are fully or partially invested in money market funds.
When I look at the indicators that I normally rely on for an overview of the market’s strength, the same is true. It is a mixed picture.
Earnings are doing better, with two weeks still to go in the current earnings reporting season, than most experts expected. Economic reports have not been as conclusive. The week before last, 16 of 28 economic reports were weaker than expected, while 13 of the reports were stronger. This last week, there were only 6 reports, but 4 were better than expected.
Interest rates declined last week, but the decline began from the highest point rates had attained during the year! Sentiment among investors has been moderate, but has hit a bullish extreme among newsletter writers. As the chart shows, this condition (highlighted by the red dot) is more likely at market tops than at market bottoms (or even in between).
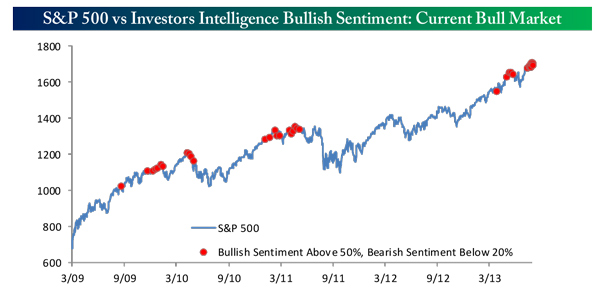
Source: Bespoke Investment Group
The picture for stocks today is much as it has been since mid-July when I warned of quick summer storms. Whether you look at the positioning of our strategies or my group of reliable indicators, it appears that the intermediate term remains bullish, while the short term continues to be one of caution, when buying the dips can be profitable.
Since my 7/22 storm warning, stocks have not fallen much, and the trend can best be characterized as “sideways.” The S&P 500 has only fallen as much as 10 points (less than 1%) during that time and currently resides (at the time of this writing) down 7 points from the 7/22 close.
Still, evidence for a bigger correction exists. Caution is still in order, as markets do tend to top in the August-September time period.
One of the cases being made for a further run up in prices is summarized by the following charts from Bespoke Investment Group. Looking for the closest fit to this year’s market from all the S&P 500 market years beginning in 1928, the research firm identified ten, with 1954 and 1995 fitting best of all. Analyzing the rest of each year’s performance, the results during these ten “best fit” years were pretty positive.
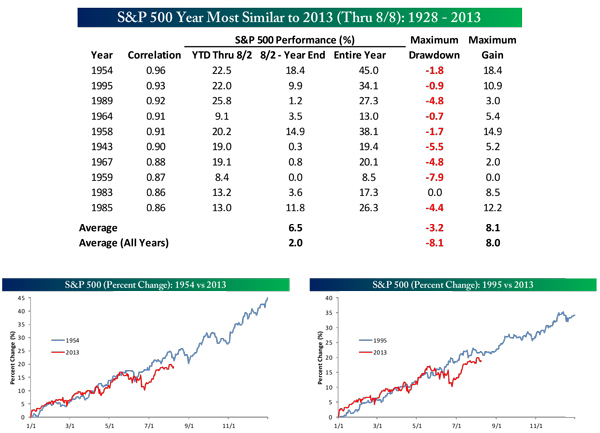
Source: Bespoke Investment Group
Yet, examining a chart of each of the ten years (and the included 1954 and 1995 years are illustrative of this), one always finds a mid-summer swoon. They vary in depth but they are there and we may be in (or in for) one now.
Does that mean you should delay investing or exit your stock positions? My answer is to do so only if you have a quantitatively tested system that calls for a high probability exit and can reasonably be expected to get you back in when the rest of the story is told after the sideways or down move that many are expecting.
Absent that, I’d give the benefit of the doubt to the intermediate-term strategies on the FPI Strategic Solutions platforms that are all saying – stay the course.
All the best,
Jerry
© Flexible Plan Investments


