When I told Mom that I was buying gold bullion this week (7/8), she asked, “Are you sure you want to do that?”
She was aware, like everyone else, of the horrendous beating gold had been taking in the markets. She could not understand why I would want anything to do with it.
She’s right, you know (of course, aren’t moms always right?). At Wednesday’s close, the price of gold (as measured by the near-term futures contract) was down 36% since its top in 2011. After a bull market rally that caused the price of the yellow metal to explode 168% from 9/22/2008 to 8/22/2011, gold’s fall has been equally spectacular.
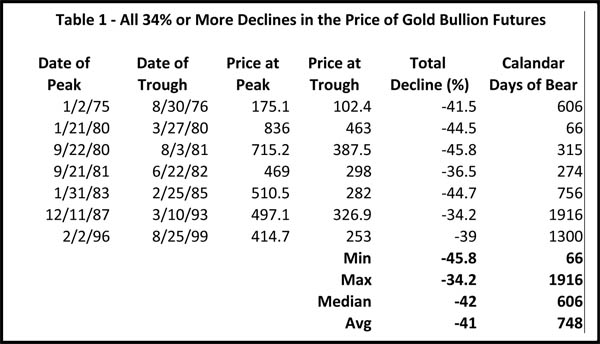
But what Mom, and others, may not realize is that falls of this magnitude are not beyond the experience of long-time gold traders. Since gold futures began trading in the US in 1975, the price of gold has suffered through seven other declines of 34% or more.
Yet the amazing fact to me is not the number of these declines, but it is the discovery that the worst decline in almost 39 years was just 45.8% (1980-1981). Not as great as one might think in such a volatile commodity. The blue chip S&P 500 Index went through two greater declines in just the nine years between 2000 and 2009!
Source: Flexible Plan Investments
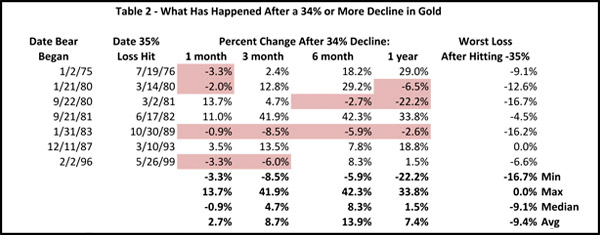
Furthermore, in the past after gold has fallen 35%, the downside has been limited. The average decline has been -9.4%, with the worst -16.7% and the best 0% (the gold market immediately started to recover in 1993). And, as the chart demonstrates, when it has declined that much, buying gold has generally been profitable, even in the short run.
Source: Flexible Plan Investments
With gold gaining on average over the next one-, three-, six- and twelve-month periods, it appears the only bear market that a gain eluded traders over each of those time periods was the 1983-85 setback that saw the market fall 44.7 % in total and lasted 756 days.
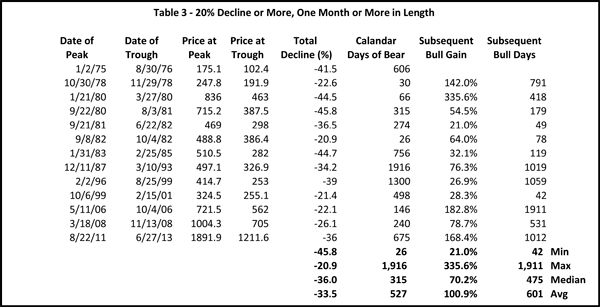
Speaking of the length of gold bear markets, I note that the average 20% or more bear market in gold has lasted 527 calendar days (the median, just 315 days). The current bear has been around for 675 days, making it already the fourth longest ever. The average number of days for the seven previous 34% or greater declines was 748 days.
Source: Flexible Plan Investments Adapted from Bespoke Investment Group
In contrast, the chart also demonstrates the potential once gold has bottomed after these types of declines. The average gain was 99.4% (median, 70.2%) with a worst case of 21% and best of 335%!
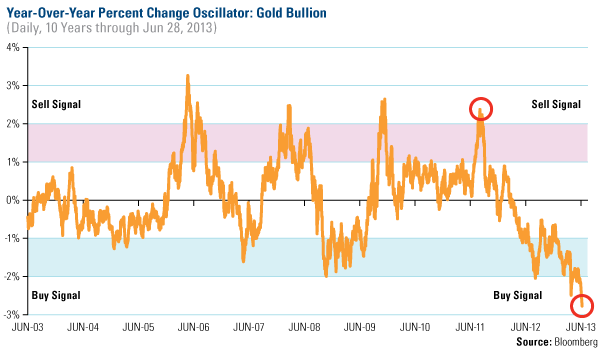
When investing, you look for opportunities to buy low and sell high – the present time may be one of those times for gold. Here’s one way the opportunity presents itself on a recent chart from Bloomberg:
The rest of the markets
In line with past market history, prices rose on all of the major stock market indexes during the holiday-shortened week just concluded. Stocks were aided by a better-than-expected jobs report that sent the Dow up triple digits on Friday.
In fact, improvement in the economy seemed to provide the underpinning for the stock market all week long. With sixteen economic reports last week, there was plenty of economic news to report. Fortunately, ten of the sixteen reports were better than predicted, and the best of all came on Friday with the jobs report.
Source: Bespoke Investment Group
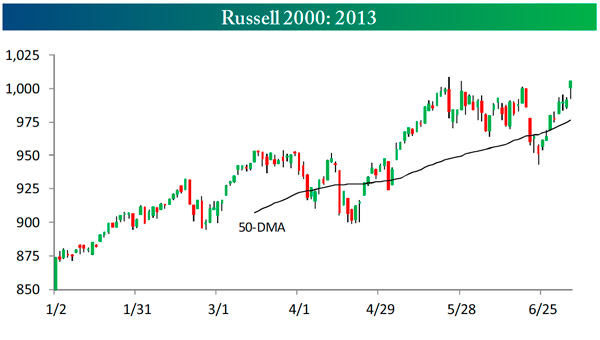
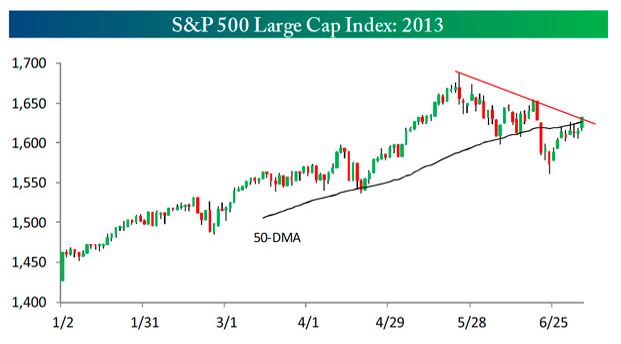
With the small-cap index hitting a new all-time closing high, it led the way among all the cap-weighted US stock market indexes. Still, all saw their price levels move above the key 50-day moving average fixated upon by Wall Street, suggesting the beginning of a rally period once again.
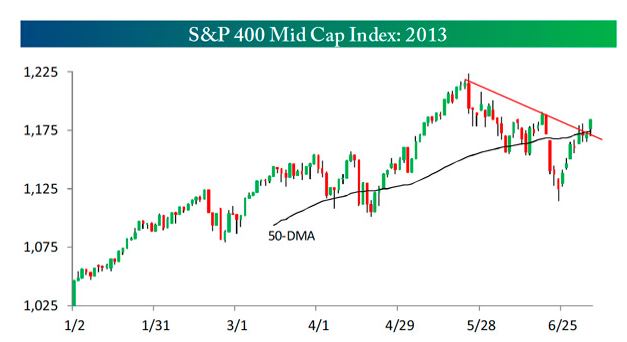
Source: Bespoke Investment Group
Investor sentiment also jumped to higher bullish readings and seasonality again suggests higher prices for the post-holiday week. Fed QE bond buying also continues at his highest rate for the month.
Source: Bespoke Investment Group
So most everything is positive, except, wait for it … interest rates. They remain in rocket-launch mode (a negative, but one, perhaps, the market is getting used to.) And then there is earnings reporting season. The latter commences today and downward revisions have been dominating the newswires for most of the quarter.
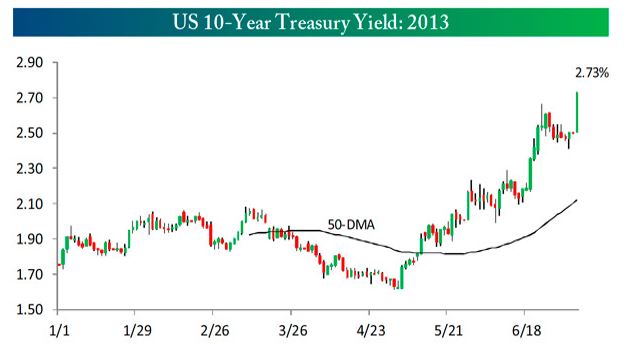
Source: Bespoke Investment Group
While rising interest rates are a negative, I have to rate earnings as uncertain in their impact. Often the analysts get carried away in their negativity, opening the door for positive surprises when the actual reports arrive. For example, in the first half of the year, the 50 stocks of the S&P 500 Index that began the year with the worst analyst ratings generated a 22.74% return – better than the average return for the 450 that had superior analyst ratings!
As a further example, Alcoa always leads the earnings reporting season (trying to live up to its AA ticker symbol, I guess.) It just hit a 52-week low on Wednesday, has been one of the worst performers of the bull market rally and only beats earnings estimates at about a 40% rate. Yet as I send this I checked, and in after-hours reporting it beat the analyst estimates. Go figure!
With an economy that is still growing when most are faltering, a dollar that is strengthening while other currencies weaken, and a stock market near record highs, it’s a great time to be an American, and I’m grateful for times like last week when we can take a moment to reflect on that and be thankful.
Also thankful for Mom, who turned that 92-year number on the Fourth of July (my granddad would always refer to her as his “little firecracker.”) My wife Pat’s birthday was also last week, so we were doubly blessed. She turned … oh I know better than that! And you can’t cross both Mom and your wife in the same week, can you?
All the best,
Jerry
© Flexible Plan Investments


