Friday through Sunday the weather was rather balmy here in the Detroit area. Fifty degrees-plus is always a welcome change in mid-January.
This morning when I went out to get the newspaper, I experienced a very different environment. Temperatures had plunged 30 degrees overnight and those pools of water left over from Friday’s rain had all frozen.
Kids walking to school were doing just what they did in my day. Stopping at each frozen spot and checking out the ice. Seems like even when the ice has frozen solid, there are always little white air pockets that young boys love to target for a quick “crunch.”
Smashing in these weak spots in the ice was always great fun. Or maybe it was just a diversion from the thought of heading off to school.
Whatever…it did strike me that the recent stock market is like those iced over pools. It is mostly strong enough to walk on, but there are all these little bubbles that you can have fun smashing through. While this indicates patches of weakness or soft parts in the bullish case, we know that as long as the temperature stays low, it’s safe to walk on the ice if you are cautious.
Last week, the immediate snap-back reversal we were expecting lasted 3 days and then the rebound to new short-term highs that we also spoke about occurred as well. While it is always difficult in the very short term to tell if we are back on track, to me it looks like we remain pointing higher, expecting some short-term dips along the way.
In the immediate term, it is easy to point to the fact that the market is overbought. What does that mean? In this case, it means that stocks have moved to more than two standard deviations above their intermediate-term moving average. In other words, for those of you who have forgotten your Statistics 101 (or were fortunate enough to avoid it), stocks have moved up more in the last 50 days than in about 95% of the normal price moves.
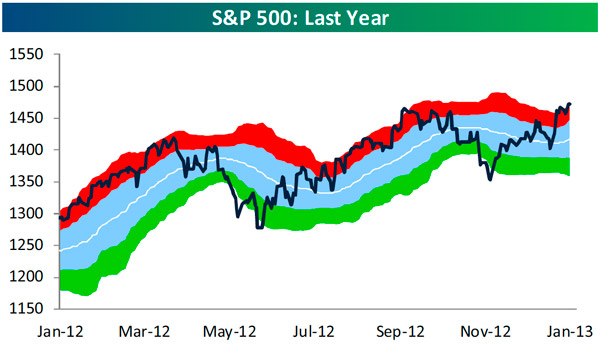
Source: Bespoke Investment Group
Two standard deviations above the 50-day moving average is denoted by the area above the red band.
Now, every major rally at some time hits this two standard deviation “over bought” condition and it is true that all major rallies eventually turn south when they hit this extreme. But it is also true that the first time they achieve these heights (as is the case this time), they often stay above the mark for a time and can also trace higher, just hugging the plot of the two standard deviations line. In other words, things may get a bit more volatile and dips may occur, but we can trend higher in such an environment for quite some time.
The present long-term bull rally that traces its genesis back to March of 2009 is now over 1,400 days old and has generated an overall improvement of 100%-plus. That makes it the eighth best bull market rally in history. Yet, history says it can move higher. The median age, in days, in the seven previous better rallies was over 1,900 days and the median gain was 157%.
Looking at shorter term patterns, when the market has risen more than 1% in the first eight days of the year, it usually moves higher for the rest of the month. When earnings season generates higher prices in its early days (as it is this time around), the market tends to move higher during the rest of earnings season.
And finally, when you have a big rally one week followed by a weak gain the next week, rallies tend to continue. That was the pattern the last two weeks, with a 4.6% gain two weeks ago and a 0.4% gain last week. When that happens, the folks at Markettells.com have shown that the S&P 500 has moved higher 24 out of 25 times over the next two or three weeks during the past twenty years.
But there are still those weak spots in the ice. Economic reports were few and far between last week with just six, and they yielded an uninspiring split (three better and three worse than expected). But next week there are sixteen scheduled to report. That could generate some volatility, as could the concentration of earnings reports from the financial industry this week and from techs next week.
In addition, the average investor is getting a bit carried away by the recent market rally. As the chart demonstrates, investor bullish sentiment is rising to levels that have been supportive of corrective phases in the market. However, the chart also demonstrates that we have not even hit the 50% limit and the readings have gone much higher before stocks really tanked.
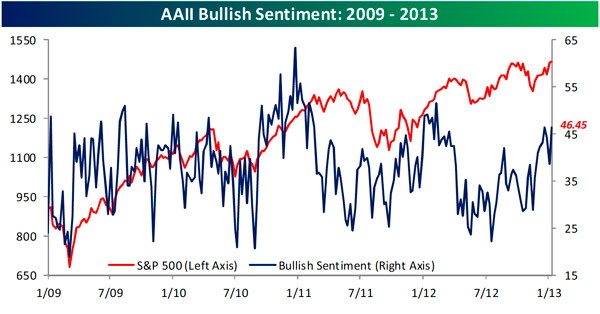
Source: Bespoke Investment Group
Interest rates continue to rise and that is by far the biggest negative overhanging the financial markets before the debt ceiling debate gets into full force. Yet, as I mentioned last week, rates still don’t compete well with stock yields and I tend to view the move up currently as consistent with the normal relationship of the movement of the major financial market asset classes.
“Normally,” as the dollar moves lower, interest rates, stocks and commodities move higher. That’s exactly what we see occurring right now. The US dollar versus the Euro has softened considerably, and interest rates, stock indexes, gold and oil have been increasing in line with the “normal” relationship. When something begins to deviate (probably as we near the debt ceiling, if things get uncertain and no solution is in sight), we will have a substantial change, but for now the ice is strong, the weak patches are small and it’s safe to proceed cautiously.
As always, though, it’s helpful to have some defensive tools with you, like a pocket full of rock salt and rubber boots. And of course, it always helps if you slip on the ice, you are flexible…
All the best,
Jerry Wagner
© Flexible Plan Investments