Tech megacaps entered a correction, oil prices broke out, big-money funds retreated and small-lot investors showed waning conviction in buying the dip. While the war in Iran that triggered all that didn’t end a three-year bull run in US equities, it is shaking it to its core.
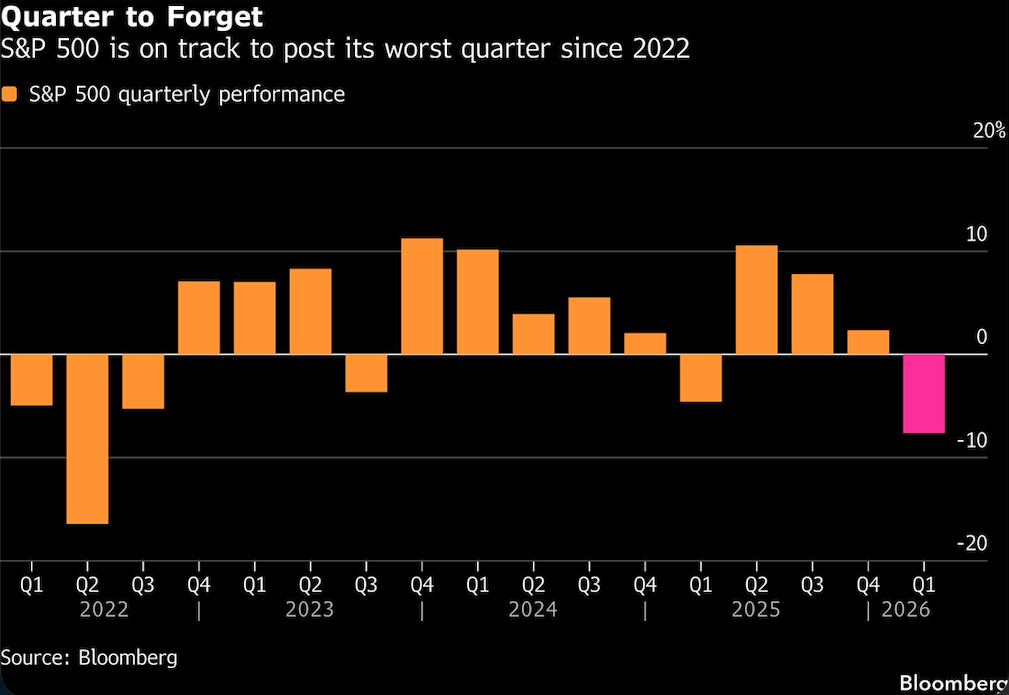
With one day to go in March, the S&P 500 Index is on track for the worst month and worst quarter since 2022. Technology stocks were hit particularly hard, owing to a double-whammy of geopolitical angst and worries over disruption from artificial intelligence that pushed the likes of Microsoft Corp. and Adobe Inc. down at least 25% this year.
For investors who witnessed the Nasdaq 100 Index fall into correction territory this month with a decline of more than 10% from its peak — and the S&P 500 not far behind — concern is high that more pain could be ahead. Fighting in Iran shows no signs of easing, while a supply shock stemming from the interruption of oil flows through the Strait of Hormuz threatens to crimp corporate profits and eat into growth.
“Until this month, every dip was a buying opportunity,” Steve Sosnick, chief strategist at Interactive Brokers, said by phone. “As the month has worn on, the hope, the FOMO, the market’s willingness to rally on relatively slender pieces of news has diminished. We need something more concrete.”
Below are five charts that show how the US equities market has fared over the course of the quarter.
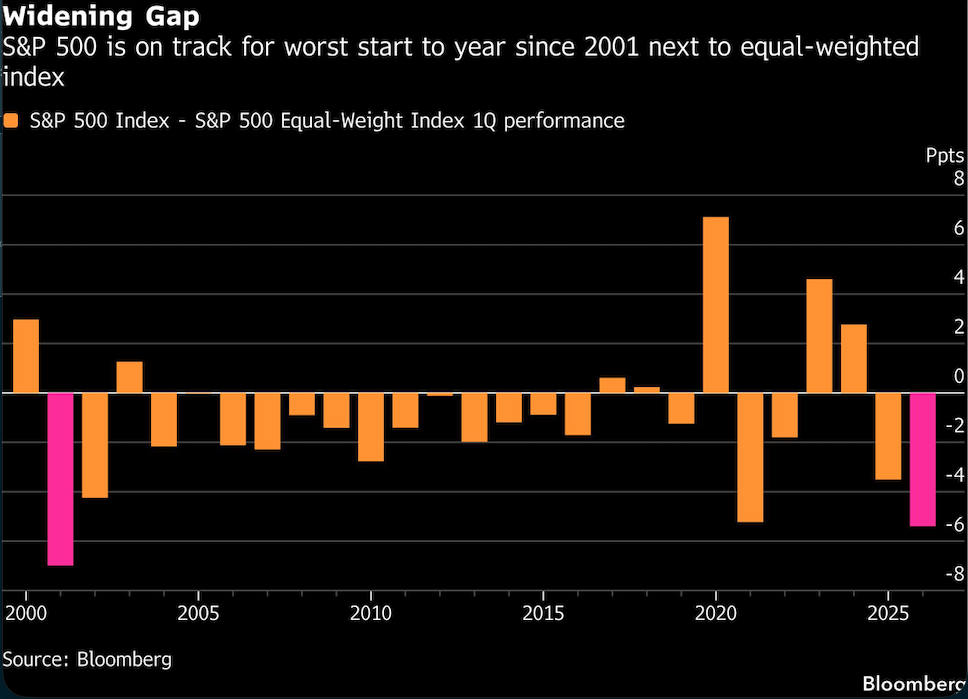
Mind the Performance Gap
As anxiety about the disruptive impact of artificial intelligence mixed with uncertainty over tensions in the Middle East, investors dumped tech megacaps, the stock market’s biggest winners in 2025, in droves. That’s put the S&P 500 on track for its worst quarter relative to an equal-weight version of the gauge since 2001, when the dot-com bubble was bursting.
The equal-weighted S&P 500 is down 8% from its February record and is testing a few key support levels, according to JC O’Hara, chief technical strategist at Roth Capital Partners.
“The Middle East situation remains very fluid, and thoughts of escalation and severe fallout have been embraced by the sentiment of the equity market,” O’Hara wrote.
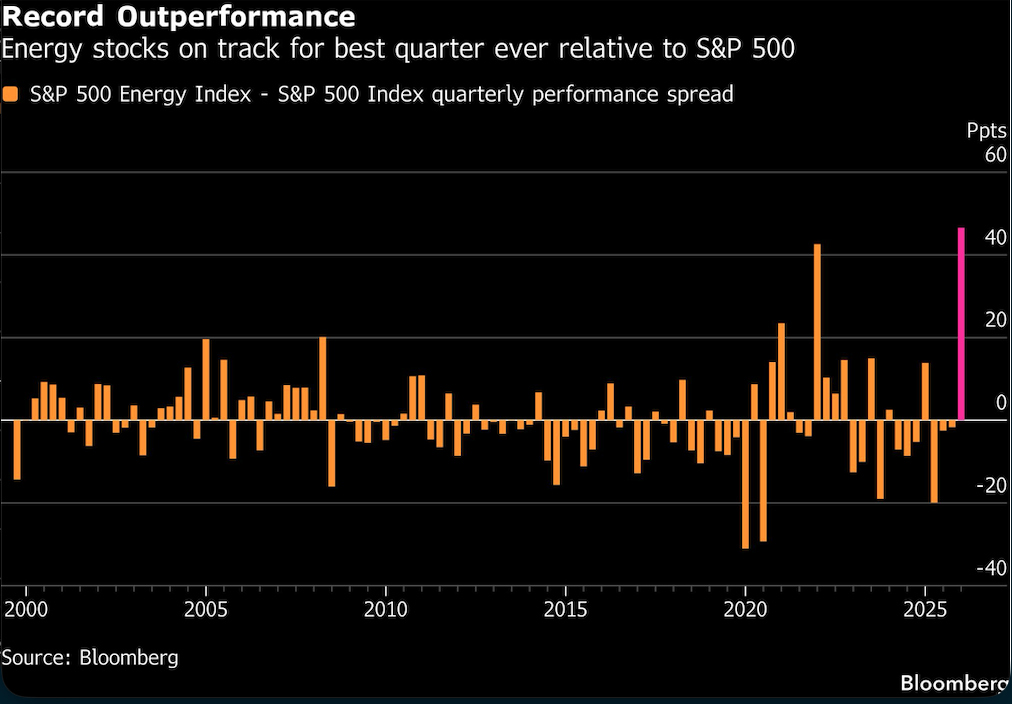
Big Oil’s Big Bounce
Energy stocks have gained 39% this year in the best quarter on record both for the group and relative to the S&P 500. All 22 members of the group have rallied, with APA Corp. and Texas Pacific Land Corp. advancing at least 62%.
While a resolution to the Iran war would likely push energy prices lower, many traders expect crude to remain above where it was before the conflict began, which may help buoy the sector.
“Even looking through the hostilities, the futures market is telling you that crude is not going back to the same levels that it was beforehand,” Sosnick said.
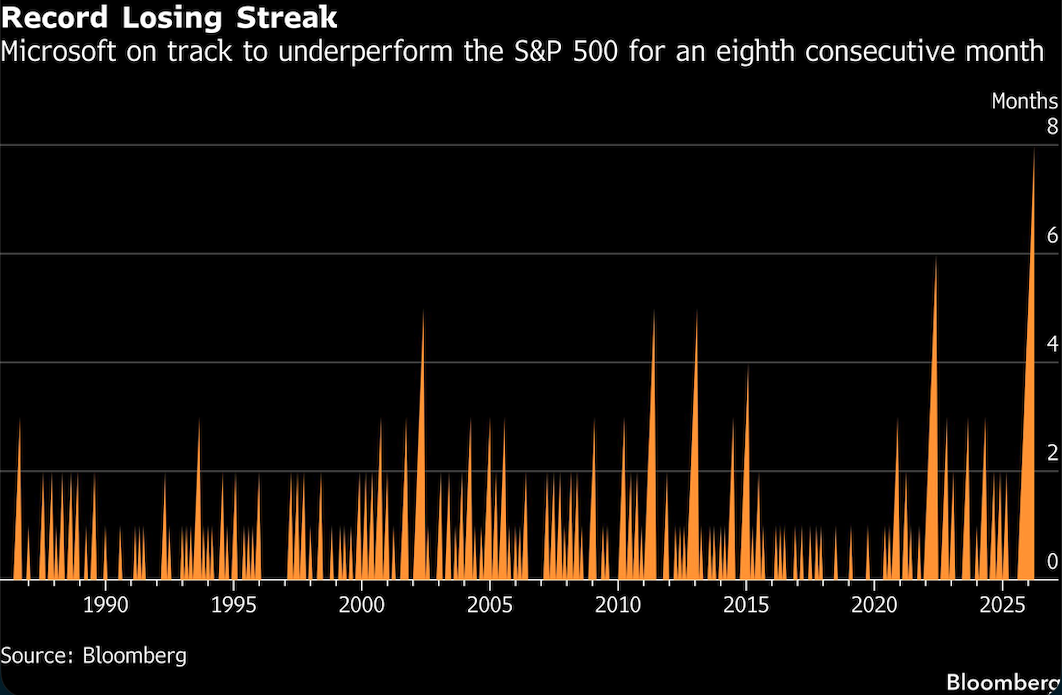
Microsoft Leads Big Tech’s Bad Stretch
Of the so-called Magnificent Seven stocks — Nvidia Corp., Microsoft Corp., Apple Inc., Alphabet Inc., Amazon.com Inc., Meta Platforms Inc. and Tesla Inc. — all have plunged at least 10% from their respective records. The group is down 16% this year.
Microsoft has performed the worst, falling 26% since early January amid uncertainty over the company’s capital spending plans and worries about rising competition for software makers from AI startups.
March is on track to mark the stock’s eighth-straight month of underperformance relative to the S&P 500 — its longest losing streak ever.
Microsoft has also been the biggest drag on the S&P 500 since the beginning of the year, erasing 107 points from the benchmark even though companies like Nvidia and Apple have larger weightings in the gauge.
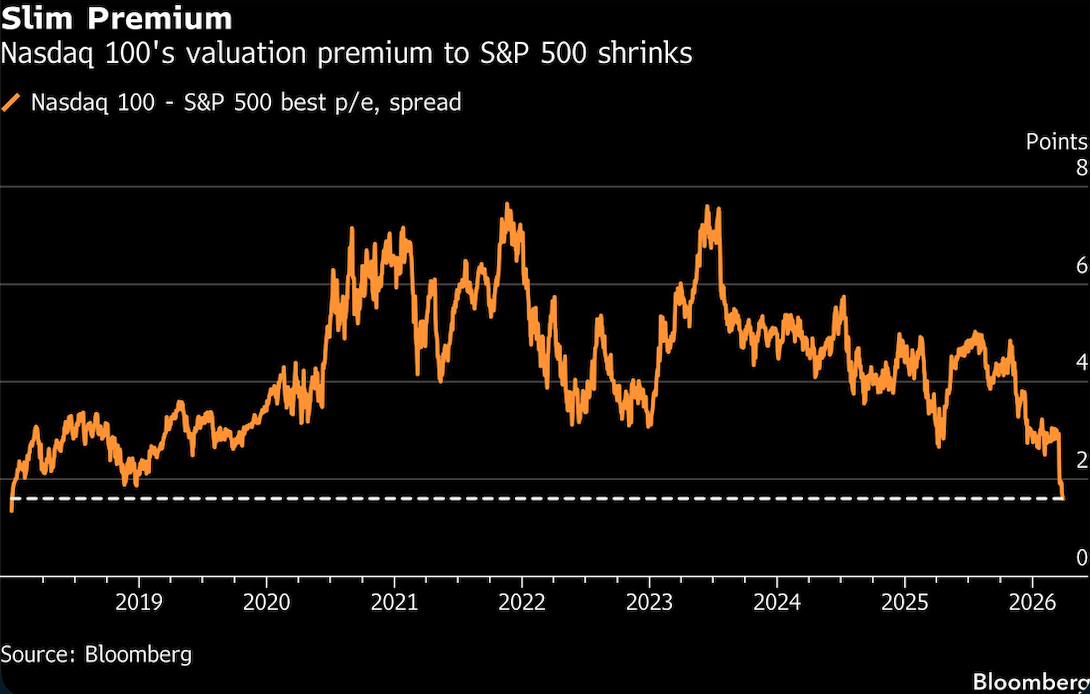
Subsiding Valuations
The Nasdaq 100 entered a technical correction last week, marking a more than 10% drop from its October peak. The decline has pushed the group to trade at 21 times projected 12-month profits, less than 2 points above that of the S&P 500. A gap this narrow has preceded rallies in the tech-heavy gauge in the past.
“The compression in technology multiples has happened in real time, in public, in a matter of weeks,” Mark Malek, chief investment officer at Muriel Siebert & Co., said in a Monday note. To him, the selloff in tech may be followed by an even faster rebound.
“Today’s technology leaders are not Polaroid. They are not Xerox,” he said. “Microsoft, Nvidia, Apple, Alphabet — these companies generate free cash flow that simply did not exist in any prior era of market history.”
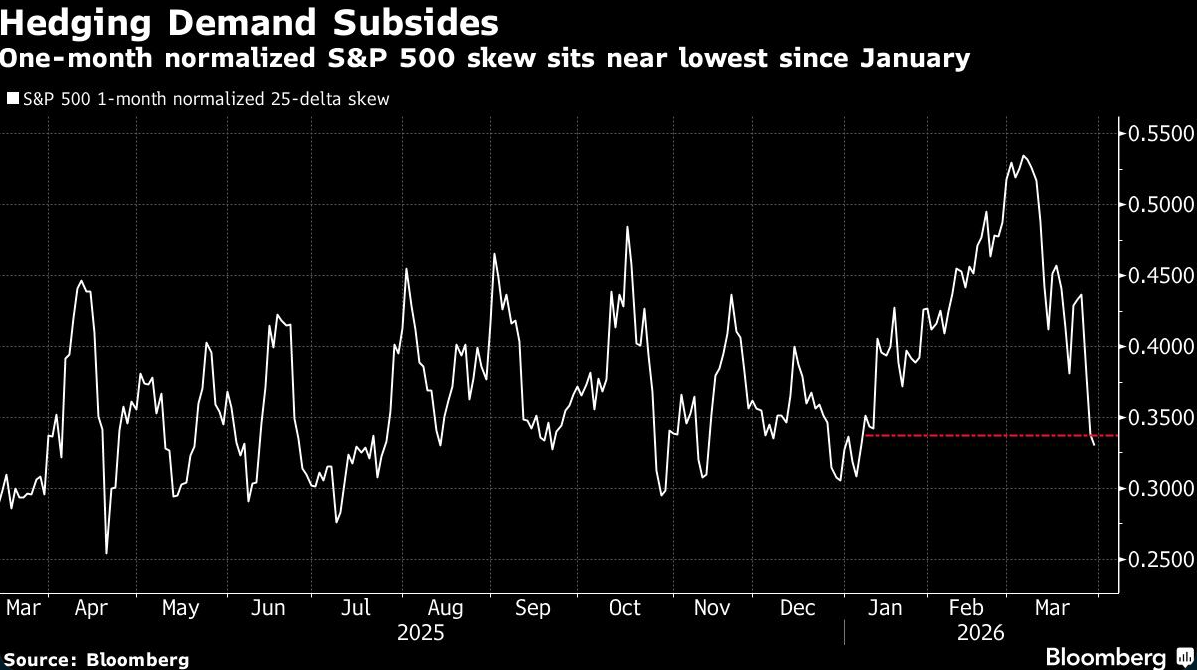
Demand for Hedges Ebbs
Uncertainty around the war in the Middle East has pushed Wall Street’s chief fear gauge, the VIX Index, to the highest level since President Donald Trump’s tariff turmoil in April.
Last week’s VIX jump was driven by investors buying out-of-the-money calls, according to analysis from Cboe Global Markets. Even after the S&P 500 fell 3.4% in the two days through Friday, “the bid to volatility came more from the upside than downside as investors positioned for a potential rebound,” Mandy Xu, head of derivatives market intelligence at Cboe wrote in a note on Monday.
Looking at the one-month implied volatility of calls compared with puts on the S&P 500 actually shows demand for hedging further losses has dropped to the lowest since January.
A message from Advisor Perspectives and VettaFi: Discover something new! Click here to register for our upcoming webcasts.
Bloomberg News provided this article. For more articles like this please visit
bloomberg.com.