An Anatomy of the U.S. Fixed Income Market
Membership required
Membership is now required to use this feature. To learn more:
View Membership Benefits Advisor Perspectives welcomes guest contributions. The views presented here do not necessarily represent those of Advisor Perspectives.
Fixed income may not grab headlines like equities, but it's the bedrock of the U.S. financial system. With over $73 trillion in outstanding debt, on par with U.S. equities by market cap, the fixed income market fuels everything from local infrastructure to corporate expansion and the federal government's operations. In today's environment, with 10-year Treasury yields around 4.0%, fixed income offers compelling risk-adjusted returns.
Fixed income serves multiple roles: the risk-free benchmark (Treasuries), a stable funding source (municipals and agencies), a driver of credit creation (corporates and structured products), and increasingly a private alternative to traditional banking (direct lending).
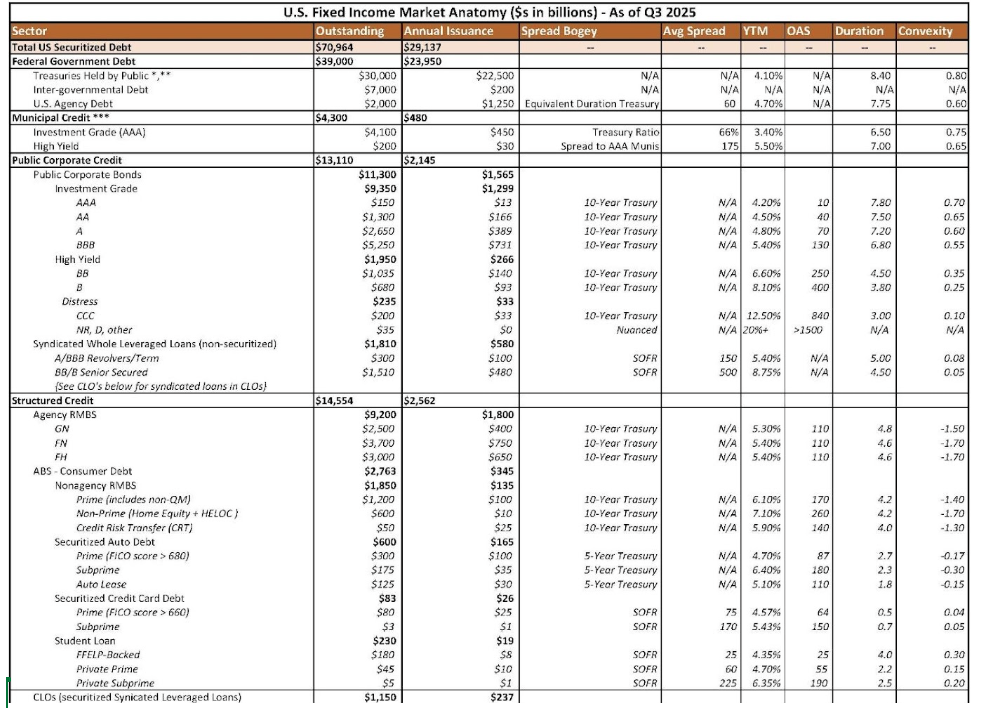
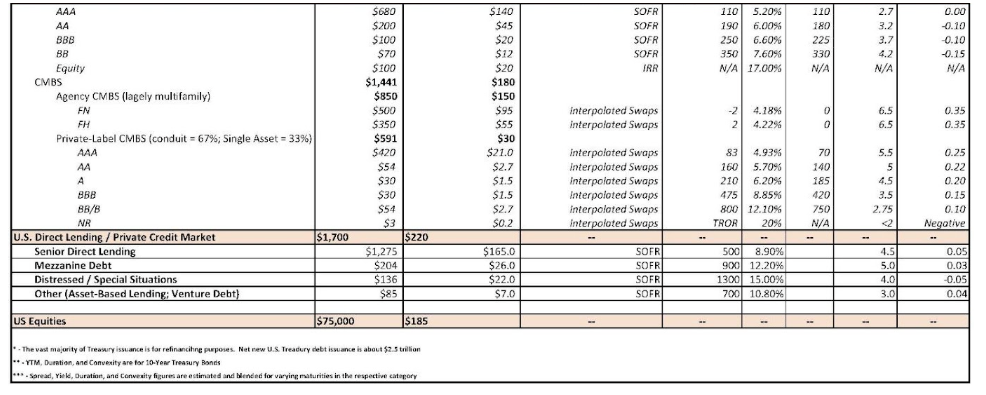
As part of this article, we have supplied an overview, in table format, of the various segments of the fixed income markets with associated outstanding balances, annual issuance, and various valuation metrics such as yield, spread, duration, convexity, etc., to give the reader a sense of the relative sizes and valuation aspects of fixed income sectors. We highlight a few observations:
- The overall tradable fixed income market is roughly equal to the tradable equity market at $73 trillion, with over half of that being federal government debt.
- Despite the diversity in credit rating categories, the corporate bond market is dominated in size by bonds in the “A” or “BBB” rating categories, as these two rating categories make up about 70% of the entire corporate bond market.
- Despite the damage caused to the structured finance sector by the Great Financial Crisis, it is still about the same size as the corporate bond market, at around $15 trillion.
- Private credit is becoming a substantial market as it approaches $2 trillion in outstanding balance.
What About the Agg?
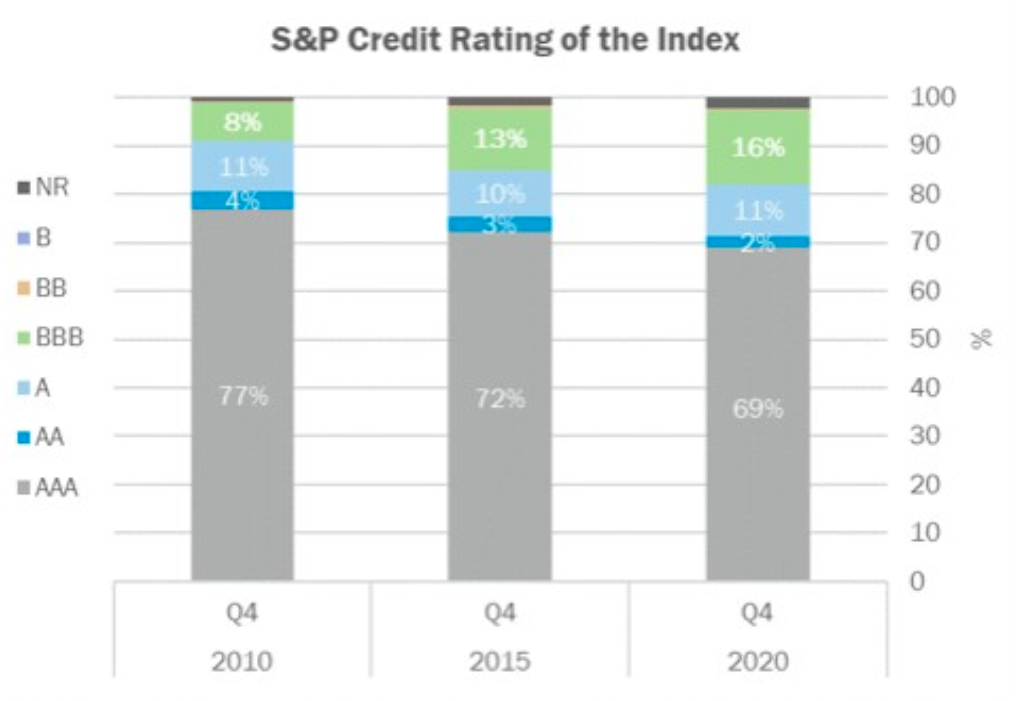
Most fixed income investors are familiar with the Bloomberg U.S. Aggregate Index, or ‘the Agg.’ The Agg is the most widely used U.S. fixed income market benchmark. However, it does not provide a comprehensive view of the U.S. fixed income markets. In fact, it represents less than half of the fixed-income universe by market value. Additionally, a large portion of the Agg is highly rated and government guaranteed.
![]()
To fully understand U.S. fixed income markets, we need to look outside the Agg.
The Anatomy of the U.S. Fixed Income Market
1. U.S. Federal Government Debt: The Risk-Free Foundation
U.S. federal government debt sets the foundation for fixed income markets globally. The market is comprised of public Treasuries, agency debt, and intergovernmental holdings.
- Public Treasuries ($30 trillion outstanding, $22.5 trillion annual issuance): The Public Treasury market is the most liquid fixed income market worldwide, with daily trading volumes often exceeding $1 trillion. The 10-year Treasury note sets the tone for pricing across financial markets, as it is often used as a proxy for the “risk-free rate.” Foreign holders account for about 25% of issuance outstanding, and the Fed accounts for about 22%.
- Agency Debt ($2 trillion outstanding, $1.25 trillion annual issuance): Agency debt is issued by governmental agencies, such as Fannie Mae, Freddie Mac, and Farm Credit. Agency debt is considered nearly risk-free.
- Intergovernmental Holdings ($7 trillion): Intergovernmental holdings are non-tradable assets like Social Security trusts. This sector is largely irrelevant for investors.
Valuation: Valuation of the U.S. Federal Government Debt is fairly straightforward and takes into account yield curve dynamics and auction (issuance) results.
2. Municipal Credit: Funding America's Infrastructure
Municipal credit, also known as “munis,” are issued by state and local governments. Default rates are low in this asset class, often below 0.1%. Additionally, munis offer federal and sometimes state tax exemptions, making them particularly valuable for taxable investors. This segment of the fixed income market finances schools, roads, and utilities.
- Investment Grade ($4.1 trillion outstanding, $450 billion annual issuance): Investment-grade munis are primarily AAA-rated. At first glance, yields may appear low for this asset class. However, on a tax-adjusted basis, muni yields can offer investors strong returns.
- High Yield ($200 billion outstanding, $30 billion issuance): High-yield munis can include issuances such as tobacco bonds, Puerto Rico restructurings, and hospital debt.
Valuation: Valuation of municipal credit focuses on muni-to-Treasury ratios, after-tax yields, and call features.
3. Public Corporate Credit: Fueling Business Growth
Companies issue public corporate credit. This sector helps fuel business growth and investment spending. While this segment of the market can be more volatile than government or municipal debt, it remains a crucial financing tool for corporations.
- Investment Grade Bonds ($9.4 trillion outstanding, $1.3 trillion annual issuance): Bonds with a rating of BBB or higher are considered “investment grade.” BBB issuances make up over 50% of the investment-grade corporate credit market.
- High Yield Bonds ($2.0 trillion outstanding, $233 billion annual issuance): Bonds with a rating of BB or lower are considered “high yield” or “below investment grade.” BB issuances account for nearly 50% of the high yield corporate credit market.
- Syndicated Loans ($1.8 trillion outstanding, $580 billion annual issuance): Syndicated loans are loans made by a collection of lenders to a single borrower. These types of loans are often levered and floating rate.
Valuation: Valuing corporate credits typically requires using option-adjusted spreads (OAS) and discounted cash flows.
4. Structured Credit: The Securitization Engine
Structured credit relies on a process known as securitization, in which non-tradable assets, such as individual mortgages, auto debt, or student loans, are repackaged to create a tradable asset whose returns depend on the cash flows of the underlying loans. This segment of the fixed income market plays a crucial role in providing liquidity and allowing investors to access differentiated sources of return.
- Agency Residential Mortgage-Backed Securities (RMBS) ($9.2 trillion outstanding, $1.8 trillion annual issuance): Agency RMBS are guaranteed by Ginnie Mae, Fannie Mae, or Freddie Mac and are backed by a pool of residential mortgages guaranteed by these agencies. They are often considered to be backed by the full faith and credit of the U.S. government, making them less risky.
- Non-Agency RMBS ($1.85 trillion outstanding, $135 billion annual issuance): Non-agency RMBS are backed by privately issued residential mortgages but not backed by a U.S. Government agency. They are typically considered riskier than Agency RMBS.
- Asset-Backed Securities (ABS) – Consumer Debt ($2.8 trillion outstanding, $345 billion annual issuance): Asset-backed securities are backed by a variety of loan types. These can include auto debt, credit card debt, or student loan debt.
- Collateralized Loan Obligations (CLOs) ($1.15 trillion outstanding, $237 billion annual issuance): CLOs, also known as bank loans or leveraged loans, are pools of bank loans. These loans typically hold first-lien positions in the company’s capital structure.
- Commercial Mortgage-Backed Securities (CMBS) ($1.44 trillion outstanding, $180 billion annual issuance): CMBSs are backed by pools of commercial mortgages. These mortgages often finance large properties such as malls, office buildings, or large multi-family developments.
Valuation: Valuations for structured credit rely on option-adjusted spreads (OAS), prepay models, and tranche-specific risks.
5. Direct Lending: The Private Credit Surge
Direct lending has grown in popularity over the past decade, as post-Great Financial Crisis regulations made it more difficult for traditional banks to lend to corporate entities. Lenders in this space often negotiate directly with companies. The majority of issuances are floating rate. This segment of the fixed income market is generally very illiquid.
- Senior Direct Lending ($1.3 trillion outstanding, $165 billion annual issuance)
- Mezzanine ($204 billion outstanding, $26 billion annual issuance)
- Distressed ($136 billion outstanding, $22 billion annual issuance)
Valuation: Valuations within direct lending rely on company financials, discounted cash flows, and comparative analysis
Active Management in Fixed Income
Fixed income is far more than a conservative corner of the market. It is the structural backbone of the U.S. economy. While the Bloomberg U.S. Aggregate Index remains a useful reference point, it only scratches the surface of a $73 trillion market that spans diverse sectors and risk profiles.
For investors, understanding the full anatomy of fixed income is critical, not only to capture attractive risk-adjusted returns in today’s environment but also to appreciate its indispensable role in powering economic growth and financial stability. As fixed income markets continue to evolve and grow in complexity, it is increasingly important to partner with strong active managers who have expertise in navigating the various sectors of the fixed income market.
A message from Advisor Perspectives and VettaFi: Discover something new! Click here to register for our upcoming webcasts.
Glossary:
Spread: Spread is the difference in yield (or interest rate) between two bonds. It is typically calculated as the difference between the yield of a corporate bond and the yield of a U.S. Treasury bond with a similar maturity, or the yield of a floating rate index such as SOFR.
Duration: Duration is the most common measure of a bond's price sensitivity to changes in interest rates. Higher durations have higher volatility with respect to market rate changes.
Convexity: Convexity is a measure of the curvature in the relationship between a bond's price and its yield. It refines the duration calculation. Higher convexity numbers are better, and negative convexity numbers are an undesirable feature for investors; therefore, they need to be compensated by a higher yield to maturity (YTM).
Yield: Yield is the return an investor earns on a bond, expressed as an annual percentage rate. While there are different types of yield (like current yield or yield to call), the most common is YTM.
Yield to Maturity (YTM): Yield to maturity is the total anticipated return an investor will receive if the bond is held until its maturity date, assuming all coupon payments are reinvested at the same rate.
Basis Point: A basis point is a unit of measure equal to one-hundredth of a percentage point (0.01%).
Call Features: Call features (or a call option) give the issuer of a bond the right, but not the obligation, to repurchase (or "call back") the bond from the bondholders before its scheduled maturity date. Call features create negative convexity for bonds, and investors demand higher yields to be compensated for accepting this negative convexity.
Option-Adjusted Spread (OAS): The option-adjusted spread is the measure of a bond's yield spread that excludes the cost/value of any embedded options, such as a call feature. OAS represents the spread of a bond after eliminating call features, helping create a more apples-to-apples comparison between positively and negatively convex bonds.
Swap: A swap is a derivative contract in which two parties agree to exchange the cash flows from two different financial instruments over a specified period. The most common type is an interest rate swap.
SOFR (Secured Overnight Financing Rate): SOFR is the primary benchmark interest rate used for pricing U.S. dollar-denominated financial products, including loans, bonds, and derivatives, having replaced the controversial LIBOR.
Credit Rating: A credit rating is an assessment of the creditworthiness of a bond issuer (like a corporation or government) by a credit rating agency (such as S&P, Moody's, or Fitch). The rating evaluates the issuer's financial strength and its ability and willingness to repay the principal and interest on its debt. Ratings are usually expressed as letter grades (e.g., AAA, AA, Bbb, C).
Sources:
www.pgpf.org
www.pewresearch.org
Urban Institute
Ginnie Mae
SIFMA
SFA
S&P
Fitch
Moody's
FRED
NAIC
Russell Investments
wolfstreet.com
ycharts.com
vaneck.com
Wikipedia
Reuters
Investopedia
Membership required
Membership is now required to use this feature. To learn more:
View Membership BenefitsSponsored Content
Upcoming Virtual Events View All


