How the Fed Deals Liquidity: A Look Inside Its Monetary Toolbox
Membership required
Membership is now required to use this feature. To learn more:
View Membership Benefits Advisor Perspectives welcomes guest contributions. The views presented here do not necessarily represent those of Advisor Perspectives.
In our last article, QE Is Coming, we focused on why the capital and financial markets have become so dependent on the Fed for liquidity. The article explains that, in the aftermath of the crisis, a slew of regulations drastically changed the liquidity landscape. As a result, the Fed — not the private market — is now the primary provider of liquidity.
A reader asked us: “Can you provide a list and description of the liquidity tools in the Fed’s toolbox?”
We like the idea. Given the importance of liquidity to financial market performance, it is crucial to understand not only who supplies liquidity but also how they do so.
Let's walk through the Fed’s balance sheet and gain a better appreciation for its toolbox.
Total Reserve Balances
In our prior article, we noted that overnight liquidity providers have shifted from private markets to the Fed.
Many repo counterparties that provided liquidity in the pre-2008 era were not banks and, therefore, did not hold bank reserves. Today, with many of those liquidity-providing counterparties unable or unwilling to participate, liquidity comes from the banks via the Fed.
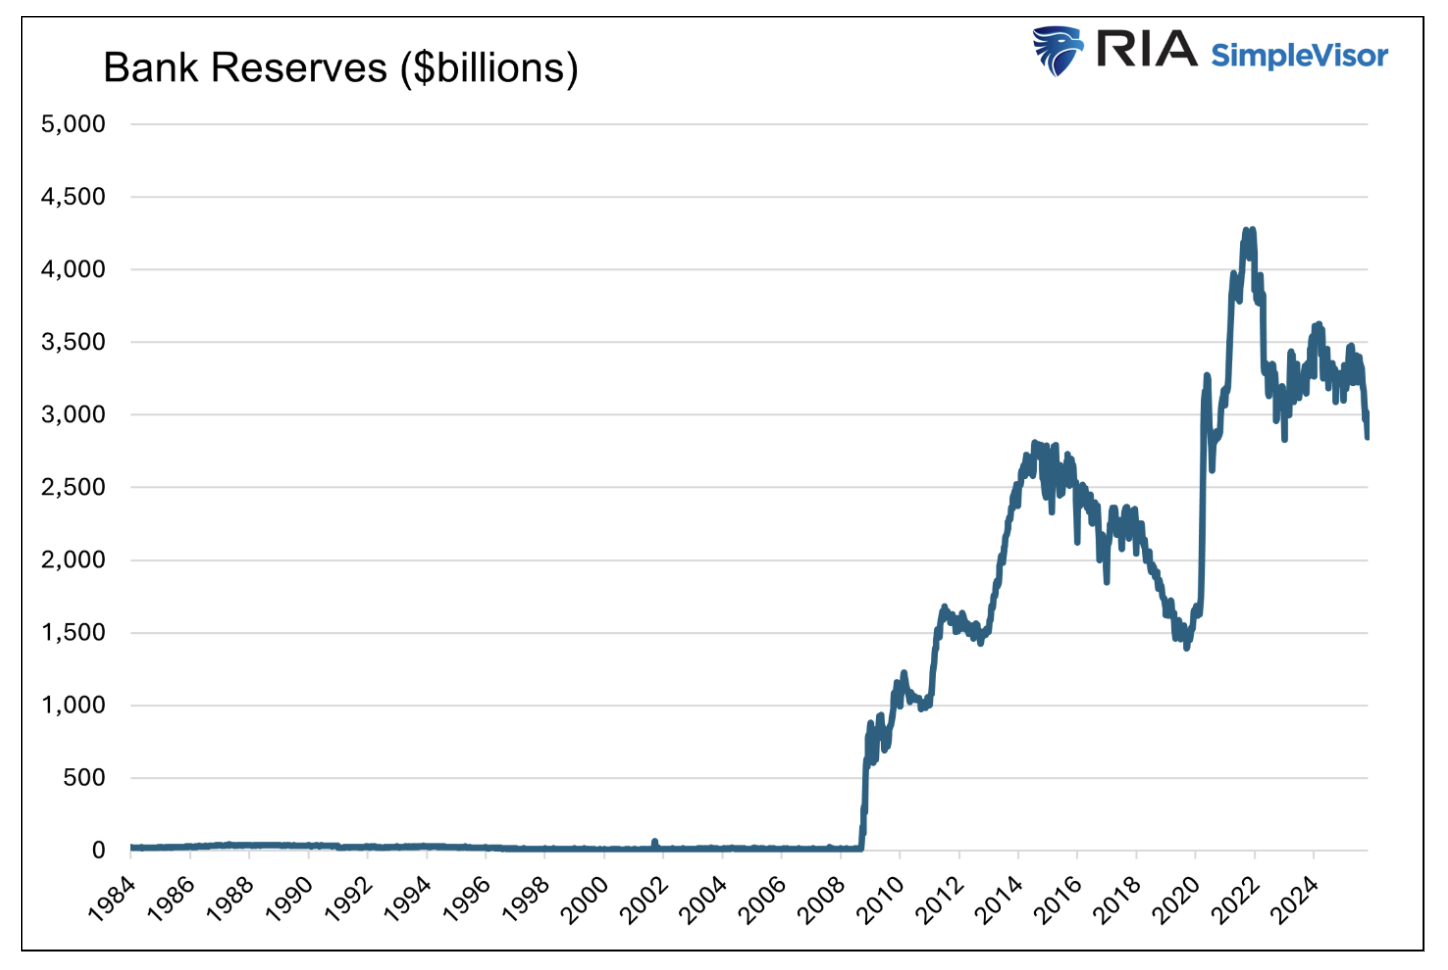
When a bank transacts with the Fed, the Fed either adds or withdraws reserves to the banking system. Thus, when assessing the level of outstanding liquidity, a glance at banking system reserves provides a reliable gauge. Think of reserves as a footprint of Fed actions.
The graph below shows that bank reserves are approaching five-year lows. Unsurprisingly, the Fed has ended quantitative tightening (QT), which reduces reserves, and has begun hinting at quantitative easing (QE).
Given that liquidity in the financial system is now reserves-based, let's look at the Fed's tools to add and reduce those reserves.
QE & QT
QE and QT are the most well-known tools in the Fed’s arsenal.
QE occurs when the Fed purchases Treasury or mortgage-backed securities (MBS) from the banking system. The Fed pays the banks for the securities with reserves. Consequently, QE removes securities from the market and increases bank reserves.
QT is the opposite; it effectively puts securities back into circulation, thereby removing reserves from the banking system.
As the chart below shows, QE and QT are correlated with bank reserves. However, there are clearly other factors — some under the Fed's control and others beyond its reach — that also affect reserves.
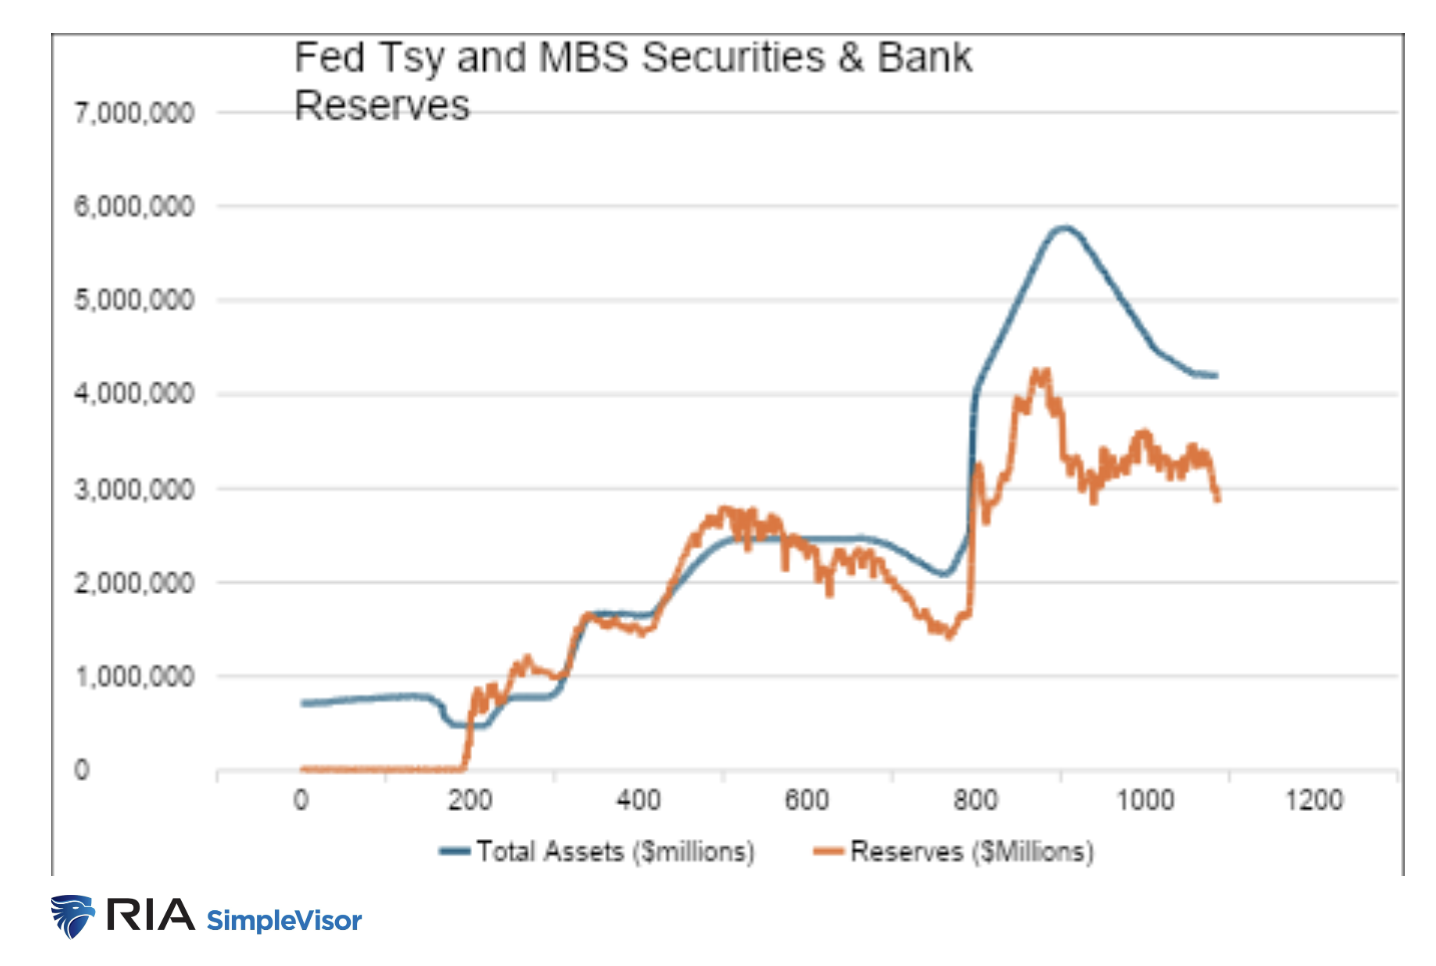
QE and QT are blunt liquidity tools. They regularly inject or withdraw reserves on a fixed schedule, regardless of the system's daily liquidity requirements.
Other Reserve Management Tools
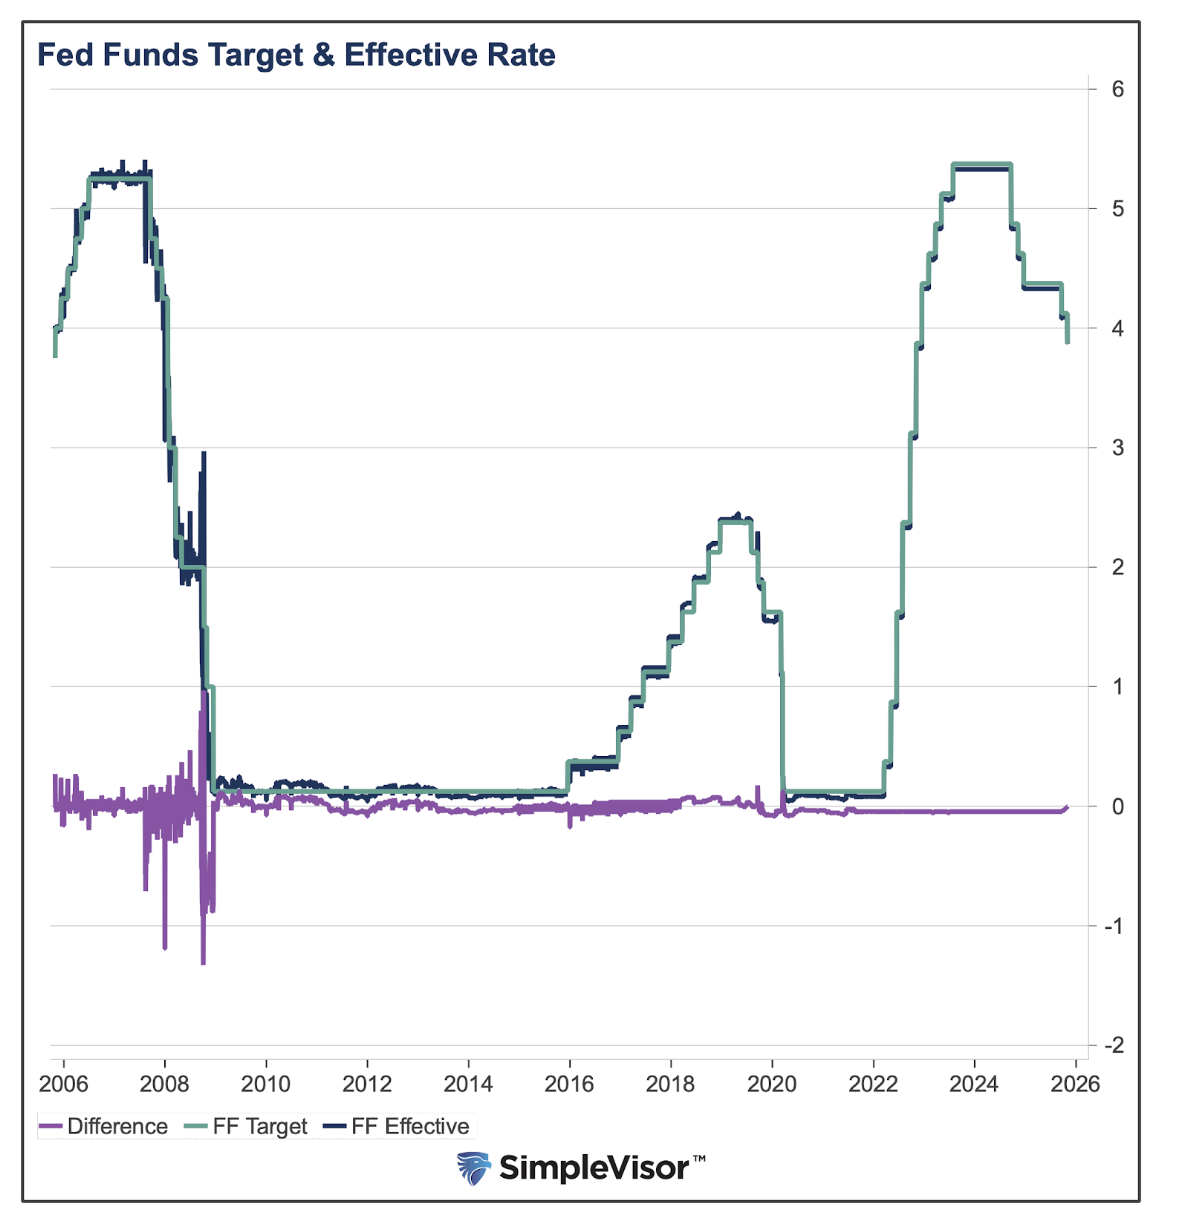
To help fine-tune the financial system's daily liquidity demands, the Fed offers several facilities to the capital markets. The rates on these programs are based on the Fed’s target fed funds rate. While activity in the fed funds market pales in comparison to prefinancial crisis levels, it remains the policy rate at which the Fed targets overnight financing.
As the graph below shows, the Fed is incredibly effective at controlling this rate.
The Fed uses five primary tools to target the fed funds rate:
- Interest on Reserve Balances (IORB): The Fed pays interest on banks’ reserves held at the Fed. Raising the rate increases the incentive to hold reserves, and vice versa. Therefore, IORB can effectively manage reserves and, in turn, liquidity.
- Open Market Operations: Before 2008, open market operations were the primary tool the Fed used to manage the fed funds rate. These operations entail the Federal Reserve buying and selling government securities to withdraw or add liquidity to the money markets. Buying increases reserves and adds liquidity, while selling does the opposite. You can think of these as QE or QT transactions that occur on an as-needed basis. These operations are now infrequent but allow for a precise daily targeting of reserves.
- Overnight Reverse Repurchase Facility (ON RRP): Through this program, the Fed borrows money from a counterparty in a repo agreement. The program helps keep a floor on overnight interest rates. This facility was extremely helpful in absorbing excess liquidity resulting from the massive pandemic stimulus. Its daily volume is now minimal.
- Standing Repo Facility (SRF): This facility provides overnight liquidity to the market by lending cash against collateral. Just as the ON RRP acts as a floor, the SRF acts as a ceiling. Assuming counterparties are willing to borrow from the Fed, the fed funds rate should theoretically be capped at the SRF rate.
- Discount Rate: Like open market operations, the discount rate is a relic from before the financial crisis. Like the SRF, it serves as a backstop. The discount rate is higher than the fed funds rate, so there is little incentive to use it outside of a severe liquidity shortfall.
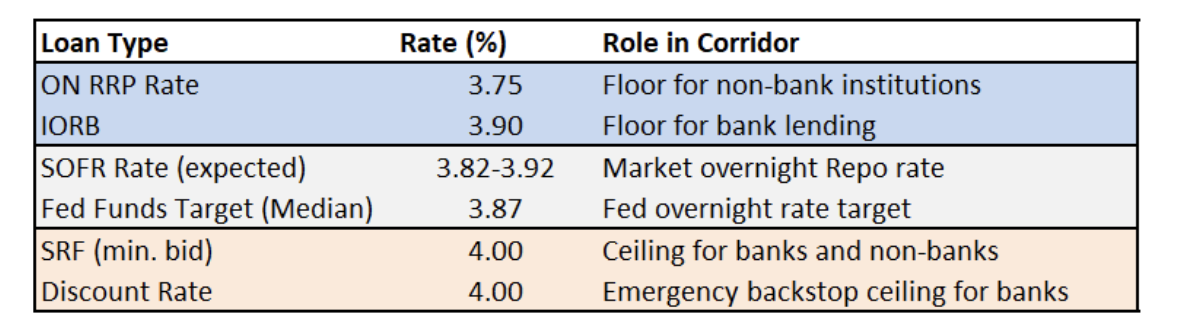
Essentially, these tools create a corridor — a set of floors and ceilings — allowing the Fed to control overnight borrowing rates. The table below shows what the corridor looks like under a healthy liquidity scenario, assuming today’s fed funds target range of 3.75%-4.00%.
Regulatory Factors Affecting Liquidity
As we discussed extensively in "QE Is Coming," a spate of conservative regulations has significantly changed who provides liquidity to the capital markets. However, there is growing speculation that these risk-averse regulatory measures could be reversed soon.
When Chair Powell’s term ends next year, we are likely to see some deregulation in the banking industry, which should improve the private sector's ability to provide liquidity. Per The Washington Post:
One of the most consequential shifts may come in a highly technical debate over how much debt banks can use to fund their investments and the size of financial buffers that big banks hold to absorb losses. The Federal Reserve and other regulators are planning to ease requirements in ways that could have the effect of increasing the overall amount of debt and lowering the protective cushions in the system. While it remains unclear exactly where officials will land, it’ll be far from the Biden-era effort to essentially do the opposite.
Over the long run, the risks of deregulating the banking industry are valid, as history has proven that such actions can be unwise. However, investors should also focus on the short-term benefits. Specifically, reductions in capital requirements — especially for the largest banks (GSIBs — globally systemically important banks) — would free up capital, allowing them to make more loans and/or buy more securities. Generally, this would result in more systemwide liquidity. Additionally, the largest banks would likely post higher profits and be incentivized to hold U.S. Treasuries, thereby lowering yields.
The Public Sectors' Impact on Liquidity
The Fed has significant power to manage liquidity, but the free market still dictates its distribution and use. Consider a few ways in which the public sector dictates liquidity:
- Bank Deposits: When a customer deposits money at a bank, they are essentially providing the bank with liquidity. Through the fractional reserve banking system, a single deposit allows the bank to create loans that, in aggregate, can be up to 10x the original deposit. Withdrawals have the opposite effect.
- Loan Demand: Strong loan demand consumes reserves, thus reducing available liquidity. Conversely, when the private sector is not demanding loans, reserves tend to be stable.
- Bank Lending Policies: Tight lending policies reduce liquidity from the markets, while easy policies increase it. Lending policies are often a function of system reserves and broader economic conditions.
- Economic Conditions: Economic conditions tend to play a large role in the demand and supply of liquidity.
- Federal Deficits: Federal deficits require debt issuance, which drains liquidity from the system. The larger the deficit, the more liquidity it demands, crowding out the private sector.
- Treasury General Account (TGA): The TGA is essentially the federal government's checking account, maintained at the Federal Reserve Bank of New York. It holds tax receipts, proceeds from Treasury auctions, and payments distribution. When the government builds its TGA balances, it drains liquidity from the market. Conversely, when the TGA balance declines, liquidity enters the market. While this is an essential part of the liquidity equation involving the Fed, Fed staff has no control over these balances.
Tracking Liquidity at the Fed
Every week, the Fed releases its balance sheet and the changes to it from the prior week. The report is linked here.
In addition, all the programs discussed in this article can be charted on the St. Louis Fed's FRED website.
Graphing Today’s Liquidity Stress
Let’s look at two graphs to help appreciate the liquidity stress that is slowly brewing in the capital markets. For reference, SOFR, or the secured overnight financing rate, is the overnight borrowing rate for nonbank financial institutions. U.S. Treasury securities collateralize SOFR financing; thus, for all intents and purposes, it is risk-free.
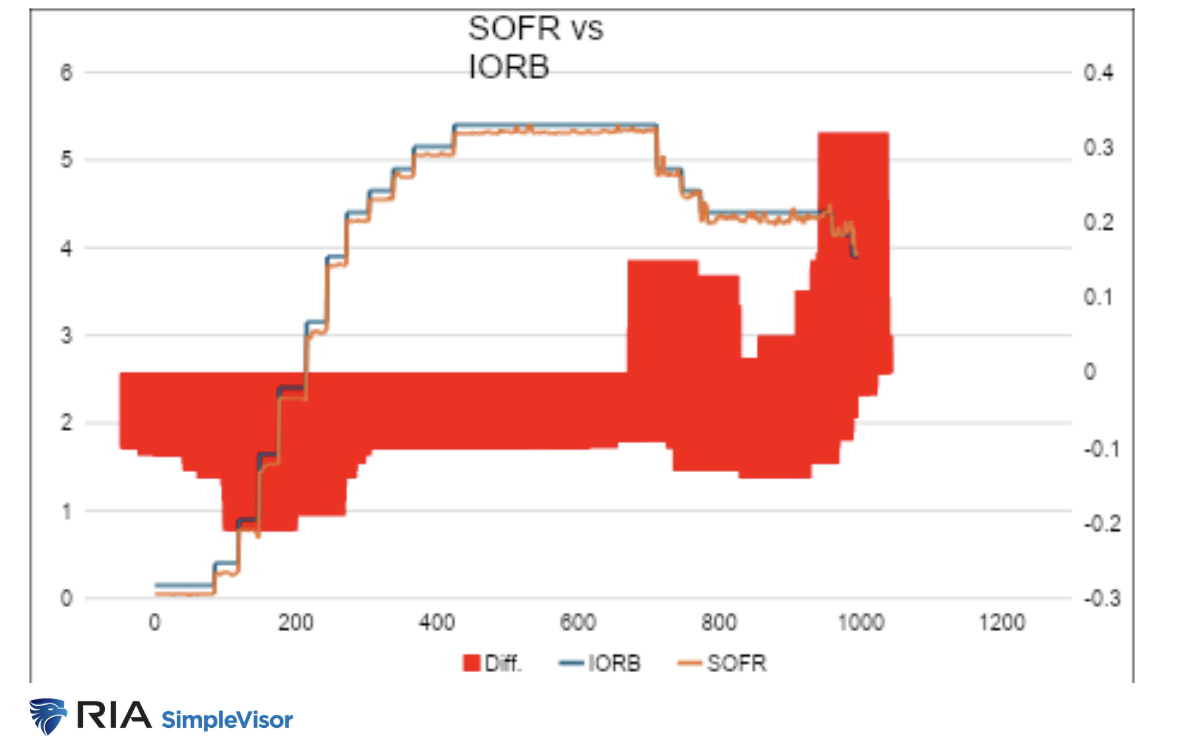
SOFR vs. IORB
SOFR represents the overnight repo rate among nonbank financial institutions. This rate is typically above the ON RRP rate (at which institutions can lend to the Fed) and below the IORB rate.
In ideal liquidity conditions, a bank should decide to lend via the collateralized SOFR markets whenever the SOFR rate exceeds the IORB rate. When SFOR is above IORB and banks don’t lend, it signals there is a liquidity shortfall or another reason banks are unwilling to increase profits without taking on risks. As shown below, SOFR has been consistently trading above IORB since October.
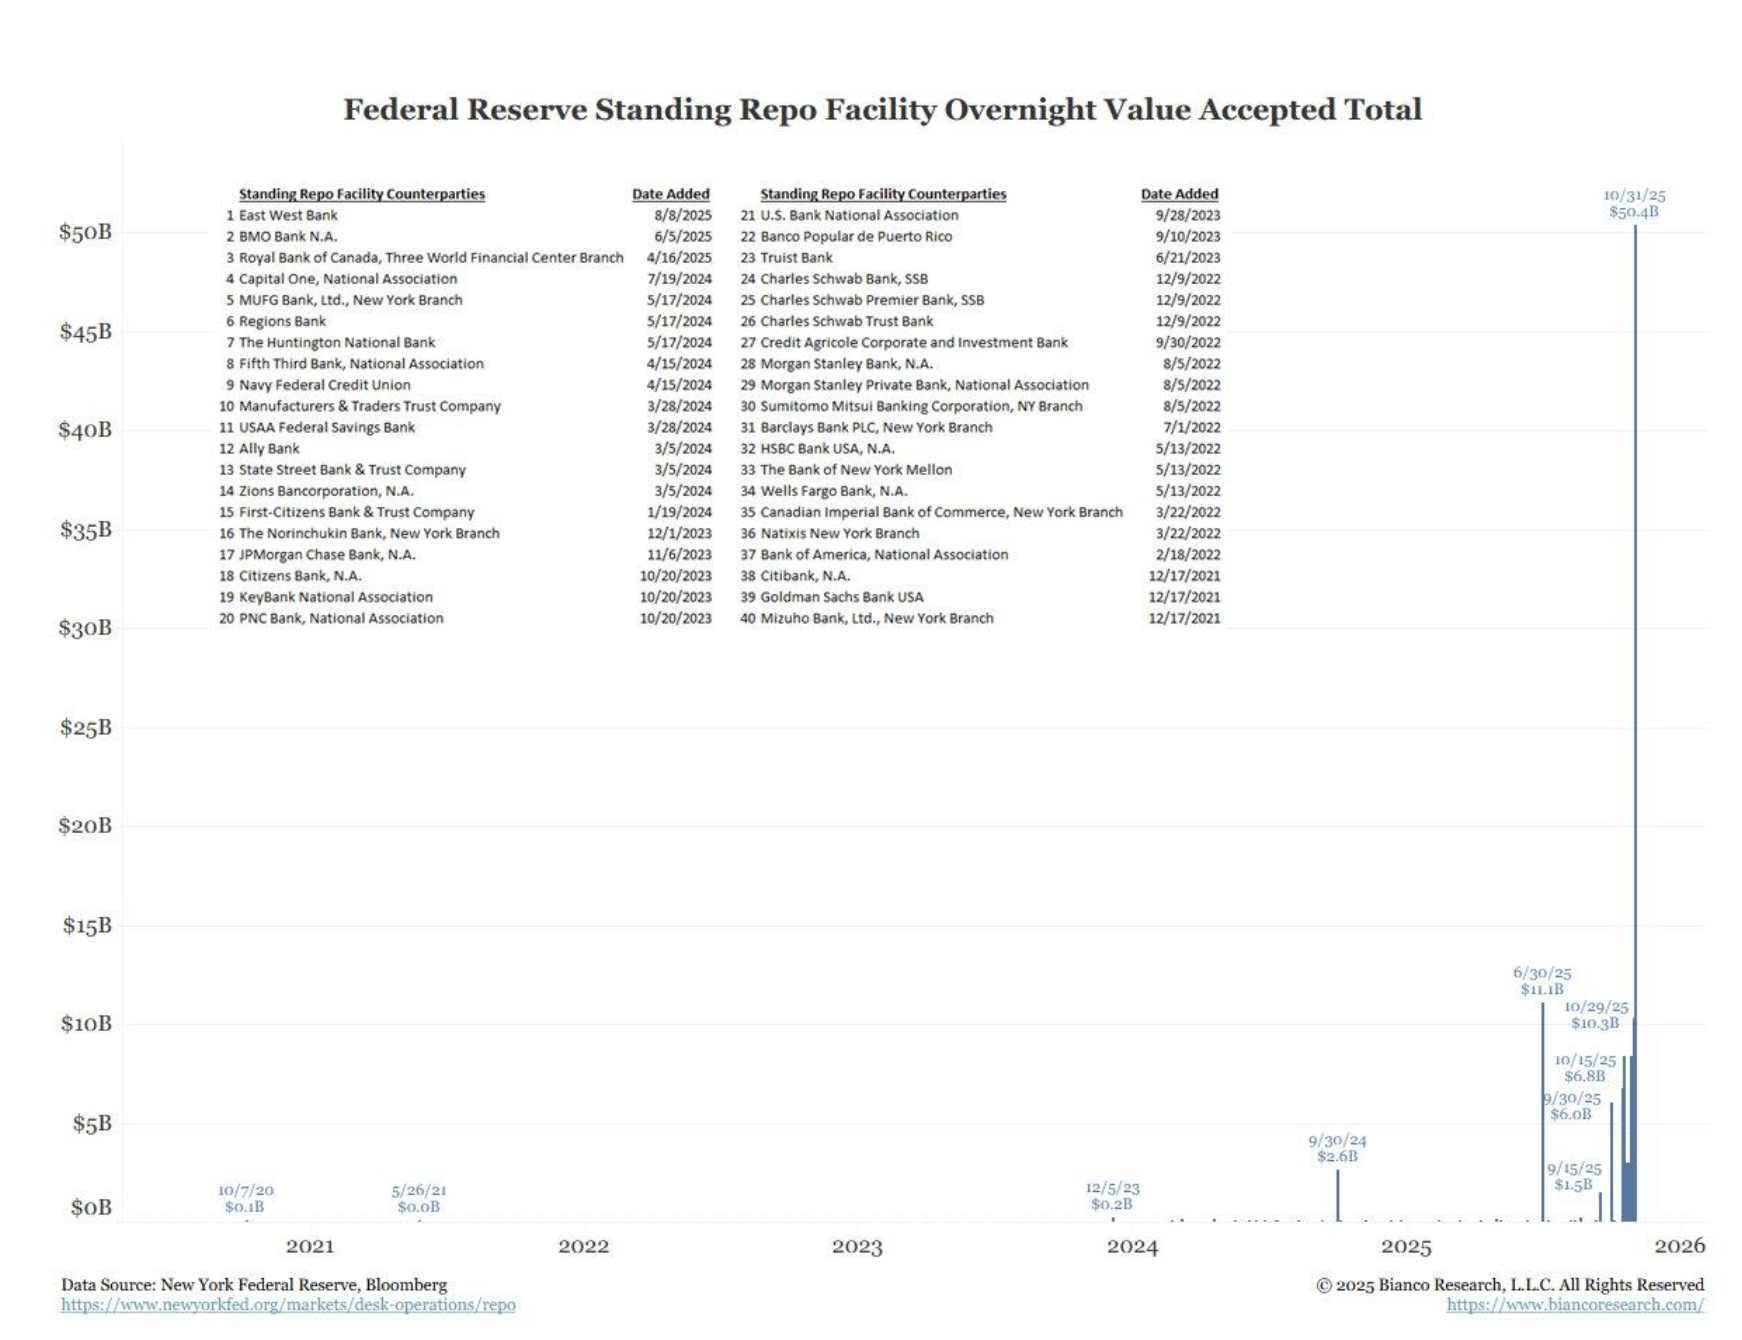
Standing Repo Facility Usage
The graph below, courtesy of Bianco Research, shows that the Standing Repo Facility has been used somewhat frequently over the last two months. As we noted earlier, this acts as a ceiling of sorts and should theoretically be used only when the SOFR market is not functioning properly.
Summary
Whether you deeply understand the mechanics of the Fed’s toolbox or simply grasp the basics, the critical takeaway from this article and "QE Is Coming" is the Fed has much more control over liquidity than it did before 2008. Consequently, given that liquidity is a primary driver of markets, the Fed’s monetary and regulatory actions should be of utmost importance to investors and followed closely.
Michael Lebowitz is a portfolio manager with RIA Advisors and author for Real Investment Advice. For more information, contact him at [email protected] or 301.466.1204.
Join RIA Advisors and elevate your career within a deeply experienced team focused on innovation. Our collaborative environment is built on a foundation of advanced technology and effective investment models, designed to enhance your ability to serve clients and grow your practice. Benefit from a supportive culture that encourages professional development and fosters a forward-thinking approach. By joining our team, you’ll be part of a group dedicated to excellence and continuous improvement, empowering you to focus on building meaningful client relationships and pursuing your business ambitions. Discover the advantages of working with our accomplished advisory team by starting your conversation today.
A message from Advisor Perspectives and VettaFi: Discover something new! Click here to register for our upcoming webcasts.
Membership required
Membership is now required to use this feature. To learn more:
View Membership BenefitsSponsored Content
Upcoming Virtual Events View All


