Advisor Perspectives welcomes guest contributions. The views presented here do not necessarily represent those of Advisor Perspectives.
As equity valuations approach — or in some cases surpass — the record highs of 1999, investors are growing increasingly anxious. This unease is partly driven by the media issuing grim warnings, often based in part on CAPE valuations. For example, consider the following headlines and their summaries.
-
The AI valuation bubble is now getting silly - The Guardian (Oct. 8, 2025)
-
- This article warns that concentration risk in the "Magnificent Seven" tech companies is at an extreme level. It notes the CAPE is at a dot-com bubble peak, and suggests that when the AI bubble bursts, there will be few places to escape the fallout.
-
‘Extreme caution needed': Why the Wall Street Boom Might End in Bust - Yahoo Finance (Oct. 7, 2025)
-
- This piece highlights that the CAPE ratio is more than double its long-term average, indicating potentially lower returns ahead. It points out that extreme valuations have historically led to periods of weak returns or sharp corrections.
-
Warren Buffett’s famed measure of stock valuations has entered dangerous territory - Business Insider (Oct. 1, 2025)
-
- This article notes that the Shiller CAPE ratio is at its third-highest level ever. It cites Federal Reserve Chair Jerome Powell, who called the market "fairly highly valued," and highlights that 19 out of 20 Bank of America valuation measures are also historically elevated.
-
‘We are in a gigantic price bubble': Famed economist warns extreme stock valuations point to negative returns ahead - Business Insider (Sept. 13, 2025)
-
- Citing economist David Rosenberg, this report highlights the market's high CAPE ratio alongside a weakening economic backdrop, including a softening labor market.
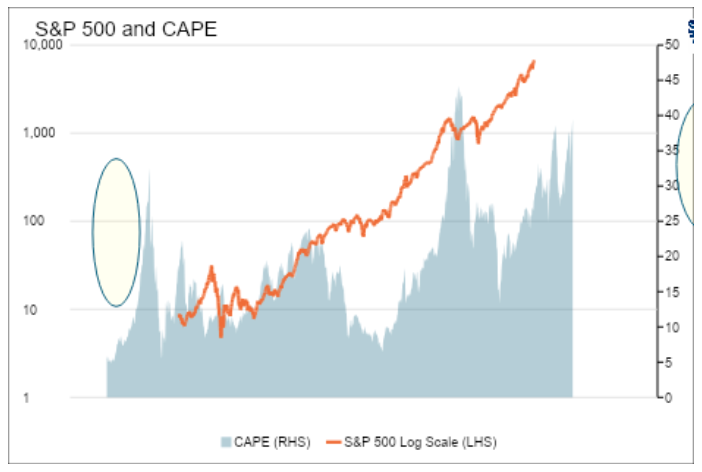
The following graph shows the S&P 500 and CAPE since 1920. Given how the market performed after the prior two CAPE peaks (1999 and 1929), it should not be surprising to see fearful headlines like the ones above.
CAPE levels are concerning. However, instead of assuming that the CAPE ratios of 1929 and 1999 are comparable to today, it is helpful to recognize how Nvidia and a few other big stocks are skewing the CAPE, and what that may mean for the rest of the S&P 500.
First, however, we provide a brief overview of CAPE and its pros and cons.
What Is CAPE?
CAPE, or the cyclically adjusted price to earnings ratio, is a valuation tool based on long-term earnings trends. It differs from most valuation ratios in that it uses 10 years of earnings. Most popular valuation measures use the last year of fundamental data.
The benefit of the longer earnings lookback is that the model forms more accurate valuations based on secular trends and is much less influenced by short-term or one-time events that have little impact on future earnings growth.
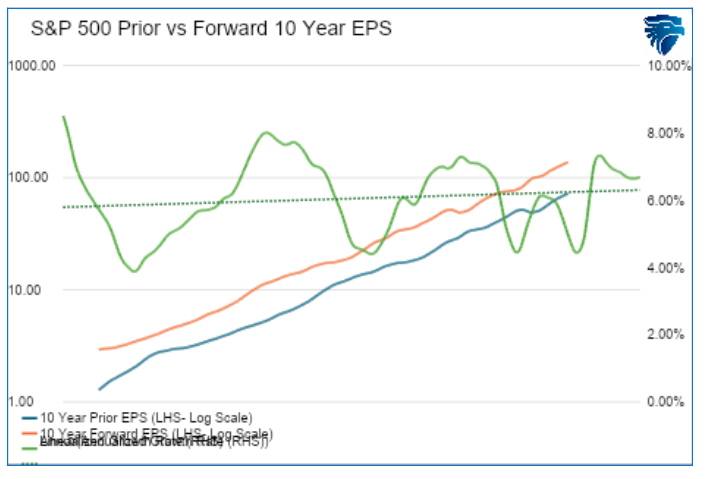
Some argue against the CAPE logic, claiming that past earnings trends are not indicative of future trends. We agree that for specific stocks, this is undoubtedly the case. However, as we show below, there has been a strong correlation between the earnings of the last 10 years and those of the following 10 years. The orange and blue lines representing forward and past earnings are close to parallel. Any variance in them can be explained by the oscillating annualized EPS growth rate in green. As shown, it wavers between 4% and 8%.
The bottom line is that using 10 years of prior earnings has thus far proven to be a reasonable estimate of future earnings. Therefore, CAPE is a good measure to compare valuations over time.
CAPE: Long-Term vs. Short-Term Return Forecasts
Using CAPE to estimate future returns is like betting on football games. According to ChatGPT, the odds of an NFL team winning when they are 14 or more points betting favorites are 85%. Therefore, such high odds should give us confidence in betting on which team will win. However, predicting the exact path to victory — such as when each team will score or the margin of victory — is nearly impossible.
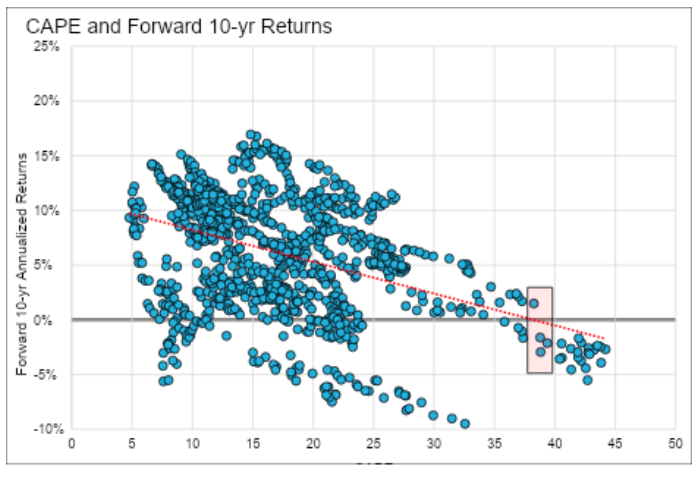
Similarly, CAPE has proven highly reliable at predicting returns for the next 10 years, but it does not specify which months and years within that period will see gains or losses. Consider the two charts below, which compare CAPE levels to 10-year and six-month forward returns.
In the first chart, low CAPE levels indicate high forward returns, and vice versa. At today’s level, we should expect returns for the next 10 years in a relatively tight range between plus and minus 3%.
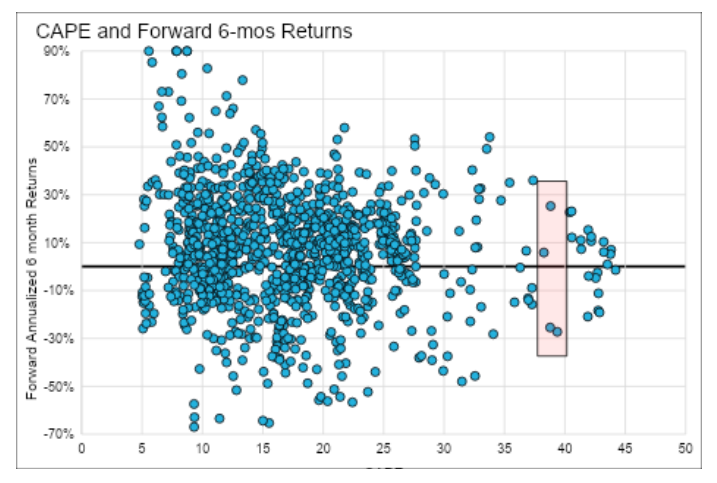
However, the second graph shows no predictive reliability in forecasting the next six months based on CAPE levels. Based on that graph, we should expect annualized returns of ±30%.
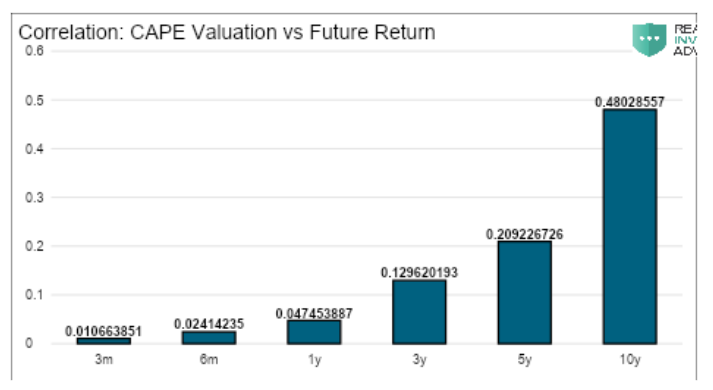
Lastly, the bar chart below shows that the longer the time horizon, the better the correlation between CAPE and forward returns.
Composition Skews CAPE
Due to the ever-changing nature of the S&P 500, every monthly CAPE calculation involves different weightings and sometimes different stocks. For example, the CAPE ratio of 1929 was heavily weighted with industrial, utility, and railroad companies. Today, it is technology-centric. As a more specific example, Nvidia contributed 0.50% to the S&P 500 in 2020. Currently, it accounts for almost 8%.
The Magnificent Seven (Nvidia, Apple, Google, Microsoft, Amazon, Tesla, and Meta) account for over a third of the index today. Given their surging market caps and earnings growth, those companies are having an outsized impact on CAPE.
For example, Nvidia, at 8% of the index, posted an EPS of $1.08 last quarter. Its average EPS over the previous 10 years was a relatively paltry 18 cents. Does Nvidia's CAPE reflect reality?
Nvidia and the Rest of the Magnificent Seven Warp CAPE
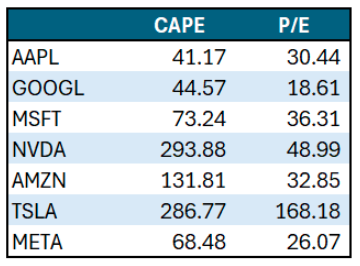
Nvidia has a current CAPE ratio of 293, but a more reasonable P/E ratio of 48. Thus, we can reasonably argue that, given the recent surge in Nvidia’s earnings, CAPE is misleading. The same holds to some extent for many of the Magnificent Seven stocks, as shown below.
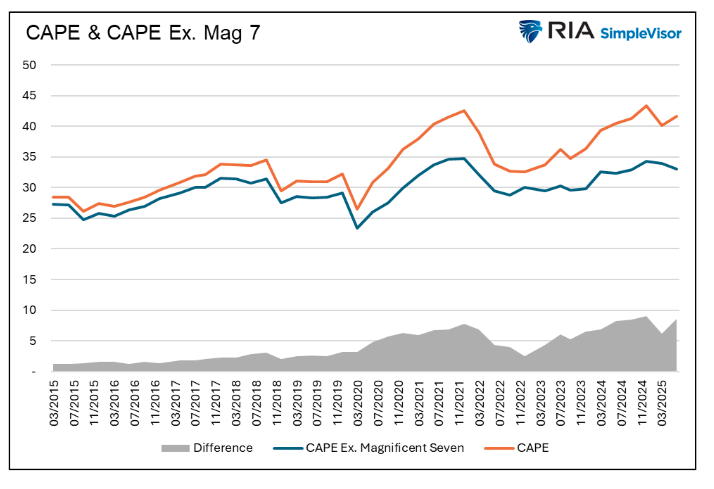
If we strip Nvidia out of the CAPE calculation, the CAPE for the remaining S&P 500 will fall by nearly 3 points. Moreover, if we take all the Magnificent Seven stocks out of the CAPE calculation, CAPE will decline from 41 to 33. The graph below shows how the Magnificent Seven stocks have increasingly warped the CAPE ratio over the last 10 years.
Based on the graph above, we can still say the CAPE ratio is historically high, but it may not be as concerning as we originally thought.
Looking back to 1999, we find that Microsoft had a decent impact on CAPE. At the time, it was the index's most significant contributor, accounting for 5%. Removing Microsoft from the 1999 CAPE calculation would have made it decline by 2. Removing Intel and Walmart, also in the top five in 1999, would have taken another one from CAPE. Exxon and GE, the remaining top five, had no material impact on the ratio. Simply put, the effect today from the largest stocks is greater than in 1999.
PEG Matters
What separates today from 1999 is current earnings growth. Investors are getting more for their CAPE valuation via recent earnings growth. Per Bloomberg” “The Magnificent Seven and Broadcom Inc., which collectively account for 37% of the S&P 500, are expected to grow profits by an average of 21%.”
Investors should be willing to pay high valuations for more growth, but can extraordinary growth rates for a handful of stocks continue? If so, high market valuations make a lot more sense.
Interestingly, some of the Magnificent Seven stocks, which have expensive P/Es but strong earnings growth, may be more conservative than the bulk of S&P 500 companies, which trade at high valuations but have little earnings growth.
To better appreciate this, we use the PEG ratio (Price/Earnings / Expected Growth). This ratio helps make P/E ratios comparable across companies and industries with different growth rates.
The FinViz heat map below shows the PEG ratio for the S&P 500 companies. Notice the sea of red — high PEG ratios — throughout the S&P 500. However, some of the Magnificent Seven, including MSFT, AMZN, NVDA, GOOG, and META, are pretty reasonable.
A message from Advisor Perspectives and VettaFi: Discover something new! Click here to register for our upcoming webcasts.
Read more articles by Michael Lebowitz
 Advisor Perspectives welcomes guest contributions. The views presented here do not necessarily represent those of Advisor Perspectives.