In the years after the internet stock boom-and-bust of the late 1990s and early 2000s, financial economists searched for more satisfying explanations of what had happened than “investors went crazy.” Among the most successful were Lubos Pastor and Pietro Veronesi of the University of Chicago Booth School of Business, whose paper “Technological Revolutions and Stock Prices,” published in the American Economic Review in 2009 (ungated version here), was the focus of an entire conference at the Massachusetts Institute of Technology this month.
The occasion was that the paper had won the biennial Stephen A. Ross Prize from the Foundation for Advancement of Research in Financial Economics (Ross, who died in 2017, was a prominent MIT finance scholar), but the question of how technological revolutions play out in financial markets has also become Topic A again amid the investment boom in generative artificial intelligence. The paper and two precursors by Pastor and Veronesi are built around simple mathematical models that make no predictions about when that boom will end or whether it will end badly, but offer insights into how it will play out. The simplest takeaway is that as the economic significance of AI becomes clearer, the valuations — that is, price-to-earnings, price-to-book and other such ratios — of AI-linked stocks will fall.
The first two papers — “Stock Valuation and Learning about Profitability” (2003) and “Was There a Nasdaq Bubble in the Late 1990s?” (2006) — expand on the fun-with-math result that, in the basic economic formula for how to value growth stocks, more uncertainty about growth equals higher values. The third addresses deeper issues of systematic risk as “new economy” technological innovations begin to have an impact on the “old economy,” which are coming to the fore quite quickly in the technological revolution around AI.
First, the fun with math. The Gordon growth model is a 1950s adaptation of John Burr Williams’s seminal 1938 dividend discount model for stock valuation that says the price of a stock should equal its dividend in the current period (which usually means the current year because interest rates are usually expressed in annual terms) divided by the discount rate minus the expected dividend growth rate. The discount rate is simply the one at which an investor discounts future earnings because they’re in the future; it can be entirely idiosyncratic although it’s often something like the company’s weighted average cost of capital. Because fast-growing tech companies usually don’t pay dividends, Pastor and Veronesi use book value instead of dividends, but the basic idea is the same. Also, if the dividend (or book value or earnings or cash flow) growth rate equals or surpasses the discount rate, the model breaks, delivering first an undefined price because you can’t divide by zero and then negative prices. As the late statistician George Box said, “All models are wrong, but some are useful.”
What’s useful about the Gordon growth model in this case is that it shows why a rational investor might pay more for uncertain earnings growth than equivalent but certain growth, and also why the prices that investor is willing to pay might fluctuate sharply day to day. Here’s a graph of what the model churns out for a stock with a current annual dividend of $1 a share and a discount rate of 10%.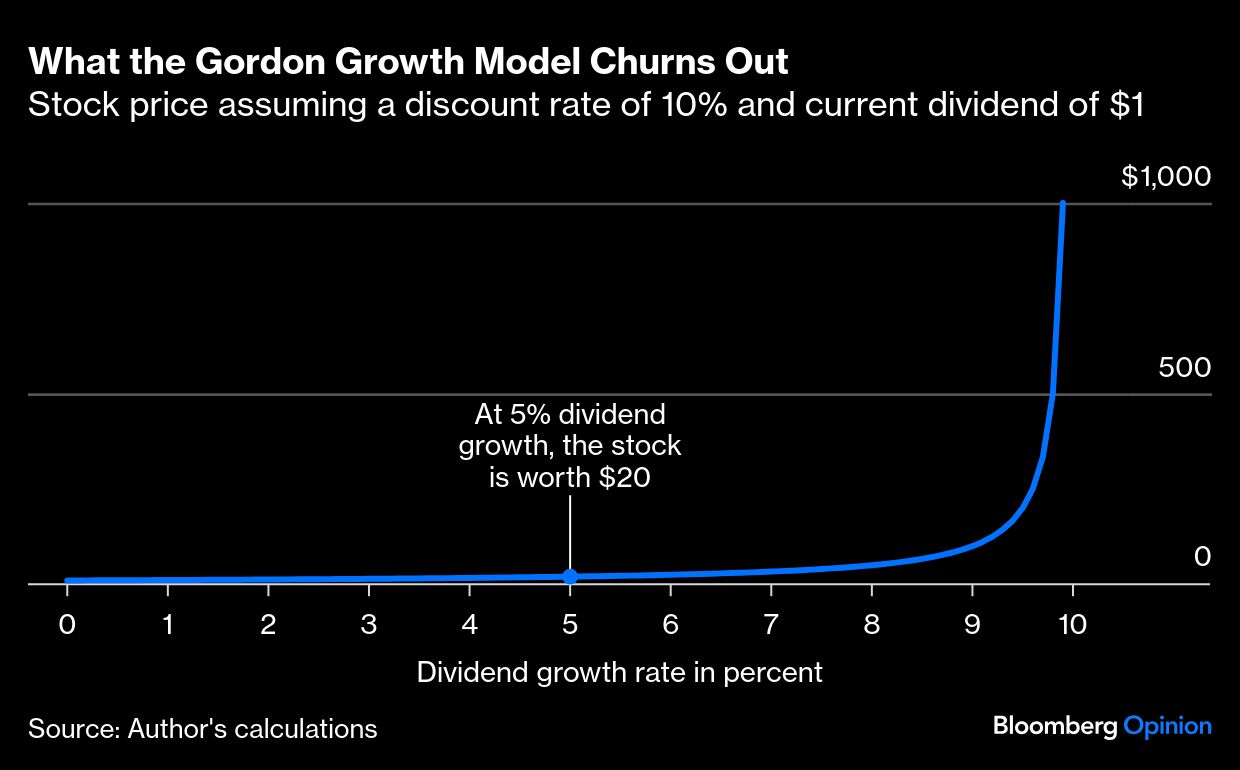
At certain 5% dividend growth, a share of the stock is worth $20. But let’s say you think there’s a 50% chance the growth rate will be 4% and a 50% chance it will be 6%. That works out to the same expected growth rate of 5% (half of 4% plus half of 6%). But plug those growth rates into the model first and the expected value that comes out is not $20 but $20.83 (half of $16.67 plus half of $25).
If there’s a 50% chance the growth rate is 1% and 50% chance that it’s 9%, that also works out to an expected growth rate of 5%, but the expected value jumps to $55.56. Tweak the probabilities to a 60% chance of 1% growth and 40% chance of 9%, and expected value falls to $46.67. Pastor and Veronesi plugged book-value numbers for companies on the Nasdaq exchange in the late 1990s into their version of the model, and it delivered prices and volatility not all that different from those prevailing in markets during the dot-com rise and fall.


