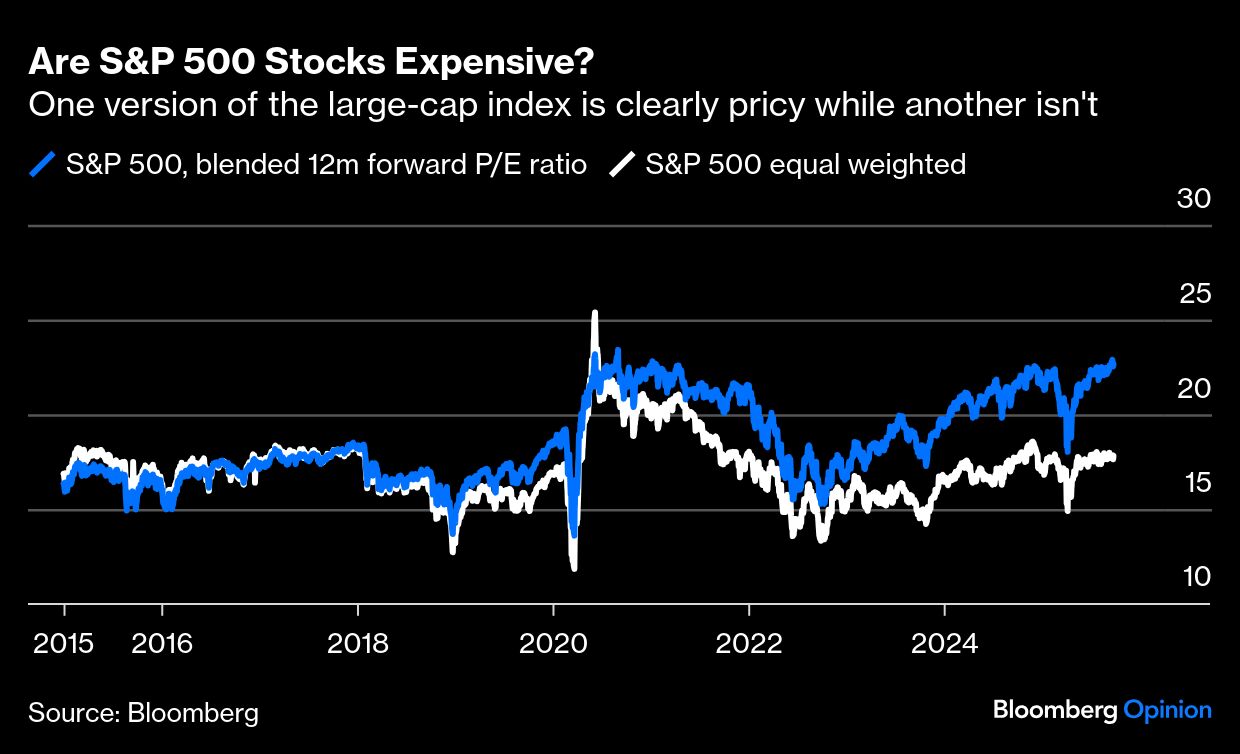
Always intense, the perennial debate over whether equities are too richly valued has become even more fervent of late. As the S&P 500 Index was setting new all-time highs last week, the benchmark’s blended forward price-earnings multiple hit 22.9, the most since 2020 (and eerily close to the highs of the dot-com bubble era at the turn of this century). Of 20 valuation metrics tracked by Bank of America Corp.’s Savita Subramanian, four have reached records and 19 are elevated by historical standards. Yes, these super high multiples still aren’t typical but before declaring stocks are in a bubble that is poised to burst consider a few critical caveats.
By and large, the S&P 500’s current multiple reflects the market capitalization-based weighting structure of the index, the increased dominance of some key technology stocks and a few extreme outliers. In fact, the equal-weighted version of the index — which puts $10 billion companies on par with $4.3 trillion Nvidia Corp. — has a blended forward price-earnings ratio of just 17.8, a whisker above its 10-year average.
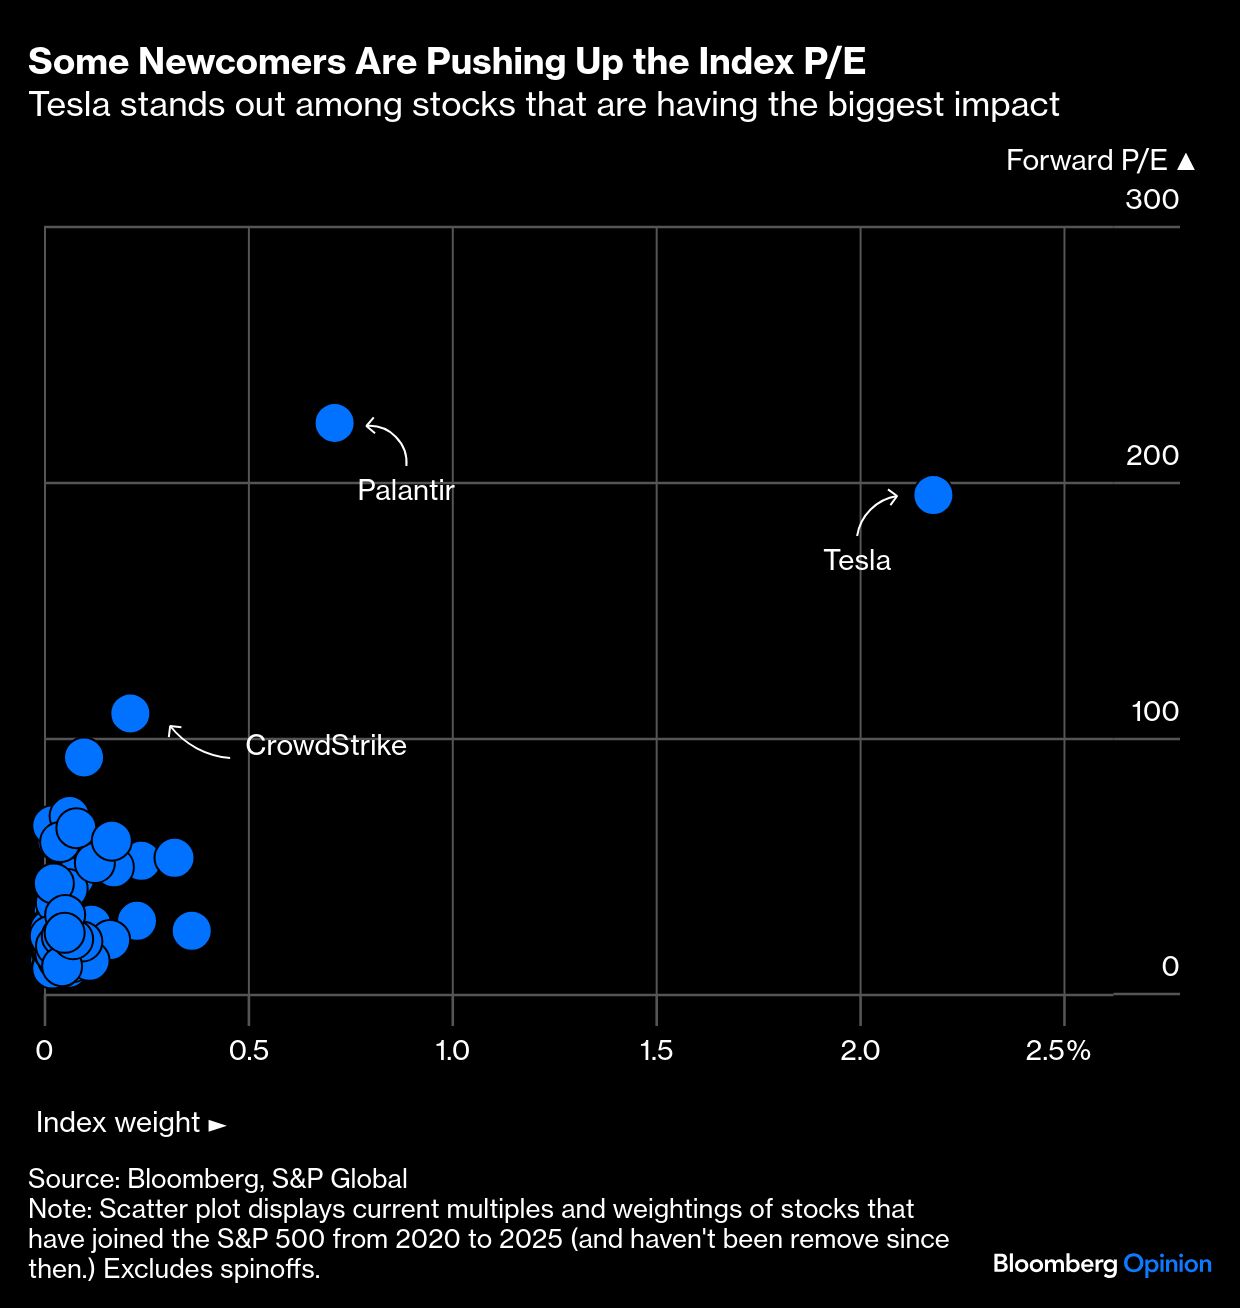
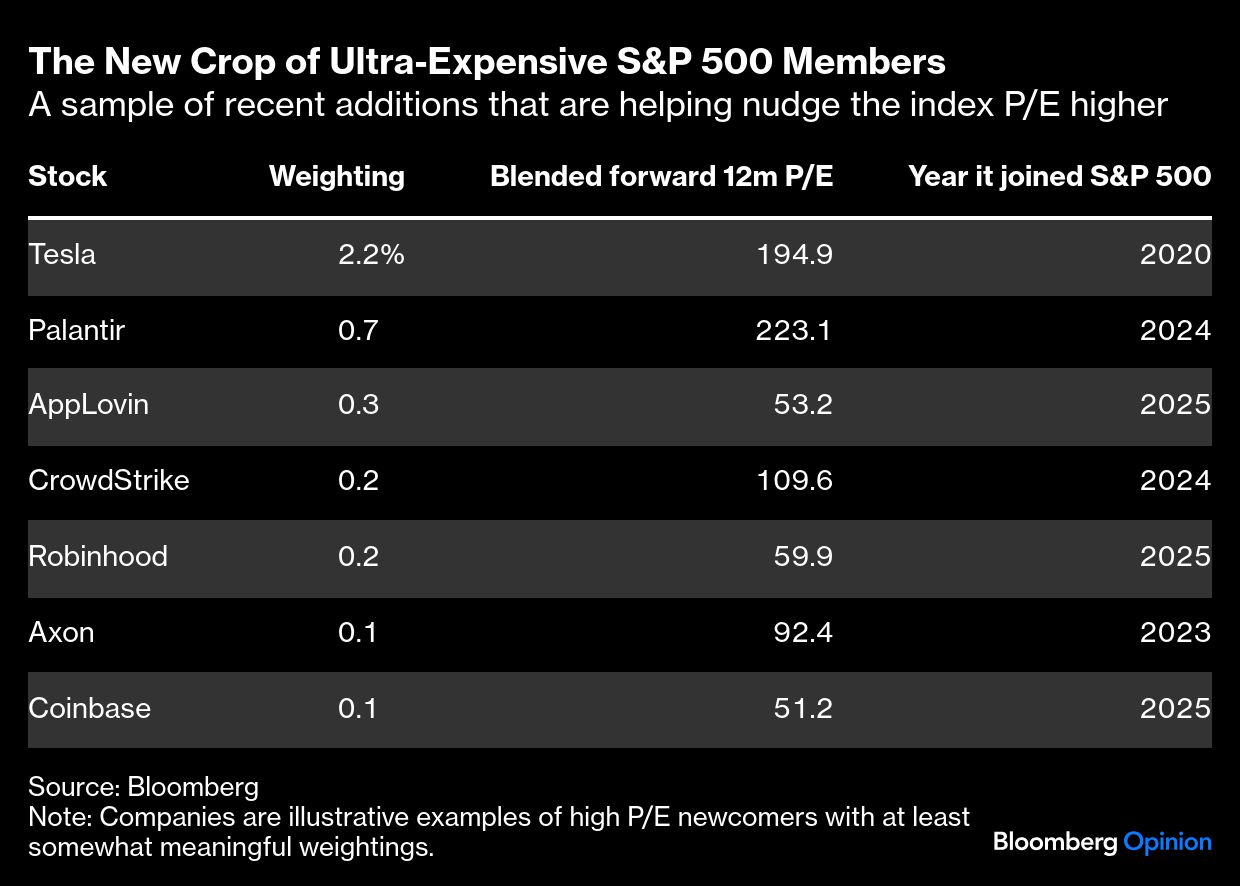
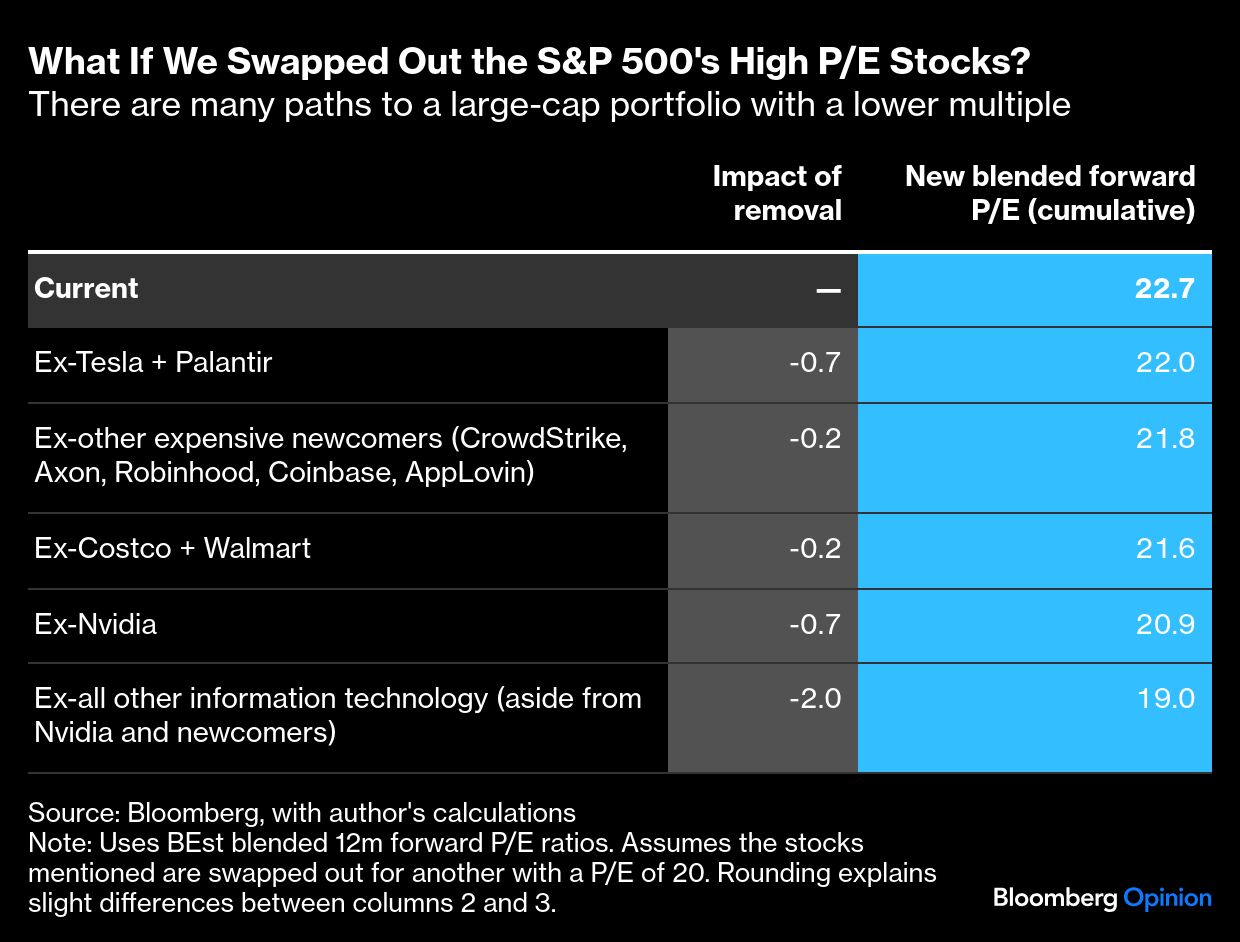
Put another way, a small group of “expensive newcomers,” or the very speculative companies that have joined the S&P 500 in recent years, is making the index appear much more expensive. Many of these companies were hype machines that went public or came of age during the 2020-2021 risk-on frenzy as the government stimulated the economy with trillions of dollars to counter the global pandemic and the Federal Reserve slashed benchmark interest rates to near zero. At the time, it was somewhat easy for large-cap index investors to ignore the newcomers, but that’s impossible now as their index weightings grow, changing the composition of the index in ways that many steady-as-she-goes investors won’t love. To lock in on the ones most affecting the index P/E, I looked at the companies with high multiples and significant weightings. In this scatter plot, they’re the dots to the upper right of most of their peers. From 2020-2024, the highlights were Tesla Inc. (blended forward P/E of 194.9), Palantir Technologies Inc. (223.1), Axon Enterprise Inc. (92.4) and CrowdStrike Holdings Inc. (109.6). The class of 2025 has included Robinhood Markets Inc. (59.9), Coinbase Global Inc. (51.2) and AppLovin Corp. (53.2). Indeed, it was probably the performance of this group in September — especially Tesla — that has stretched index valuations. If you simply ditch Tesla and Palantir, you can bring the index multiple down by around 0.7 to 22 times forward earnings (from 22.7 on Friday), provided you replace them with “normal” stocks (which I define here as having a P/E of 20.) If you ditch the rest of the speculative newcomers, you’d be lower still at 21.8 (jump ahead to the final graphic for accounting).
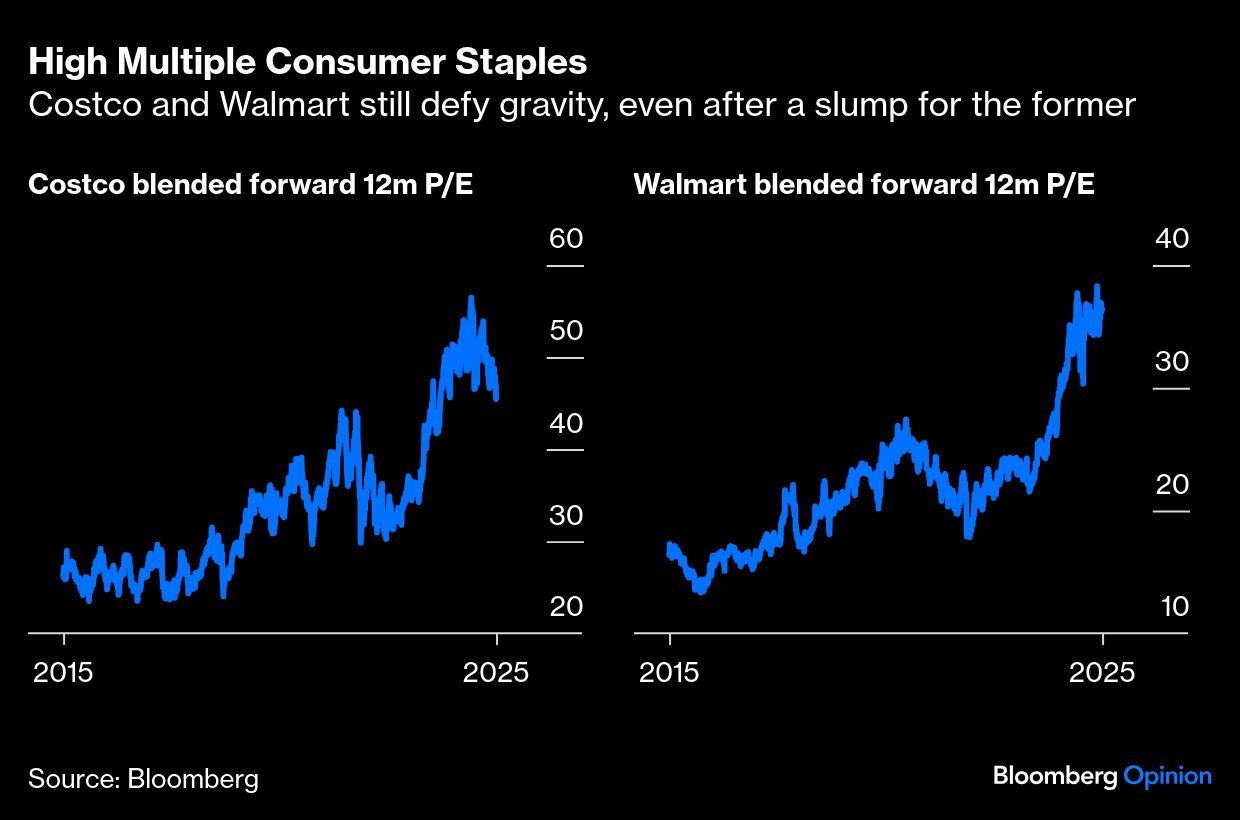
Another option is to jettison a couple high-flying consumer staples companies: Costco Wholesale Corp. and Walmart Inc. As I wrote last month, these stocks constitute one of the market’s great valuation mysteries. Despite being relatively mature businesses with narrow profit margins, both have seen their valuations surge to Nvidia levels (Walmart) or higher (Costco), and they’re now far above their own 2015-2024 averages. The bulls attribute this trend to the companies’ impressive earnings growth and the perception that they’re all-weather stocks, largely insulated from the vicissitudes of economic cycles.
Ironically, their reputation as safe investments may have caused their stock prices to climb to increasingly untenable levels. Their market penetration is already so deep that it’s hard to imagine where they’ll find the growth to justify their lofty valuations. So if you ditch these two stocks, you can knock index valuations down 0.2 — not a game-changer, but another incremental improvement. If you also jettison the newcomers, you’d now be at a multiple of 21.6 times forward index earnings.
Which brings us to the true elephant in the room, or rather market: Nvidia. The chipmaker supplying the artificial intelligence boom is both the single-biggest culprit for the current index valuation and the single-biggest driver of index returns over the past several years. Is it worth the risk to sell its stock and rest comfortably? Maybe not. As Goldman Sachs Group Inc. analysts have framed it, the stock market’s “AI trade” started with Nvidia (Phase 1), and that’s where most of the real AI profits are still being made. But the trade has since moved on to include AI infrastructure stocks (Phase 2) and is broadening to affect the valuations of software and tech services shares (Phase 3). Ultimately, Goldman expects the trade to expand to a variety of other industries as they see productivity benefits from the new technology (Phase 4).
Nvidia has so far delivered the sales and profits to match the optimism, but some observers say the Phase 1 trade has run its course. How long can Nvidia’s top customers keep burning cash to buy its GPUs? And what happens if a competitor manages to breach its competitive moat? Even if AI optimism rages on, maybe the better risk-reward is migrating into the later phases of investment opportunities. Sell Nvidia and you’ll knock the index’s blended forward P/E down by 0.7. Combine that move with the other ideas here and you’re at 20.9.
The final option is more of a thought experiment than a serious proposal. This is the “in case of emergency, break glass” portfolio rebalancing — the one you only use after Warren Buffett and the late Charlie Munger visit you in a dream and tell you that the market apocalypse is nigh. The maneuver? Just sell the entire information technology sector, which includes Nvidia and several of the expensive newcomers. Tech amounts to an extraordinary 34.6% of the index and has a sector forward P/E of 29.9, meaning you could drop your portfolio forward P/E by 2.9 points simply with this one change. Combine this with the other steps and you’d be at a forward P/E of 19. But who could ever have the conviction to do something so extreme, potentially forgoing just about all of the near-term upside from AI?
The good news is that high valuations still aren’t all that diffuse in the market. If you’re inclined to worry about such things, there are plenty of ways to sleep better at night without moving into cash.
In some of theses cases, the tradeoffs perhaps aren’t all that difficult. For instance, it may be relatively easy to jettison the newcomer stocks I’ve flagged, since some investors never wanted so much exposure to 100-plus P/E stocks in the first place. Tesla in particular has generated much volatility with little in the way of returns since its 2021 peak. Meanwhile, you could drop Costco and Walmart without fundamentally relinquishing your claim to the future cash flows from AI. Granted, you still can’t get all the way back to the “valuations of old” without confronting some very hard decisions, but at least you can get close.
A message from Advisor Perspectives and VettaFi: Discover something new! Click here to register for our upcoming webcasts.
Bloomberg News provided this article. For more articles like this please visit
bloomberg.com.