With all the uncertainty around big policy questions that directly affect companies, notably tariffs and immigration, forecasting has become thorny for Wall Street analysts. “In my career, I don’t recall so much uncertainty in such a short period of time,” veteran analyst Ed Yardeni told Bloomberg News recently. David Kostin, Goldman Sachs Group Inc.’s chief US equity strategist, cautioned clients that “the shifting tariff landscape creates large uncertainty around our earnings forecasts.”
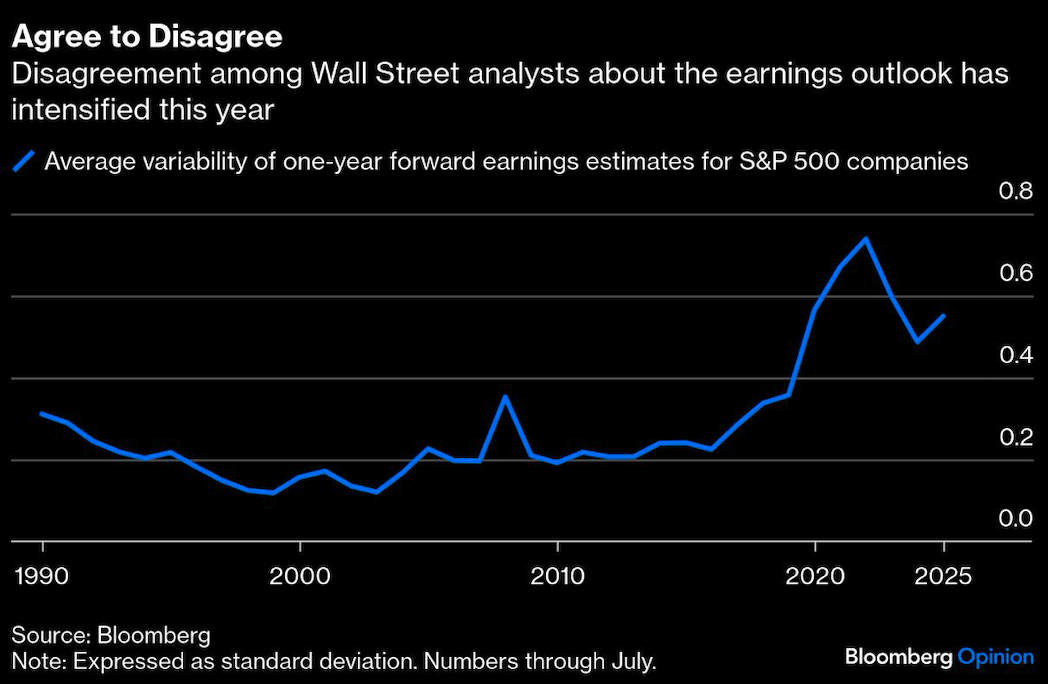
Indeed, analysts increasingly disagree about what that uncertainty means for corporate profits, as I pointed out in a recent column. While the average earnings forecast for the S&P 500 Index over the next year has risen since the Trump administration’s tariff rollout on April 2, the variability around that average has widened, showing the difficulty of pinning down earnings.
Analysts, after all, don’t have any special power of foresight. Historically, their forecasts have been very reliable when earnings are growing but less dependable around turns, which makes sense. Earnings tend to grow steadily from year to year, so forecasting a 5% to 10% increase in profits, which is usually what they do on average, is normally a safe bet. Occasionally, though, earnings are thrown off course by some unusual event, such as a financial crisis or pandemic or the bursting of a speculative bubble. Those reversals are hard to anticipate.
But what if growing disagreement among analysts is an early warning sign of pending disruption — or at least of a rising probability of disruption? To answer that question, I compiled the variability of analyst estimates at year end for each company in the S&P 500 back to 1990,1 the longest period for which Bloomberg data is available. I then calculated the average variability across all companies to see the extent to which consensus among analysts is growing or declining from year to year. (I intentionally focused on averages rather than medians because I wanted to account for outliers, although the results are not materially different using medians.)
I found two surprising results. One is that disagreements among analysts have intensified over time. The average variability of estimates across S&P 500 companies is nearly twice as high today as it was in 1990. I expected more consensus, not less, given that there’s vastly more information available now than three decades ago. But maybe it’s the Dunning-Kruger effect at scale, where the more analysts know, the less conviction they have.
More relevant to the moment, I also found a sharp rise in average variability before and during the early stages of earnings recessions and accompanying stock market selloffs. Variability rose 45%, for example, from 2000 to 2001 as the dot-com crash unfolded. It rose 80% in the lead up to the financial crisis in 2008. And it more than doubled from 2020 to 2022, as a wave of selloffs during the pandemic that began with speculative stocks such as Roku Inc. and Peloton Interactive Inc. eventually spread to technology giants such as Amazon.com Inc. and Alphabet Inc.
The opposite was also true: Average variability generally declined or remained stable during bull markets. It declined by nearly two-thirds during the long bull market of the 1990s and was mostly stable during the market’s multiyear recovery from the financial crisis. The one false alarm was a spike in variability from 2003 to 2005 as the market began to recover from the dot-com bust.
So where are we now? Variability dropped sharply after the tech bust in 2022, but it’s on the rise again, up about 13% since the beginning of the year. While not a huge change in historical terms, it’s moving in the wrong direction. If disagreement about the path of earnings continues to grow, it may be an early warning that the business environment is souring.
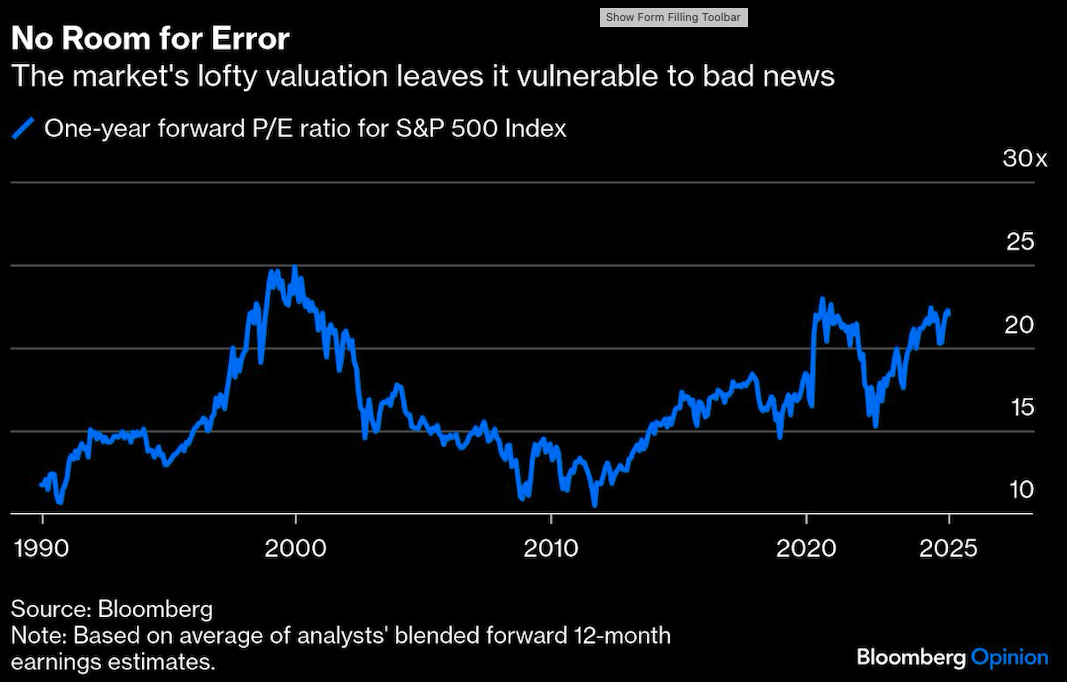
And if it does, the first thing the market is likely to reconsider is its lofty valuation. The S&P 500 trades at 22 times analysts’ average earnings forecast for the next 12 months. Since 1990, the market was only more expensive on that basis at the height of dot-com mania in 1999 and 2000 and the tech craze earlier this decade. Then as now, analysts increasingly differed on the earnings outlook that supported the market’s high valuation. In both cases, the market eventually bottomed closer to 14 times forward earnings.
I’m not suggesting that a similar decline is imminent or even inevitable. For one, the available data series is only three decades long and includes just three big selloffs, so there isn’t enough history to make sweeping conclusions. The data set is further limited by the fact that, in 1990, analyst coverage extended to about two-thirds of the S&P 500 — it didn’t span the full index until the mid-2000s.
Still, the experience of the past three decades suggests that when there are growing disagreements about the path of earnings, the outlook is becoming murkier — and probably for a reason worth keeping an eye on.
1. Analysts covered about 300 companies in the S&P 500 in 1990. That grew to span the full index by the mid-2000s.
A message from Advisor Perspectives and VettaFi: To learn more about this and other topics, check out some of our webcasts.
Bloomberg News provided this article. For more articles like this please visit
bloomberg.com.