Advisor Perspectives welcomes guest contributions. The views presented here do not necessarily represent those of Advisor Perspectives.
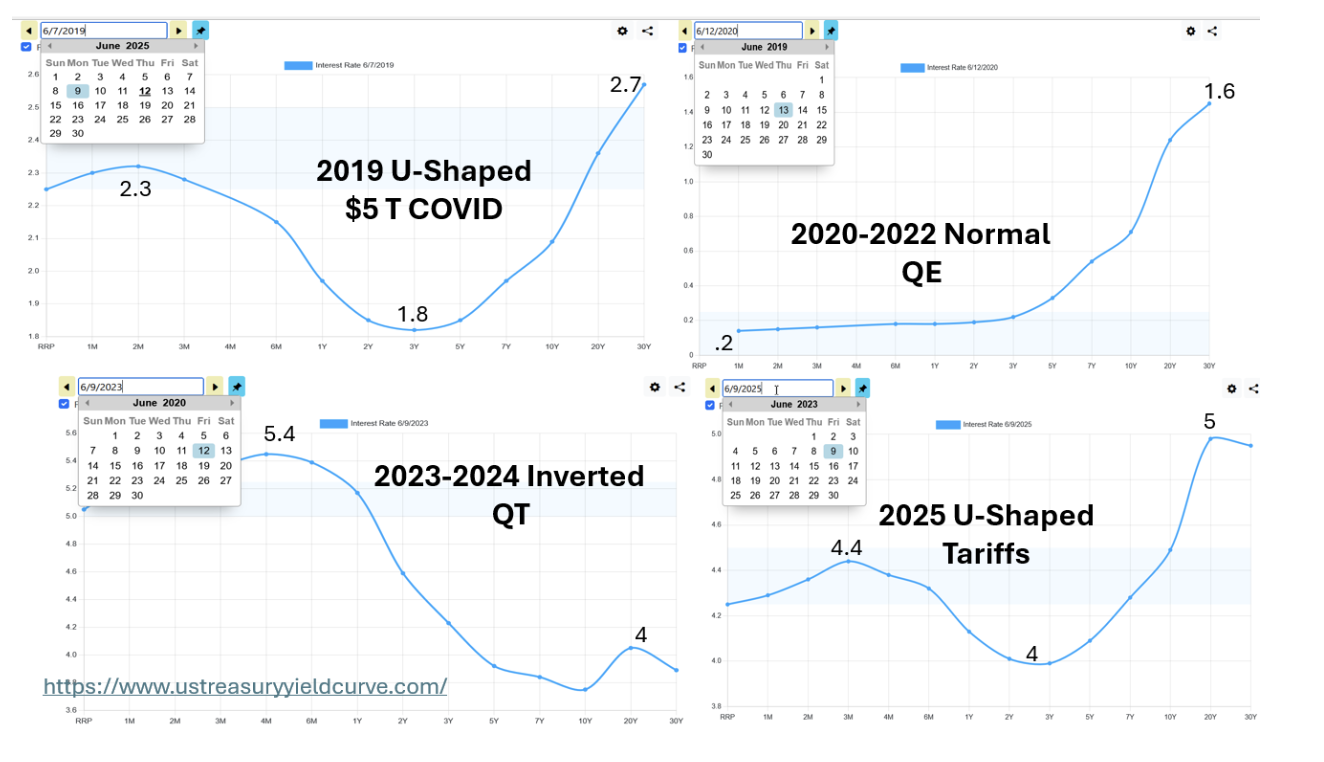
The yield curve for U.S. government bonds is currently very unusual — it’s U-shaped. As shown in the following, the curve has been shifting dramatically since COVID in 2019.
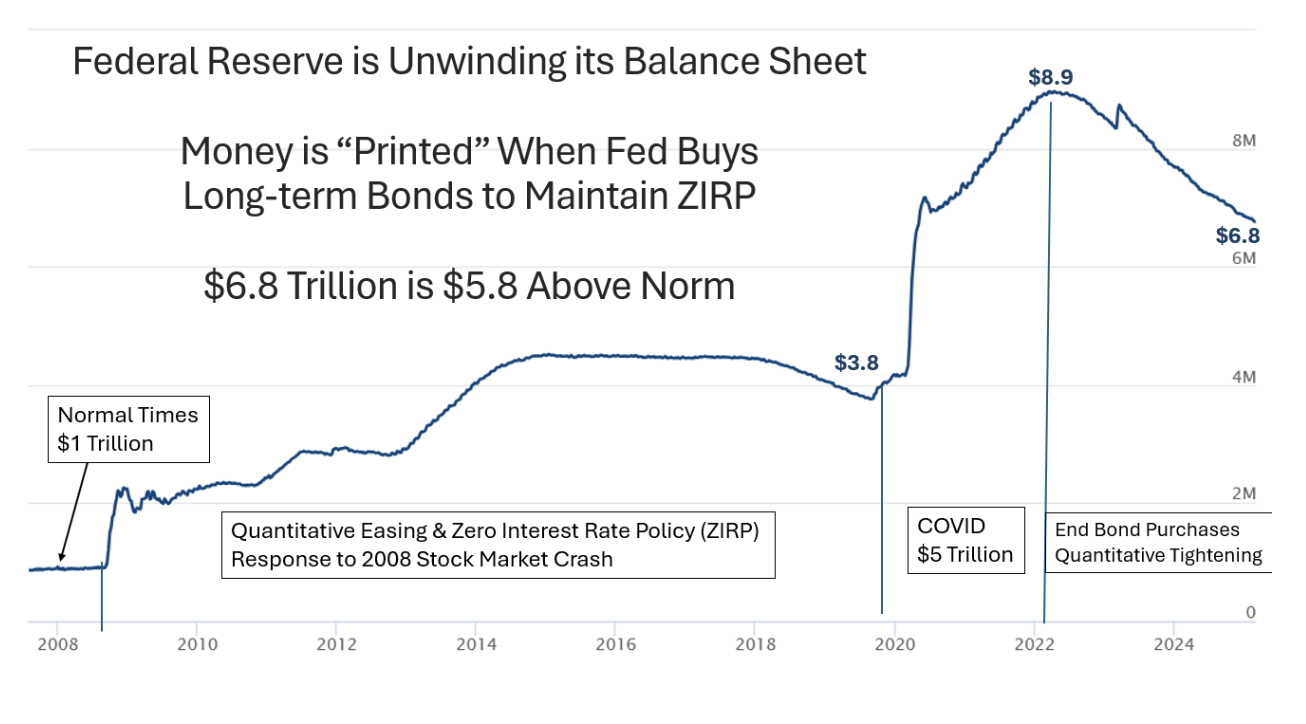
In addition to the changes in shape, also note the level of interest rates. Yields were very low — less than 2% — during Quantitative Easing (QE) in 2019 through 2022. They’ve increased above 4% since 2023, when the Fed took its foot off the interest rate brake under Quantitative Tightening (QT).
3 Shapes
The yield curve for U.S. Treasuries is currently U-shaped, which is very rare, even though it last happened as recently as 2019 under the stress of COVID spending. The press has reported that the temporary deferment of most tariffs is due to the reaction of the bond market rather than the stock market. Interest on our national debt could cripple the economy and lead to serious inflation.
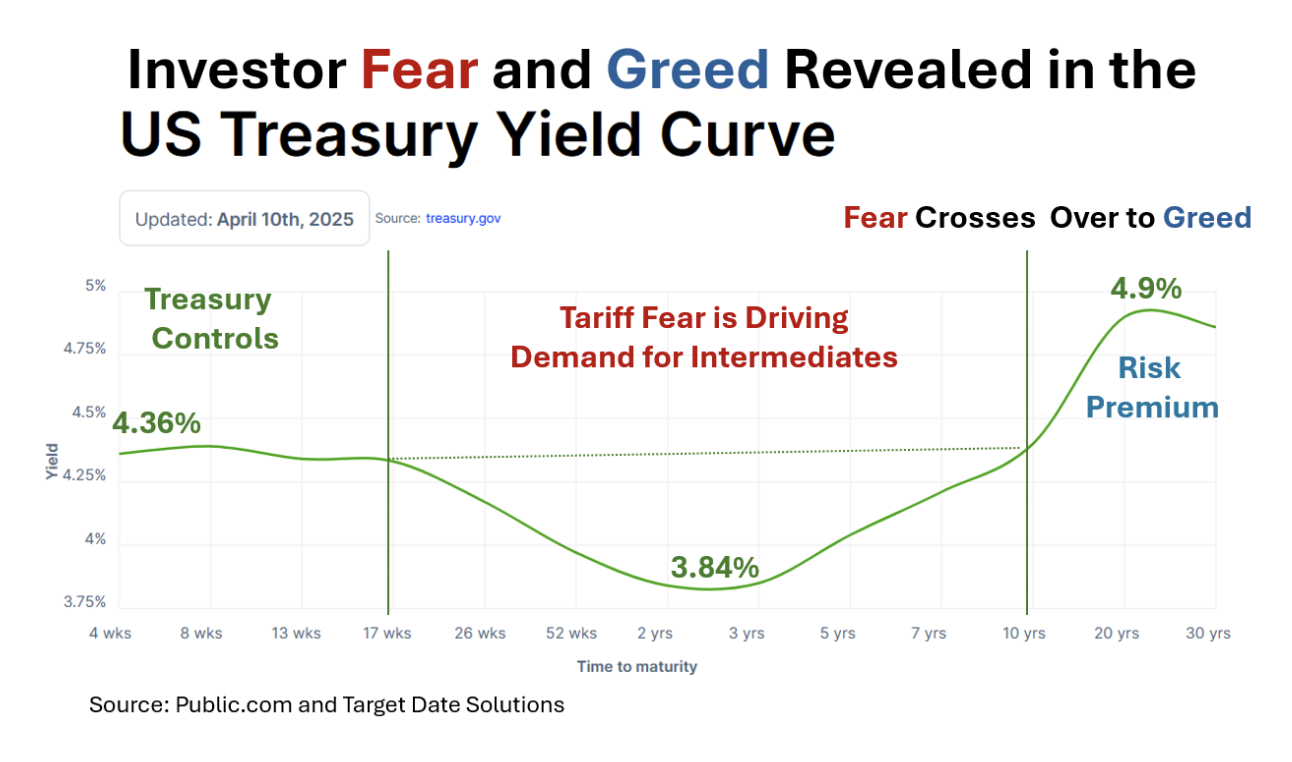
Normal yield curves are upward sloping because investors demand a risk premium for taking on the volatility in long-term bonds.
Sometimes the yield curve inverts to pay higher yield for short term, lower risk, T-bills. This unusual situation tends to precede recessions.
But the yield curve is very rarely both “normal” and “inverted” — U-shaped. One interpretation is that the impact of tariffs is expected to take a couple years, so the prices of two- to four-year notes have been bid up, suppressing yields in that maturity range.
Grok AI offers the following explanations for a U-shaped yield curve:
The curve’s shape signals a market balancing near-term strength with longer-term uncertainty.
- High short-term yields: Fed’s tight policy and inflation persistence.
- Lower intermediate yields: Expectations of future rate cuts or slowdown.
- Higher long-term yields: Fiscal concerns and long-term inflation risks
Another Rarity: The Treasury Bought Back $10 Billion
On June 3, the Treasury bought back $10 billion in short-to-intermediate bonds. I think it was to save money. The Treasury’s previous largest buyback happened in 2000, at approximately $3 billion. The June 3 buyback is huge.
My guess is that the Treasury issued notes in the 2–5 year maturity range at 4% interest to finance the buyback of bonds that paid 4.4% at the near-dated end of the curve. The 0.4% savings on interest is $40 million on $10 billion in redeemed bonds. You’d think that supply-demand considerations would have flattened out the yield curve following the buyback, but it didn’t. Maybe my guess is wrong and/or $10 billion just isn’t enough to move the needle.
Conclusion
These unusual times bring to mind the Chinese curse “May you live in interesting times.” The term structure of interest rates tells an important story that investors need to heed. Intermediate term bonds are being bid up in anticipation of the potentially harmful effects of tariffs. Moving to the left (shorter maturity) provides higher yield with lower interest rate risk. That’s what the U.S. Treasury arbitraged on June 3 with $10 billion.
Ron Surz is president of Target Date Solutions, developer of the patented Safe Landing Glide Path and Soteria personalized target date accounts. He is also co-host of the Baby Boomer Investing Show. Surz’s passion is helping his fellow baby boomers at this critical time in their lives when they are relying on their lifetime savings to support a retirement with dignity, so he wrote a book, “Baby Boomer Investing in the Perilous 2020s,” and he provides a financial educational curriculum.
A message from Advisor Perspectives and VettaFi: To learn more about this and other topics, check out some of our webcasts.
More 529/College Planning Topics >
 Advisor Perspectives welcomes guest contributions. The views presented here do not necessarily represent those of Advisor Perspectives.