New research reveals that stock prices revert to a predictable P/E multiple, which is a function of growth and profitability. It also shows why growth stocks, while more profitable than value stocks, earn lower returns.
Over the period July 1926-August 2022, the stocks in the Fama-French U.S. Value Research Index returned 12.7%, outperforming the stocks in the Fama-French U.S. Growth Research Index, which returned 9.8%, by almost 3 percentage points per annum. Perhaps surprising to many investors, the outperformance of value stocks occurred even though growth stocks produced higher rates of return on assets and equity as well as faster rates of earnings growth. In a series of articles (see here, here and here), the research team at Verdad provided the explanations for the outperformance:
- While growth stocks have produced higher growth in earnings, the persistence of abnormal earnings growth was not greater than would be randomly expected, leading to investor disappointment.
-
Analysts’ forecasts systematically overshot the actual outcomes; their forecast errors became larger the further down the income statement (earnings available to equity investors) and the further out in time.
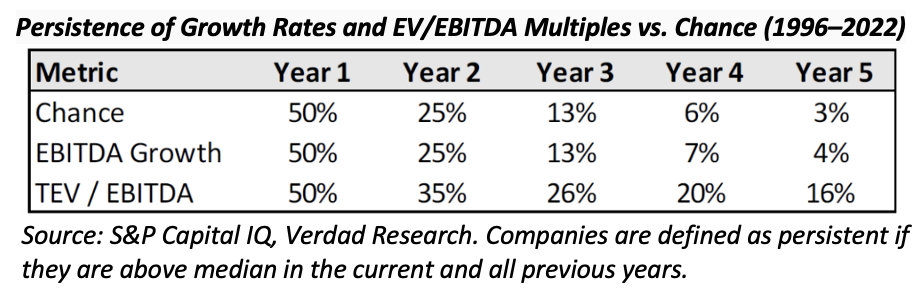
- While analysts have been too optimistic in their growth estimates, they have been able to correctly sort companies into high and low growers. Unfortunately, being able to predict that a company will produce abnormally high earnings growth is a necessary, but not sufficient, condition for generating excess returns (alpha). The reason is that it is not the forecast that matters, but the forecast relative to what is already priced in – not only have analysts been overly optimistic, but abnormal earnings growth shrinks at a rapid pace. As growth rates mean revert downward, so do valuation multiples. The result is that the benefits of strong growth in the short term are often offset by losses from changes in multiples that reflect the mean reversion of growth in the long term. As shown in the table below, valuations have been more persistent than growth:
Because valuations have been more persistent than growth even after multiple contractions, an expensive company can remain expensive relative to the market, and a cheap company can remain cheap or even get cheaper for years (as value investors experienced during the longest and most pronounced drawdown for the value premium in history, from late 2016 through late 2020, before reversing).
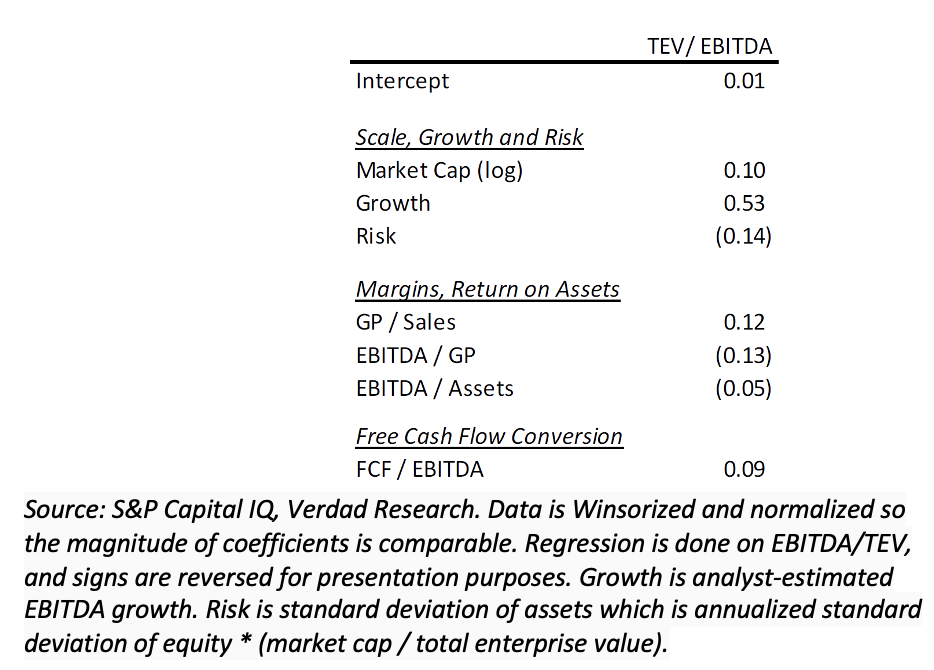
To understand what future multiples should be, Verdad’s Dan Rasmussen and Greg Obenshain built a simple model that would help them understand what drives present multiples. The table below shows the model’s results:
Rasmussen and Obenshain’s model, which explained 39% of multiple variation, revealed: “Growth is the most important variable and dominates other factors that determine multiples. Apart from growth, larger companies have higher multiples, and riskier companies have lower multiples. High gross margins and high free cash flow conversion are associated with higher multiples. Interestingly, a higher EBITDA to gross profit ratio is associated with lower multiples, which, upon investigation, appears to be because the market correctly prices mean reversion of very high and very low EBITDA to gross profit. EBITDA to assets, a measure of return on capital, has the opposite sign than we expected and is not particularly significant, also a surprise.”
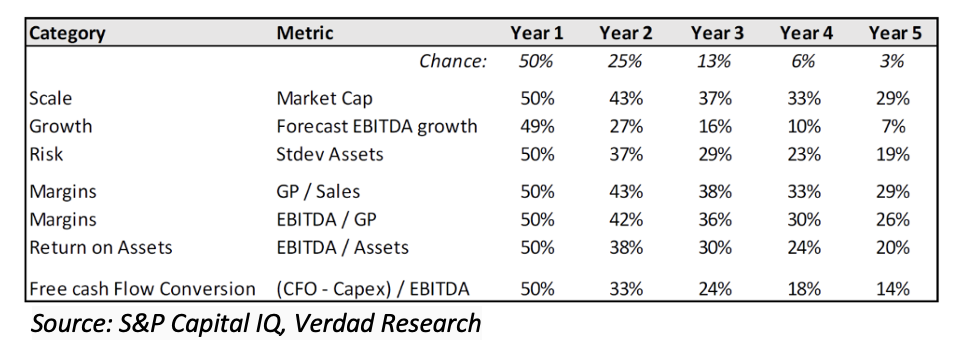
Rasmussen and Obenhshain next examined the persistence of these explanatory variables. The table below shows their findings:
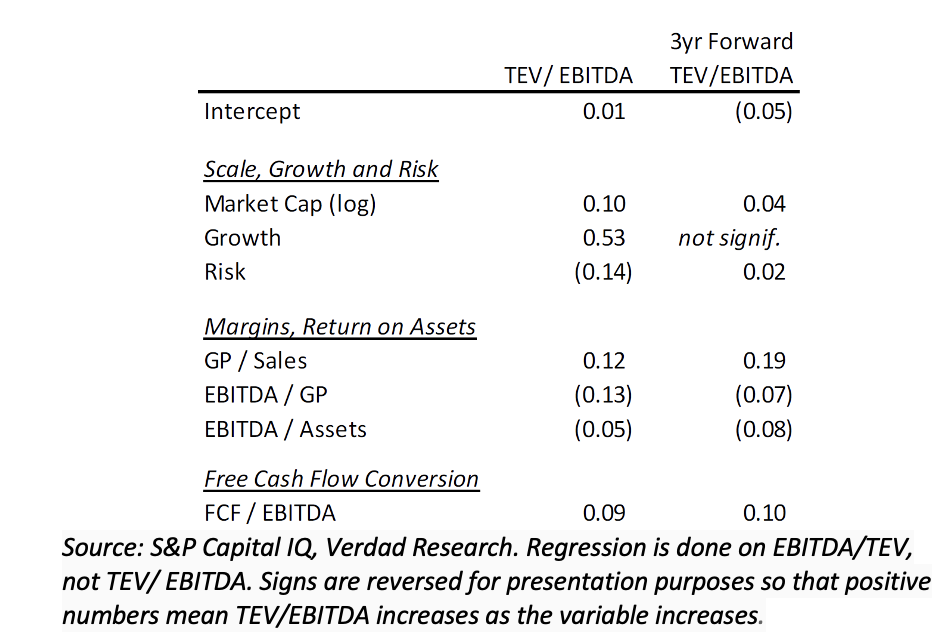
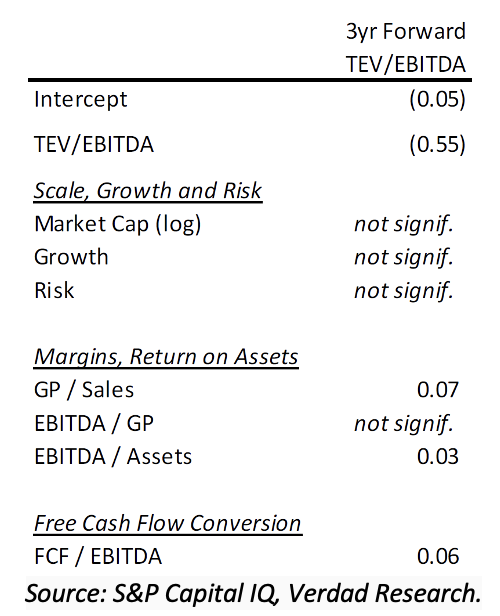
While growth did not persist much beyond the randomly expected, the other factors persisted at a much higher rate than chance. Thus, logically, they should be predictive of future multiples. To test that, they looked at how predictive each of these variables were of TEV/EBITDA multiples three years in the future. The table below shows the regression on current multiples on the left and future multiples on the right:
They found that growth became insignificant, and size (market cap) and risk faded as important factors. What they found most interesting was that gross profit margin and free cashflow conversion grew to become the most important variables for future multiples – margins and free cash flow matter to the long-term multiples after growth fades. Also of interest is that when they started adding TEV/EBITDA to the regression to predict future TEV/EBITDA, they found that mean reversion of the multiple was so powerful that the only factors that mattered other than starting TEV/EBITDA were gross margin, free cash-flow conversion and, to a small extent, size and return on capital (EBITDA/assets) – and the loadings on those factors were just 0.07 or below.
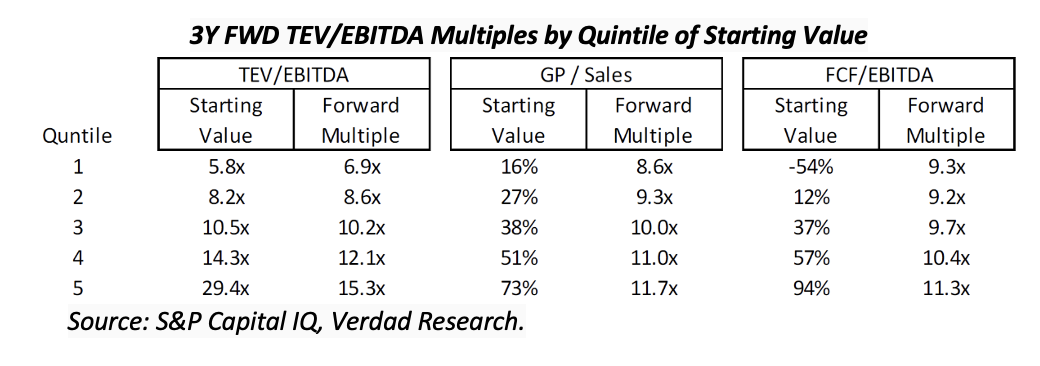
Their findings led Rasmussen and Obershain to conclude: “While starting multiples have a very wide range, they converge toward the median, but not completely. The fair range of multiples, as indicated by GP/sales and FCF/EBITDA is fairly tight, between 8x and 12x EBITDA. This is not full mean reversion, but it is close.” They added: “High multiple companies tend to keep a premium valuation even if that valuation tends to fall as growth is realized. But fundamentals like margins and free cash flow do in fact drive long-term valuations, and that range of valuations is very tight. Over the long run, there are mostly 8–12x EBITDA companies trading at valuations temporarily outside of that range, rather than 5–30x EBITDA companies that will stay that way forever.” The following table provides the evidence supporting their conclusions:
Investor takeaways
Rasmussen and Obershain showed that investors focused on determining the terminal multiple on a stock should start with the premise that multiples will dramatically mean revert, while giving companies with higher gross margins and free cash flow a higher terminal multiple than the market average (though not by much) as valuations. Their series of articles helps investors understand that while growth stocks not only tend to be more profitable companies that have higher rates of growth in earnings, they also tend to underperform value stocks. Keep this in mind whenever you hear the phrase, “This time it’s different!”
Larry Swedroe is the head of financial and economic research at Buckingham Wealth Partners.
For informational and educational purposes only and should not be construed as specific investment, accounting, legal, or tax advice. Neither the Securities and Exchange Commission (SEC) nor any other federal or state agency have approved, determined the accuracy, or confirmed adequacy of this article. Information may be based on third party data which may become outdated or otherwise superseded without notice. Third party information is deemed to be reliable, but its accuracy and completeness cannot be guaranteed. By clicking on any of the links above, you acknowledge that they are solely for your convenience, and do not necessarily imply any affiliations, sponsorships, endorsements or representations whatsoever by us regarding third-party websites. We are not responsible for the content, availability or privacy policies of these sites, and shall not be responsible or liable for any information, opinions, advice, products or services available on or through them. All investments involve risk, including loss of principal. The opinions expressed here are their own and may not accurately reflect those of Buckingham Strategic Wealth® or Buckingham Strategic Partners®, collectively Buckingham Wealth Partners. LSR-22-407
 New research reveals that stock prices revert to a predictable P/E multiple, which is a function of growth and profitability. It also shows why growth stocks, while more profitable than value stocks, earn lower returns.