 Frank Pape is the senior director, portfolio consulting for Russell Investments’ advisor and intermediary solutions business. He is a Certified Public Accountant (CPA) and Chartered Financial Analyst (CFA). Frank and his team are responsible for delivering market and economic insights and portfolio strategy advice to financial advisors and individual investors. Frank writes and speaks on topics including the global markets and economy, tax-smart investing and model performance.
I spoke to Frank on July 8, 2021.
Advisors and their clients face a problem: how to best plan in an environment of uncertain tax rates. Are the tax rates changing, and how might those changes impact advisors and their clients? Even if rates don't change or impact advisors, are there tax-related issues that they should be discussing with their clients?
Given where we are today, it's a great question. When we speak with advisors and investors, often the perception is that everyone’s tax rates are going to go up. But we don't know what's going to pass Congress this fall or winter, or when it might happen. If anything changes, it hinges on the very narrow majorities in both the House and the Senate. It’s hard to know.
Most of the proposals that have been put forward from an individual investor’s perspective have their crosshairs on capital gains, interest income and dividends. Those are areas advisors have the most control and impact over. But we know that even under the existing tax regime, taxes are often one of the biggest fees that a taxable investor pays. They are even larger than the net expense ratio, and often even higher than the advisor’s fee.
That means there is a great opportunity for advisors to gather net new assets. It's a great chance to move upmarket and differentiate themselves. The data from the Investment Company Institute (ICI) shows that taxable investors have invested nearly $10 trillion in the open-end mutual fund universe. Almost half of all dollars in open-ended mutual funds reside in taxable accounts. It's a great opportunity for advisors to be going after these taxable dollars.
The industry – broker dealers, custodians, and most asset managers – primarily focus on pretax returns in their quarterly reviews, fact sheets and websites. But for those nearly $10 trillion in assets, what matters is the after-tax return. We can help advisors be better at going after these after-tax dollars by understanding the impact of taxes.
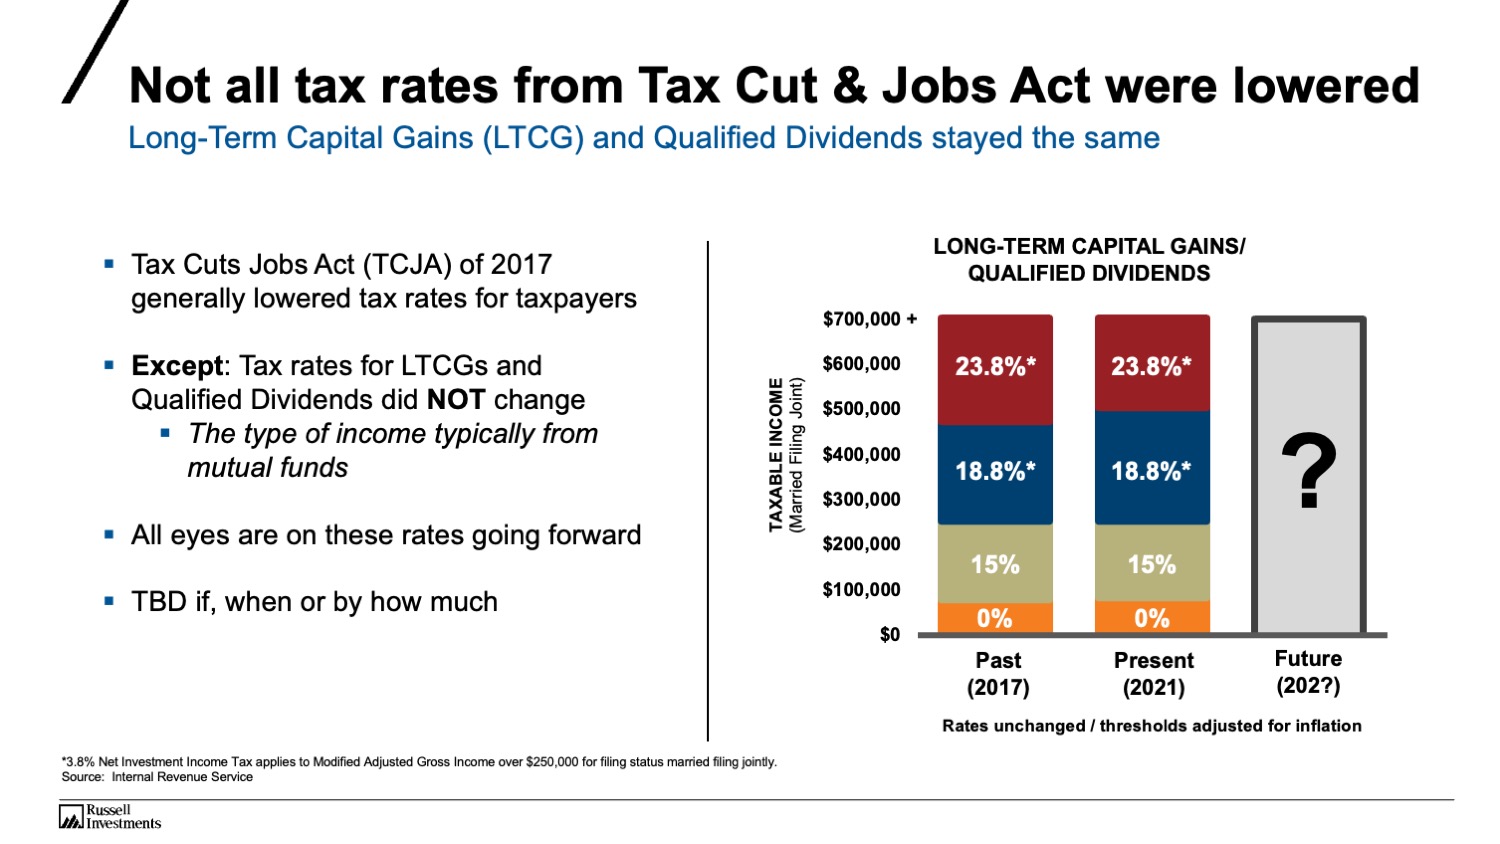
It's worth reminding everyone that the Tax Cut and Jobs Act, which was passed in December of 2017 and implemented January 2018, did not lower taxes for long-term capital gains and qualified dividends. The rates we have today are the same rates and almost the same thresholds we had in 2017. I’m not aware of any discussions or proposals to lower these going forward. Advisors can help to minimize investment taxes and be thoughtful around qualified dividends and capital gain recognition.
What are some of the things that advisors and their clients should be doing in advance of those possible changes and what would be the impact of those moves?
It’s hard to predict with certainty. As of now it’s hard to know specific rates and thresholds, but there are some scenarios where it makes sense to evaluate certain transactions sooner vs. later. Consider the following:
- A client who needs cash in the next 12 to 18 months and is likely going to sell an investment to raise that cash.
- A diversified portfolio that has drifted away from its target asset allocation given the strong markets we've seen in the last 12 months. When you rebalance, typically you sell the winners and move those proceeds to the other asset classes in the portfolio. That rebalancing can be a taxable event.
- One we see often in discussions with advisors are clients who own a mutual fund or a stock they've had for five, 10, 15, or 20 years, and they no longer have confidence in that investment. But they're reluctant to sell it because they don’t want to pay the tax related to the sale. So they have an investment they don’t like, but feel forced to keep it. If you think taxes might be going up in the next year, now is a good time to consider tax-gain harvesting. Investors may consider pulling that gain forward and paying that tax today when they know the applicable rate vs. a potentially higher rate in the future.
If an investor does harvest gains, this is a great opportunity to take those proceeds to be tax-smart going forward. Don't let the opportunity go to waste. At Russell Investments, we're able to run an analysis and help the advisor know what the payback period looks like if they make the switch to a more tax-smart approach. We want to help advisors make an informed decision on what the tax hit might be on that transition.
Which clients should care about taxes? Are those taxes a concern only for clients in the top tax bracket?
People often think that being tax-smart is something that only applies to those in the top tax bracket. It's true that the more you make, the higher the tax rate—generally. The more you make, the more you pay. But tax-smart investing is not just for those in the top tax bracket. Consider a couple with a filing status of married filing jointly and with taxable income above $82,000. Their marginal tax rate on wages, interest income, and short-term capital gains is 22%. So, 22 cents of every dollar is eaten up by taxes. And if their modified adjusted gross income crosses over $250,000, their long-term capital gains and dividends tax rate goes up to 18.8%. These thresholds impact a lot of investors, and likely most clients across an advisor's practice.
Regarding a solution, what advantages does active tax management offer over, say, some other approaches?
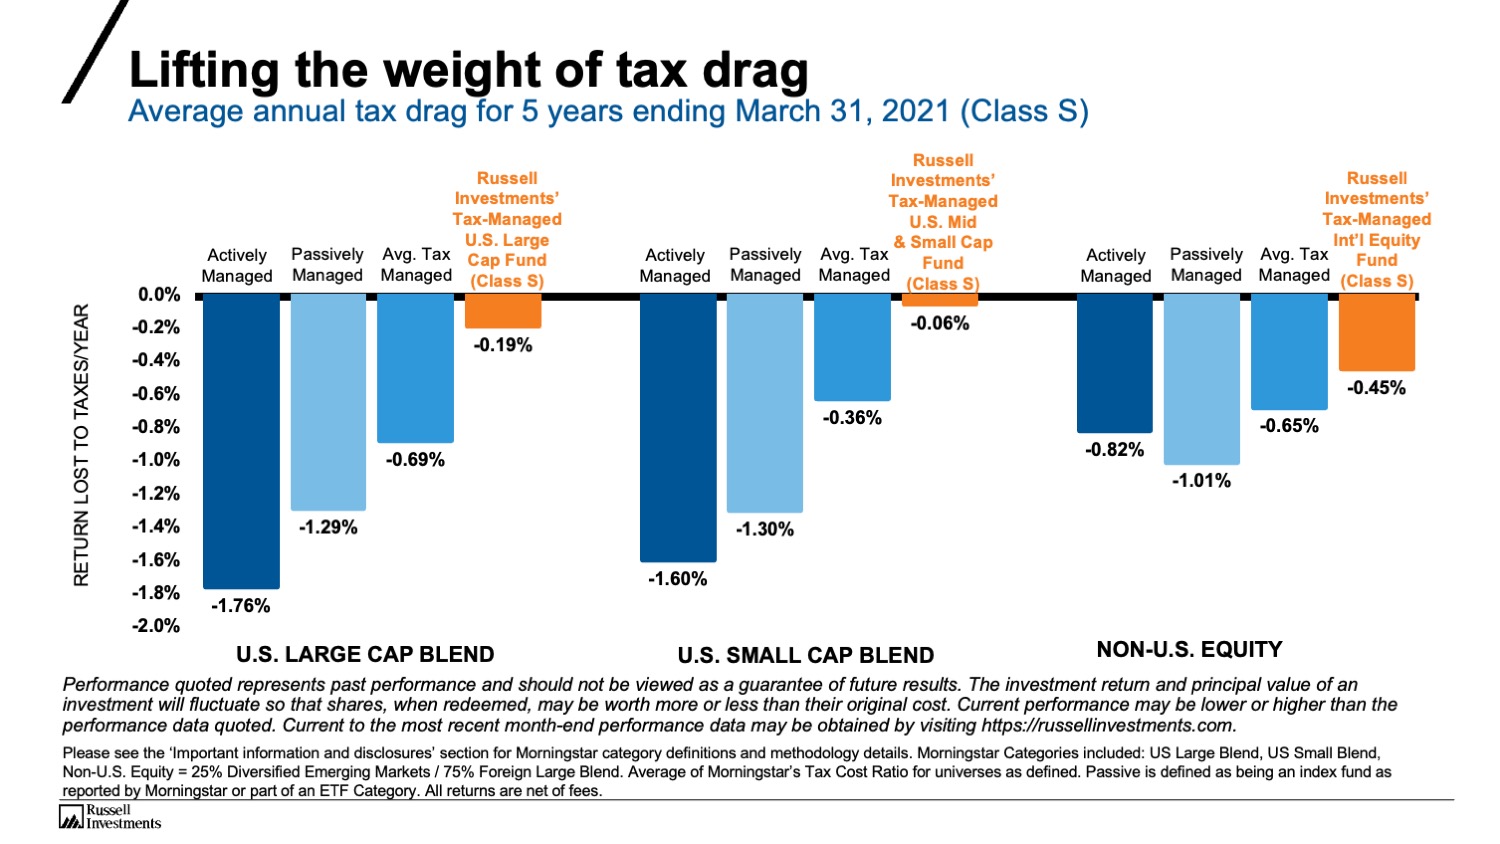
This is where Russell Investments can help. Most mutual funds are indifferent to taxes, given that they're focused on pre-tax returns. We think that an active, tax-smart mutual fund gives an investor an advantage. Much of the narrative for investors in taxable accounts is to look at passive options. Being active provides the opportunity for attractive pre-tax returns and to dial down that tax drag for potentially more attractive after-tax returns.
When I'm talking about tax drag, I'm referring to how much investment return is surrendered to taxes.
For example, let’s say you have a mutual fund that shows a one-year pretax return of 5%, but after you pay taxes on dividends and capital gains as reported on form 1099-DIV, the fund’s after-tax return is 3%. That is a 2% tax drag. Morningstar calculates this number and publishes it as the “tax-cost ratio” or how much return is lost to taxes. The return lost to taxes is caused by two main things: dividends/income and capital gains distributions.
Many investors are surprised to hear that index funds and ETFs have tax drag. Often, there are cases where an index fund faces selling pressure, due to redemptions, a benchmark change, or something that happens in the management of the fund. These changes can trigger distributions, and they can be considerable. Of course, this isn't the case for all passive vehicles, but it does happen more often than investors realize.
We look closely at the data showing the dividend income and gains in passive ETFs and index funds. That tax drag on an annualized basis can be 60 basis points and higher for some of the larger ETFs. It's common for the average across the passive universe to creep up to more than 100 basis points of lost return each year. ETFs may not have capital gains, but they do have tax drag based on their distributions.
What do you do differently in a tax-managed fund versus a standard fund or passive options?
There are a few things we focus on in our funds to try to improve after-tax return. One is active tax-loss harvesting all year, not just at year end. Tax-loss harvesting is the act of selling an asset that is lower in price than its original cost-adjusted purchase price. That difference between the selling price today and the lower basis or the purchase price is the harvesting of the loss. It's a tax asset that can be used to offset against gains in this year or in the years going forward. Done correctly, loss harvesting is potentially a great way to defer gains and maximize after-tax return.
Many advisors do tax-loss harvesting in November or December. But history shows that's often not the best time to try to look for loss-harvesting opportunities. Doing it consistently all year long can be advantageous for taxable accounts. Additionally, focusing on the difference between short-term and long-term gains can be quite additive to taxable portfolios. The tax rate between short- and long-term capital gains is almost two times higher for those in the higher tax brackets. Most mutual fund managers are indifferent to the holding period. But our tax-managed equity funds are very cognizant of the difference between short- and long-term recognition of gains. Also, we look at whether there is a preference for qualified versus non-qualified dividends. Non-qualified dividends are taxed at a higher rate, and we are very aware of where that return is coming from, through capital appreciation or yield.
More broadly, we get access to areas of the market where advisors may not consider looking for diversification and improved tax efficiency: emerging-markets equity, high-yield municipals, U.S. REITs, infrastructure and natural resources. Those are areas that advisors may shy away from in a taxable account. But at Russell Investments, we provide access to these areas in an active tax-managed offering looking to both improve diversification and after-tax return.
What are Russell Investments’ tax-managed offerings?
We have been in this space since 1985, when we launched our Tax-Exempt Bond Fund. Our tax-managed U.S. equity funds were launched in the late 1990s, and our Tax-Managed Model Strategies, which are models built-up using our funds, were introduced in 2003. We have a long history of innovation and product development in this space.
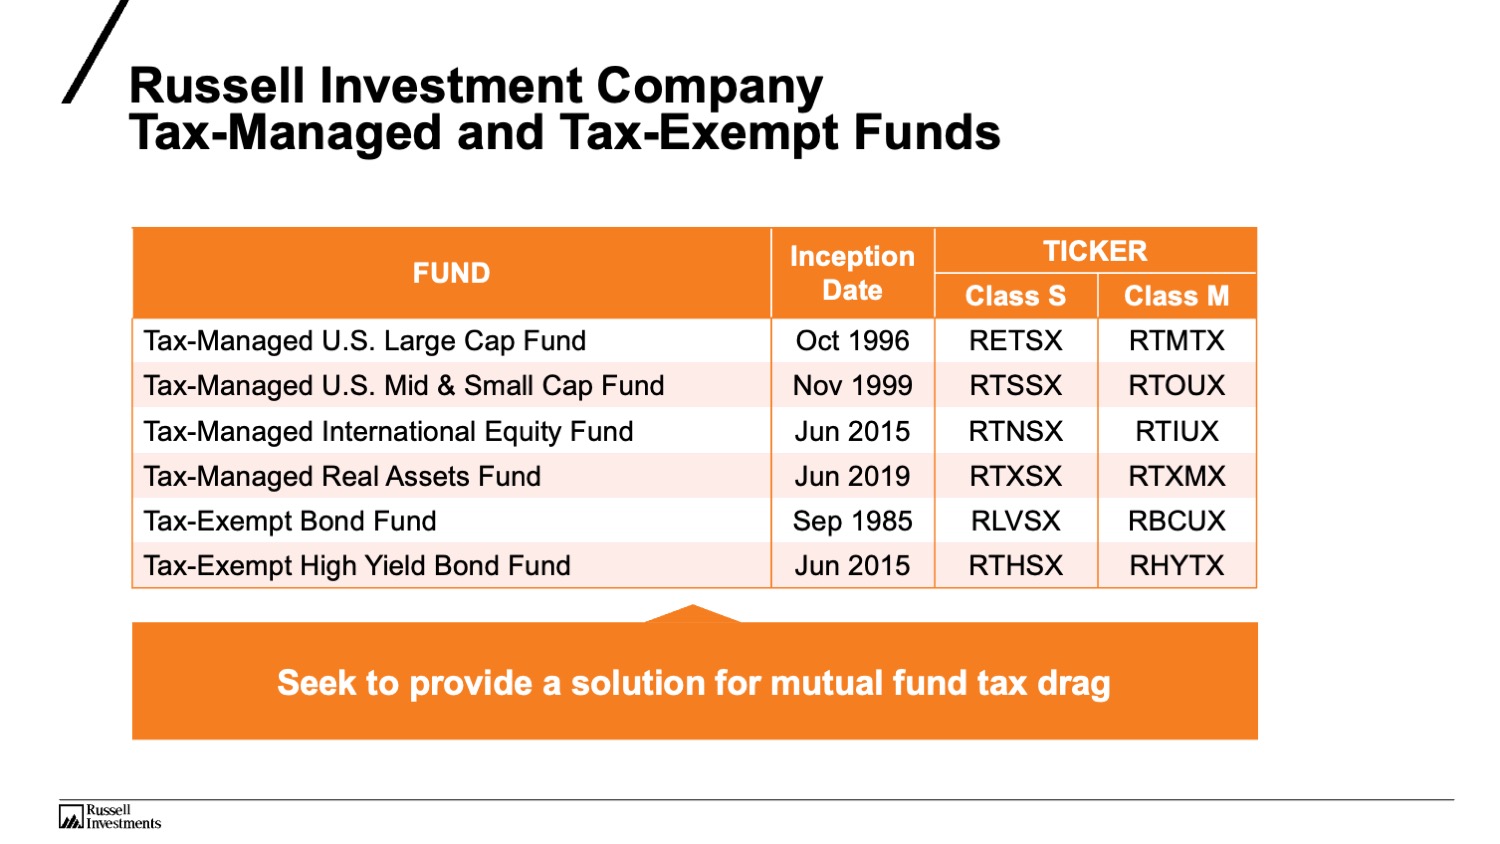
Part of that development happened this year. We launched our Personalized Managed Accounts (PMA) offering, which provides actively managed separate accounts and direct index strategies. It's exciting because it builds on our tax-managed track record. It allows investors to express their own specific preferences and get customization at their own portfolio level with a high degree of personalization.
How can advisors evaluate the amount of tax drag? Is this information available for advisors to evaluate in their portfolios?
Historically, it’s actually been surprisingly hard for advisors to evaluate tax drag because the information has been difficult to find and even harder to do a comparison between investment A and investment B in regard to after-tax return. To help address that, in 2020, we launched our Tax Impact Tool. It allows users to see the return lost to taxes and the after-tax return for just about all the mutual funds and ETFs available to U.S. investors. Until you see the amount of return lost to taxes, it's hard for folks to get their mind around this topic. We found this tool to be helpful in discussions among advisors and investors.
Our team can analyze a portfolio for tax efficiency and help advisors make an informed decision between different investment options.
How else does Russell Investments help advisors succeed in this space?
Our work with advisors is much more than our product offering. Our team at Russell Investments has the ability to help advisors succeed through several value-add resources. Our transition analysis focuses on potential portfolio transitions. We have the Tax Impact Tool that I mentioned earlier. And we have a full portfolio proposal system to help demonstrate better outcomes by improving tax efficiency. In other words, we have an entire suite of tools to help advisors.
We've also had success with a turnkey process to help advisors connect with local CPAs and related centers-of-influence (COIs) in their area. We offer the CPAs CPE credits all in the name of trying to help the advisors and the CPA present a unified front for their joint clients and find referral opportunities where possible.
We also worked with Deloitte to develop our After-Tax Wealth Handbook to help advisors navigate these tax challenges and tax-planning approaches given the tax environment. This handbook has been well-received by the advisor community and is an excellent value-add resource.
Important information
This third party article is provided courtesy of Advisor Perspectives with reprint permission from the publisher.
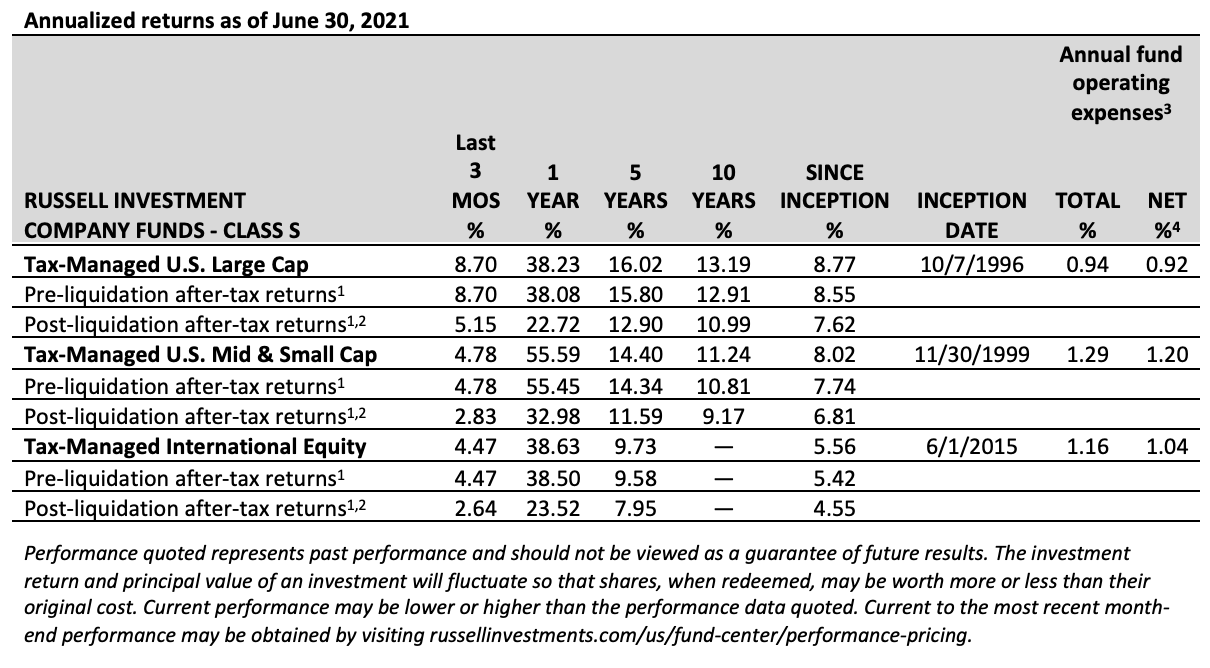
1After-tax returns are calculated using the historical highest individual federal marginal income tax rates, as well as the 3.8% net investment income tax, and do not reflect the impact of state and local taxes. Actual after-tax returns depend on an investor’s tax situation and may differ from those shown. After-tax returns shown are not relevant to investors who hold their Fund shares through tax-deferred arrangements such as 401(k) plans or individual retirement accounts. Returns After Taxes on Distributions may be the same as Returns Before Taxes for the same period if there were no distributions for that period.
2Return After Taxes on Distributions and Sale of Fund Shares. If a Fund has realized capital losses, the Return After Taxes on Distributions and Sale of Fund Shares assumes that a shareholder has sufficient capital gains of the same character to offset any capital losses on a sale of fund shares and that the shareholder may therefore deduct the entire capital loss.
3As of the most recent prospectus, dated 3/1/2021 or prospectus supplement dated 6/8/2021.
4The Net Annual Operating Expense Ratio may be less than the Total Operating Expense Ratio and represents the actual expenses expected to be borne by shareholders after the application of:
• for the Tax-Managed U.S. Mid & Small Cap Fund, a contractual transfer agency fee or advisory fee waiver through February 28, 2022.
• for the Tax-Managed U.S. Large Cap Fund, Tax-Managed U.S. Mid & Small Cap Fund, and Tax-Managed International Equity Fund, a contractual cap and reimbursement on expenses through February 28, 2022; These contractual agreements may not be terminated during the relevant periods except at the Board of Trustee's discretion. Details of these agreements are in the current prospectus. Absent these reductions, the funds return would have been lower.
Fund objectives, risks, charges and expenses should be carefully considered before investing. A summary prospectus, if available, or a prospectus containing this and other important information can be obtained by calling 800-787-7354 or by visiting https://russellinvestments.com. Please read a prospectus carefully before investing.
Important Risk Disclosures
Please remember that all investments carry some level of risk, including the potential loss of principal invested. They do not typically grow at an even rate of return and may experience negative growth. As with any type of portfolio structuring, attempting to reduce risk and increase return could, at certain times, unintentionally reduce returns.
Income from funds managed for tax-efficiency may be subject to an alternative minimum tax, and/or any applicable state and local taxes.
Indexes and/or benchmarks are unmanaged and cannot be invested in directly. Past performance is not indicative of future results.
Historical data shown not an indicator of future results. Other universes/indexes will produce different results.
Morningstar returns are not inclusive of sales charges.
End investors should consult with their financial and tax advisors before investing.
Tax-Managed U.S. Mid & Small Cap Fund
Russell manages a portion of the Fund’s assets to effect the Fund’s investment strategies and/or to actively manage the Fund’s overall exposures to seek to achieve the desired risk/return profile for the Fund.
Index-based strategies may cause the Fund’s returns to be lower than if the Fund employed a fundamental investment approach to security selection with respect to that portion of its portfolio.
Tax-Managed Real Assets Fund, Tax-Managed International Equity Fund and Tax Exempt High Yield Bond Fund
The Tax-Managed Real Assets Fund, Tax-Managed International Equity Fund and Tax Exempt High Yield Bond Fund are new funds. There can be no assurance that a new Fund will grow to an economically viable size, in which case the Fund may cease operations. In such an event, investors may be required to liquidate or transfer their investments at an opportune time.
MORNINGSTAR CATEGORY DEFINITIONS:
Large-blend portfolios are fairly representative of the overall U.S. stock market in size, growth rates, and price. Stocks in the top 70% of the capitalization of the U.S. equity market are defined as large cap. The blend style is assigned to portfolios where neither growth nor value characteristics predominate. These portfolios tend to invest across the spectrum of U.S. industries, and owing to their broad exposure, the portfolios' returns are often similar to those of the S&P 500 Index.
Large-growth portfolios invest primarily in big U.S. companies that are projected to grow faster than other large-cap stocks. Stocks in the top 70% of the capitalization of the U.S. equity market are defined as large cap. Growth is defined based on fast growth (high growth rates for earnings, sales, book value, and cash flow) and high valuations (high price ratios and low dividend yields). Most of these portfolios focus on companies in rapidly expanding industries.
Large-value portfolios invest primarily in big U.S. companies that are less expensive or growing more slowly than other large-cap stocks. Stocks in the top 70% of the capitalization of the U.S. equity market are defined as large cap. Value is defined based on low valuations (low price ratios and high dividend yields) and slow growth (low growth rates for earnings, sales, book value, and cash flow).
Mid-Cap blend portfolios invest in U.S. stocks of various sizes and styles, giving it a middle-of the-road profile. Most shy away from high-priced growth stocks but aren't so price-conscious that they land in value territory. Stocks in the middle 20% of the capitalization of the U.S. equity market are defined as mid-cap. The blend style is assigned to portfolios where neither growth nor value characteristics predominate.
Mid-Cap growth portfolios invest in stocks of all sizes, thus leading to a mid-cap profile, but others focus on midsize companies. Mid-cap growth portfolios target U.S. firms that are projected to grow faster than other mid-cap stocks, therefore commanding relatively higher prices. Stocks in the middle 20% of the capitalization of the U.S. equity market are defined as mid-cap. Growth is defined based on fast growth (high growth rates for earnings, sales, book value, and cash flow) and high valuations (high price ratios and low dividend yields).
Mid-Cap value portfolios focus on medium-size companies while others land here because they own a mix of small-, mid-, and large-cap stocks. All look for U.S. stocks that are less expensive or growing more slowly than the market. Stocks in the middle 20% of the capitalization of the U.S. equity market are defined as mid-cap. Value is defined based on low valuations (low price ratios and high dividend yields) and slow growth (low growth rates for earnings, sales, book value, and cash flow).
Small blend portfolios favor U.S. firms at the smaller end of the market-capitalization range. Some aim to own an array of value and growth stocks while others employ a discipline that leads to holdings with valuations and growth rates close to the small-cap averages. Stocks in the bottom 10% of the capitalization of the U.S. equity market are defined as small cap. The blend style is assigned to portfolios where neither growth nor value characteristics predominate.
Small growth portfolios focus on faster-growing companies whose shares are at the lower end of the market-capitalization range. These portfolios tend to favor companies in up-and-coming industries or young firms in their early growth stages. Because these businesses are fast-growing and often richly valued, their stocks tend to be volatile. Stocks in the bottom 10% of the capitalization of the U.S. equity market are defined as small cap. Growth is defined based on fast growth (high growth rates for earnings, sales, book value, and cash flow) and high valuations (high price ratios and low dividend yields).
Small value portfolios invest in small U.S. companies with valuations and growth rates below other small-cap peers. Stocks in the bottom 10% of the capitalization of the U.S. equity market are defined as small cap. Value is defined based on low valuations (low price ratios and high dividend yields) and slow growth (low growth rates for earnings, sales, book value, and cash flow). .
Municipal bond portfolios invest primarily in municipal bonds.
Methodology for Universe Construction:
-
Average of Morningstar’s Tax Cost Ratio for universes as defined.
-
Averages calculated on a given category. For example, average reflects the arithmetic average of the Morningstar Tax Cost Ratio for the universe/category as listed. Data includes all share classes
-
Large Cap/Small Cap determination based upon Morningstar Category.
-
If fund is indicated by Morningstar as passive or an ETF, the fund is considered to be passively managed. Otherwise, the fund is considered to be actively managed.
-
Tax Drag: Morningstar calculated Tax Cost Ratio.
-
Morningstar Categories included:
-
U.S. Equity: US Fund Large Blend, US Fund Large Value, US Fund Large Growth, US Fund Mid-Cap Blend, US Fund Mid-Cap Value, US Fund Mid-Cap Growth
-
Fixed Income (Taxable Bond): US Fund Long Government, US Fund Intermediate Government, US Fund Short Government, US Fund Inflation-Protected Bond, US Fund Long-Term Bond, US Fund Intermediate-Term Bond, US Fund Short-Term Bond, US Fund Ultrashort Bond, US Fund Bank Loan, US Fund Stable Value, US Fund Corporate Bond, US Fund Preferred Stock, US Fund High-Yield Bond, US Fund Multisector Bond, US Fund World Bond, US Fund Emerging Markets Bond, US Fund Emerging-Markets Local-Currency Bond, US Fund Nontraditional Bond
-
International Equity: US Fund China Region, US Fund Diversified Emerging Markets, US Fund Diversified Pacific/Asia, US Fund Europe Stock, US Fund Foreign Large Blend, US Fund Foreign Large Growth, US Fund Foreign Large Value, US Fund Foreign Small/Mid Blend, US Fund Foreign Small/Mid Growth, US Fund Foreign Small/Mid Value, US Fund India Equity, US Fund Japan Stock, US Fund Latin America Stock, US Fund Miscellaneous Region, US Fund Pacific/Asia ex-Japan Stock, US Fund World Large Stock, US Fund World Small/Mid Stock
-
The Morningstar categories are as reported by Morningstar and have not been modified. © 2019 Morningstar, Inc. All Rights Reserved. The information contained herein: (1) is proprietary to Morningstar; (2) may not be copied or distributed; and (3) is not warranted to be accurate, complete or timely. Neither Morningstar nor its content providers are responsible for any damages or losses arising from any use of this information. Past performance is no guarantee of future results.
Methodology for Tax Drag:
Includes all open ended investment products – mutual funds/ETFs that are both active and passive. Tax Drag reflects the arithmetic average of Morningstar Tax Cost Ratio. Data includes all share classes and reflects Morningstar category of US Equity and Taxable Bond for equities and fixed income respectively.
Russell Investments’ ownership is composed of a majority stake held by funds managed by TA Associates with minority stakes held by funds managed by Reverence Capital Partners and Russell Investments’ management.
Frank Russell Company is the owner of the Russell trademarks contained in this material and all trademark rights related to the Russell trademarks, which the members of the Russell Investments group of companies are permitted to use under license from Frank Russell Company. The members of the Russell Investments group of companies are not affiliated in any manner with Frank Russell Company or any entity operating under the “FTSE RUSSELL” brand.
Russell Investment Company mutual funds are distributed by Russell Investments Financial Services, LLC, member FINRA, part of Russell Investments.
Copyright © 2021 Russell Investments Group, LLC. All rights reserved. This material is proprietary and may not be reproduced, transferred, or distributed in any form without prior written permission from Russell Investments. It is delivered on an “as is” basis without warranty.
First Used: August 2021
RIFIS-23978